
18 June 2019
The Global Fatal Landslide Database: full dataset now online
The Global Fatal Landslide Database: full dataset now online
Thanks to the hard work of Dr Melanie Froude, my colleague here at the Department of Geography at the University of Sheffield, we have now posted the full Global Fatal Landslide Database online. This is the dataset that underpins our paper of last year (Froude and Petley 2018) that explored the human cost of landslides from 2004 to 2016 inclusive. However, this new version adds a further year of data, covering 2004 to 2017 inclusive.
The dataset can be accessed via an ARCGIS web application, which allows mapping of the dataset at a range of scales. The full dataset looks like this:-
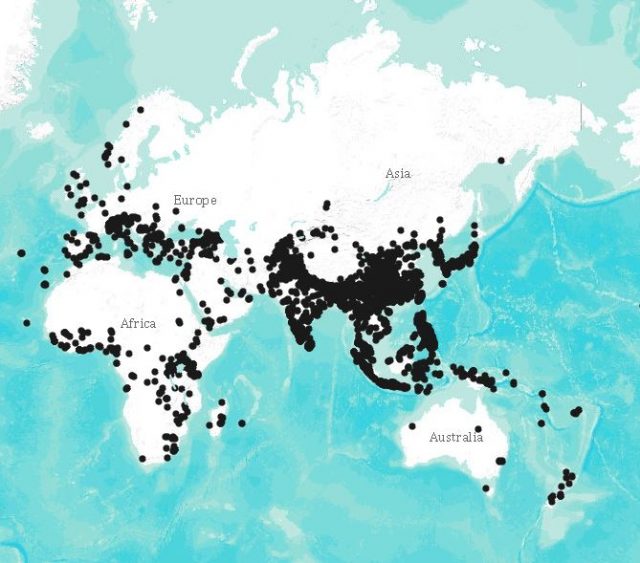
A simple map of the Global Fatal Landslide Database.
.
Whilst the application allows mapping at the national scale – this is the area around Nepal for example:-
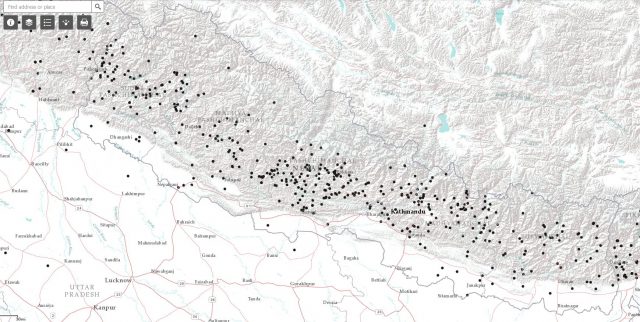
The Global Fatal Landslide Database: an example of a national level map – the distribution of fatal landslides in the area around Nepal.
.
And more detailed mapping is also possible – this is the distribution of fatal landslides on the island of Java in Indonesia:-
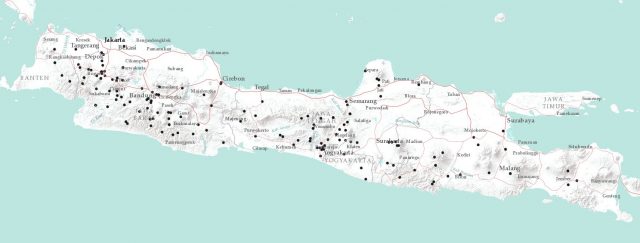
An example of a map from the Global Fatal Landslide Database – the distribution of fatal landslides on the island of Java in Indonesia.
.
Over the last couple of years, Melanie has remapped all of the landslides to verify their locations. In each case a polygon has been constructed that define the area in which we believe that the landslide has occurred. In some cases this polygon defines the landslide itself; in others it defines for example the village in which the landslide happened (where this is the most precise description that we have found). The mapping tool allows you to display this data, or the centroid of the polygon to generate a point.
Melanie has written a guide to the dataset, which can be found here:
https://drive.google.com/file/d/1FGI4cQuykv_CqPSd2Fe_x0Djqc6K8XWh/view
This provides full details of the dataset, and of course its limitations.
Perhaps most importantly, the full dataset is now available to download. The manual provides detail of how to do this, via a free public ARCGIS account. We have released the data as an asset for free public use. However, please acknowledge the following open source license and acknowledge the source of the data by citation. The dataset is covered by a University of Sheffield copyright and database rights reserved 2019. For the full license see
http://www.nationalarchives.gov.uk/doc/open-government-licence/version/2/
When using data in a publication, please cite the following reference:
Froude, M. J. and Petley, D. N. 2018. Global fatal landslide occurrence from 2004 to 2016. Natural Hazards and Earth System Science, 18, 2161-2181, https://doi.org/10.5194/nhess-18-2161-2018.
This paper is open access, so should be accessible to all.
If you are struggling to download the data, it is also temporarily available via a Google Drive folder:-
https://drive.google.com/open?id=1kxUSXBl10OHPrGXIur6bM4PBoKX0C_LY
This contains zipped shape files for each data layer.
Melanie and I hope that you will find both the web app and the dataset to be useful. Putting this dataset together has been a huge piece of work, which I started in September 2002 and continue today (so almost 17 years, and counting), whilst the mapping of the landslides, and the collation of the dataset, has been thousands of hours of work by Melanie. However, we believe that the effort has been worthwhile, and the work will continue for the foreseeable future.
17 June 2019
Longyan City: a dramatic landslide in deeply weathered soil
Longyan City: a dramatic landslide in deeply weathered soil
On 13th June 2019 a strong rainstorm struck Longyan City in Fujian province, southern China, triggering a major landslide that was captured on CCTV. The video has been widely shared online, and is available on Youtube:-
.
This is just one of many rainfall-induced incidents across southern China, with reports on the BBC suggesting that up to 61 people have been killed. The landslide in Longyan is reported to have killed one person, who was sitting in one of the cars.
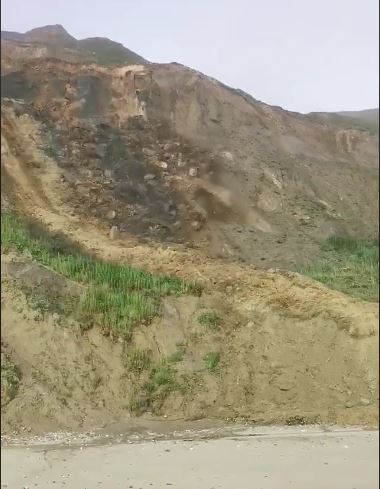
The still from the video below catches some of the key features of the landslide:-

The large landslide at Longyan city in Fujian Province in Xhina on 13th June 2019. Still from a video posted on Youtube by Xinhua / New China TV.
.
The video shows that the landslide was very highly mobile, implying that the soil has undergone liquefaction during failure. The material is a deep red colour, implying that it consists of deeply weathered soil and regolith, which is not unusual in the humid, subtropical climate of the southern part of China. The interaction between the landslide and the vehicles is interesting – note that they are pushed forward by the landslide rather than being buried or inundated. This illustrates the points that I made a dacade ago about rescuing the victims of landslides. It is crucial to understand the landslide mechanism and type of flow as many (but by no means all) landslides tend to bulldoze objects in their path, rather than burying them in situ.
In this case it will be interesting to understand better the underlying causes of the landslide. The failure appears to have swept down a slope that is at least partially vegetated, although that vegetation does not look like original forest to me. I wonder if the slope was but in order to create the bench for the road?
13 June 2019
Sidestrand: a complex coastal cliff landslide captured on video
Sidestrand: a complex coastal cliff landslide captured on video
Many media outlets have been featuring a video from Sidestrand in Norfolk, eastern England, showing a complex landslide event. This video was posted to Facebook by Brad Damms. It can be accessed here:
https://www.facebook.com/1636277407/videos/10216614936679301/
.
There is a good guide to the geology of this area on the Norfolk Project webpages, and the BGS have a good page about this site as well. In essence, the cliffs are composed of highly complex glacial deposits, mostly consisting of glacial till but including rafts of chalk. There are classic, and very beautiful, glaciotectonic folds found in the materials. The combination of weak, deformed materials and the storminess of the North Sea (which has a very high tidal range) means that these cliff are very susceptible to landslides. The BGS note the following in terms of landslides in this section of coastal cliffs:
The landslides at the Sidestrand test site are complex, consisting partly of large-scale, deep-seated landslides and partly of mudslides and debris flows. The deep-seated movements tend to have a dominant rotational component, but are in part translational. In some cases these extend to depths several metres below platform level, but are more usually entirely within the cliff. The landslides form deeply incised embayments which are arcuate in plan. The backscarps at the cliff-top tend to be sharply defined vertical features which persist after the landslide event. Deep-seated landslides tend to rotate to angles of 10 to 20 degrees and break up during failure transport, producing large debris aprons which spread across beach and platform. These are short-lived as the debris is readily removed by the sea. Such large events are followed by many mudslides and mudflows.
The event captured in the video above shows many of the characteristics of these landslides, with sequential cliff collapses transitioning into flows that have, in some cases, quite high mobility:-
A still from the video of the Sidestrand landslide in Norfolk. Video posted to Facebook by Brad Damms.
.
The video was captured by Brad whilst undertaking scanning of the cliffs for the scanLAB project. It will be fascinating to see what the scans show. The UK has just experienced a prolonged period of unusually heavy rainfall. This is likely to have been the immediate trigger for this event, although of course the underlying cause is wave erosion at the toe of the slope. This section of coast loses up to 3 m of land per year on average.
12 June 2019
The 2017 Nayong rock avalanche: an analysis using drone and seismic data
The 2017 Nayong rock avalanche: an analysis using drone and seismic data
On 28 August 2017 a catastrophic landslide (now known as the Nayong rock avalanche) occurred in Guizhou Province, China, causing multiple fatalities. I covered this event at the time, noting that remarkable footage had been collected of the event both from the ground and, astonishingly, from a drone. This rock avalanche has been analysed in detail in a new paper (Zhu et al. 2019) published in the journal Engineering Geology. Interestingly, the authors have combined the seismic data with the drone video to understand the dynamics of the failure. I believe that this is the first time an analysis like this has been undertaken.
This is an image from Zhu et al. (2019) showing the aftermath of the Nayong rock avalanche:-
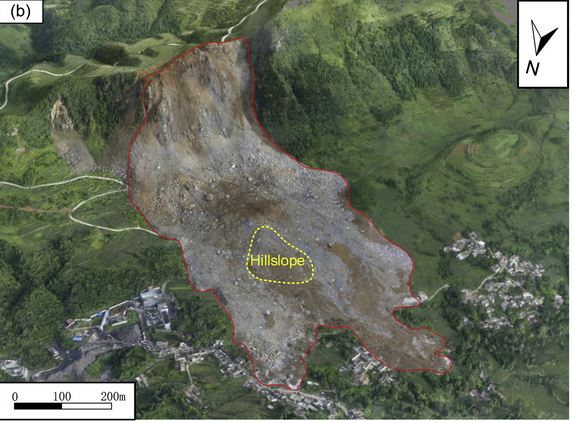
The aftermath of the Nayong rock avalanche. Image from Zhu et al. (2019).
.
The image shows that this was a catastrophic collapse of a limestone rock slope. The landslide occurred as five discreet events recorded by the drone, with the fifth being the largest. According to Zhu et al. (2019), this had a volume of about 490,000 m³, which then entrained a further 310,000 m³ from the slope. The rock avalanche descended a total vertical distance of 280 m, and travelled for a total distance of 820 m. It killed 35 people.
I think the most interesting aspect of this paper is seen in the seismic signal, and corroborated by the drone footage:-
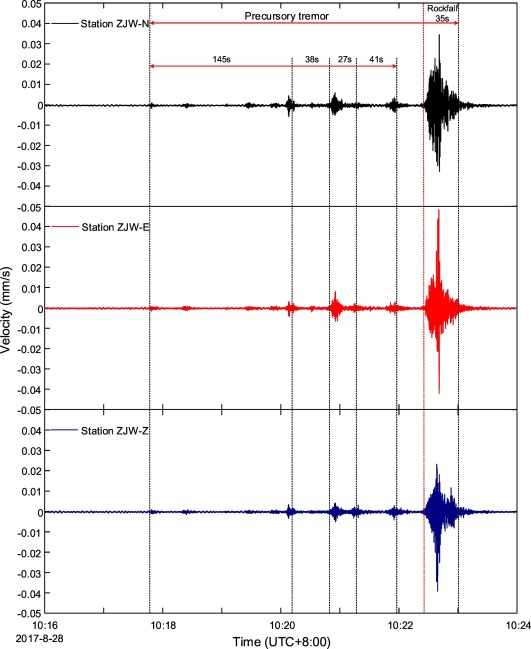
The seismic signal generated by the Nayong rock avalanche in China in 2017. Diagram from Zhu et al. (2019).
.
The seismic signal shows the first detected collapse event occurring shortly before 10:18, before the first major event, seen in the drone footage, just after 10:20. The seismic signal shows that the landslide was generating a series of small seismic signals, which are presumably indications of fracture and collapse occurring within the landslide mass as it began to fail. We have seen this pattern previously, and once again emphasises that rock slope failure is a time dependent process in which the final collapse is simply the final manifestation of long-term deformation and rock fracture. It is this phenomenon that allows the forecasting of some rock collapse events, if suitable instrumentation is deployed.
Reference
Zhu, Y., Xu, S., Zhuang, Y., Dai, X and Xing, A. 2019. Analysis of characteristics and runout behaviour of the disastrous 28 August 2017 rock avalanche in Nayong, Guizhou, China. Engineering Geology. Doi: https://doi.org/10.1016/j.enggeo.2019.105154
11 June 2019
Three new landslide videos
Three new landslide videos
Three good landslide videos have been posted to Youtube, all of which are worth a look. We are now moving into the rainy season across much of East and South Asia, meaning that landslide occurrence is increasing.
An impressive landslide in Fujian, China
This landslide, posted by New China TV, reportedly occurred in Sanming in Fujian in China. The reports indicate that it was triggered by heavy rainfall:-
.
This still seems to suggest that the landslide initiated on a steep slope that had been cut at the toe. Note the slope reinforcement on the lower part of the slope. It is also interesting to note the presence of the electricity pylon, which appears to be close to the crown of the landslide:-

The site of the landslide at Sanming in Fujian, Chine. Still from a video posted to Youtube by New China TV.
.
A large landslide in the mountains of Hunza, near to Attabad in Pakistan
Northern Areas of Pakistan has posted a nice video of an apparently large landslide in the Bulbul Kešk area of Gulmit in Gojal-Hunza in northern Pakistan, which occurred on 4th June 2019. The report indicates that the toe of the landslide reached Attabad Lake, causing the boat service to be suspended. Understandably, given the experience at Attabad nine years ago, this has caused a great deal of concern in the area.
.
A mobile landslide in Himachal Pradesh, northern India.
Finally, Khabar Bharat has posted a nice video of a much smaller but quite mobile landslide in Kullu District in the Karsha area of Himachal Pradesh in northern India:-
.
This landslide reportedly blocked the NH305 road between Aani and Luhri. Interestingly, the landslide appears to have occurred in dry conditions (note the large amounts of dust generated by the landslide). Slope cutting for the road might have been a key factor here.
10 June 2019
An image of the state of the Hidtroituango powerhouse
An image of the state of the Hidtroituango powerhouse
A year ago I wrote several times about the major problems being faced by the operators of the Hidroituango dam in Colombia, which had suffered from significant landslides and rock mass failures, which in turn drove emergency works to complete the embankment to allow the spillway to be used to manage the lake level. One effect was flooding through the cavern housing the turbines. Since then it has been quite challenging to understand properly the state of play with this facility as work continues to repair the damage. Images have emerged at various points showing the state of the Hidroituango powerhouse, all of which seemed to show substantial levels of damage. Last week, Patricia Garip, an independent journalist, published on Twitter what appears to be the definitive image of the condition of the facility. It is quite shocking:-
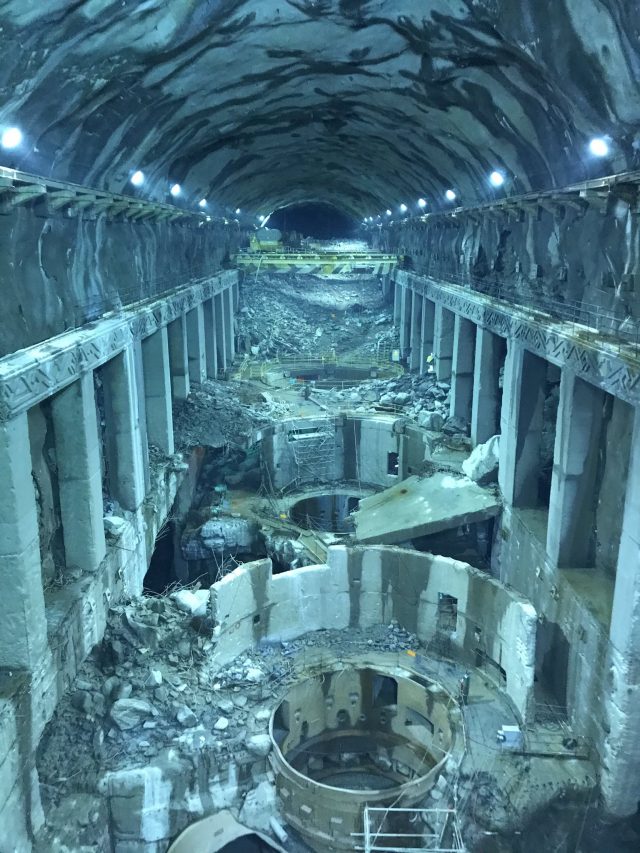
Image of the state of the Hidroituango powerhouse in June 2019. Image posted to Twitter by Patricia Garip.
.
Clearly the level of damage is high, with complete destruction to much of the concrete infrastructure, and heave damage and erosion to the remainder. At the far end of the cavern there is a very substantial debris accumulation. It is not clear to me as to whether this is a collapse of the rock mass or sediment deposited as a result of the flooding. Interestingly, there also appears to be considerable amounts of water present on the ceiling and walls of the cavern. I wonder why.
The authorities responsible for Hidroituango continue to assert that the damage to the site is repairable, and that Hidroituango will be generating electricity by 2021. Works continue to seal the various tunnels to secure the site, allowing full restoration to proceed. However, some questions continue to be asked about the integrity of the rock mass through the mountain, especially in light of the landslide problems at the site.
I would be interested in comments from those who know more about the true picture of this key project.
30 May 2019
High resolution Planet Labs SkySat image of the Joffre Peak landslides
High resolution Planet Labs SkySat image of the Joffre Peak landslides
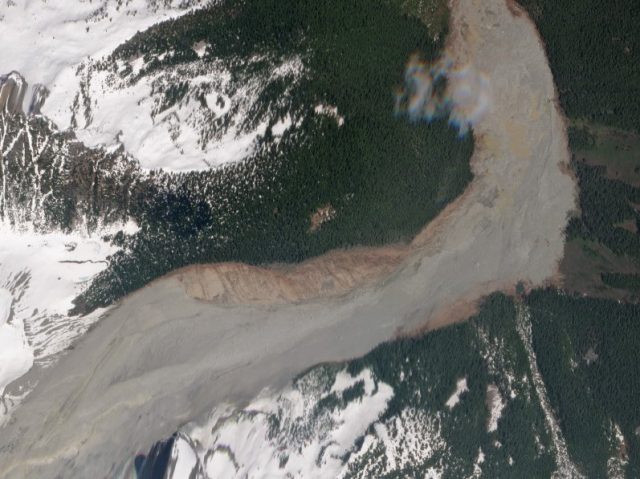
Planets Labs have kindly captured a high-resolution SkySat image of the Joffre Peak landslides:-
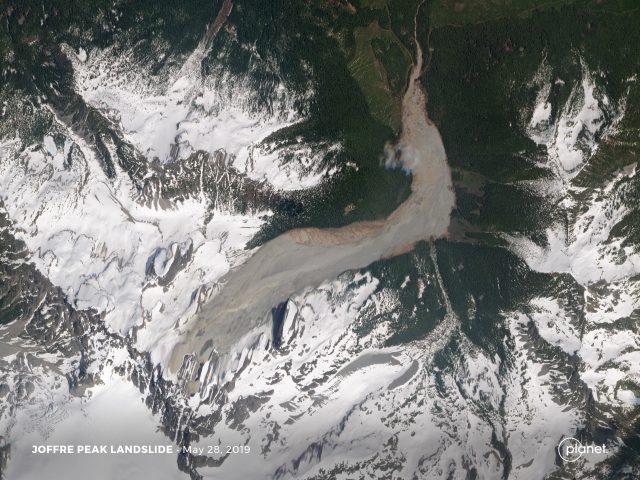
High resolution Planet Labs SkySat image of the Joffre Peak landslides. Planet Labs SkySat image, captured 28th May 2019, Copyright Planet Labs, used with permission.
.
This is a beautiful image, capturing the track of the landslide in full. Note that there are some distortions in the source area, an artifact of the processing of an oblique image to a vertical view. Of course there are better ways to capture imagery of very steep slopes than the use of satellite images. But, importantly, the track is fully imaged.
Perhaps the most interesting aspect of this image is the mid track section of the Joffre Peak landslides site:-
High resolution Planet Labs SkySat image of the main track of the Joffre Peak landslides. Planet Labs SkySat image, captured 28th May 2019, Copyright Planet Labs, used with permission.
.
In my earlier post I noted that there was little evidence of super-elevation in the lower bend of the landslide track (super-elevation occurs when fast-moving landslides travel around sharp corners; the landslide debris travel up the valley wall, much as a racing car moves to the top of a banked level of track). My interpretation of the image is that the landslide does appear to have undergone significant super-elevation around the first bend (in which it changed from a track towards the northeast to one towards the east). The evidence for this is the stripped slope, brown in colour and thus probably soil and weathered bedrock and rather than landslide debris. The landslide has stripped the trees from the slope.
There is a small amount of super-elevation in the first part of the second bend (where the track changes from eastwards to northwards), but much less than upstream.
The implication is that the Joffre Peak landslides were moving rapidly in the upper portion of the track, but more slowly when they hit the second bend. Immediately after the second bend there is a large area of deposition. Interestingly, there is also a considerable amount of deposition in the upper portions of the track.
Once again the high resolution imagery provides very clear insight into the landslide processes.
Reference and acknowledgement
Planet Team (2019). Planet Application Program Interface: In Space for Life on Earth. San Francisco, CA. Thanks to Robert Simmon of Planet Labs for obtaining and processing the image.
29 May 2019
The Baiyun–Liwan submarine slide: an ancient giant landslide in the South China Sea
The Baiyun–Liwan submarine slide: an ancient giant landslide in the South China Sea
It is well-established that the largest landslides on Earth occur in the oceans. The most famous is the Storegga slide in the northern Norwegian Sea, which is generally thought to have a volume of about 3,000 cubic kilometres. Whilst being remote from people, submarine landslides are not are of just an academic interest. They have the potential to generate significant and damaging localised tsunamis and they pose a significant risk to the increasing amounts of underwater infrastructure, such as power interconnectors, fibre-optic cables and pipelines.
In a paper in the Journal of Marine Science and Engineering, Zhu et al. (2019) report the discovery of a new, very large submarine landslide in the South China Sea. This landslide, termed the Baiyun–Liwan submarine slide, is located in the Pearl River Mouth Basin. The landslide is one of the largest discovered to date, covering a surface area of 35-40,000 km² and extending over a distance of about 250 km. The image below, from the paper, shows the landslide scar in the continental shelf margin:-
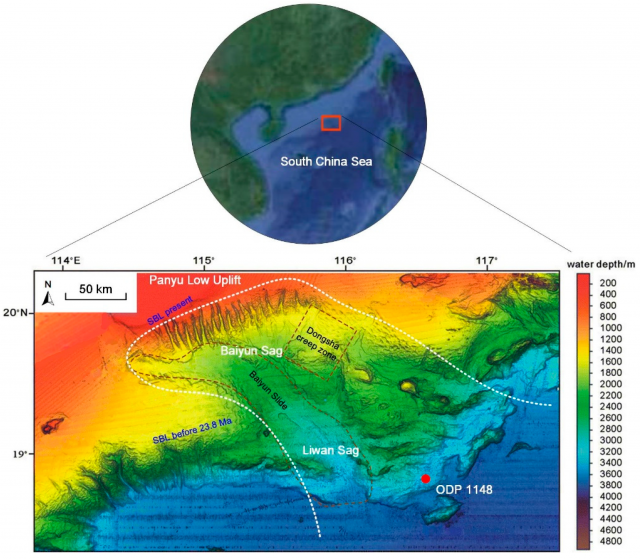
The scar of the Baiyun–Liwan submarine slide, from Zhu et al. (2019)
.
The white dotted line is the landslide scar. Note the scale bar to get an idea of the amazing size of this landslide.
The site has been drilled by the Ocean Drilling Program, site ODP 1148. The core recovered from this site shows a characteristic slump material, interpreted by Zhu et al. (2019) as being a part of the deposit from the Baiyun–Liwan submarine slide. This puts the date of the landslide at 23.5 to 24.5 million years ago. Note however that parts of this landslide are thought to still be active – for example, the Dongsha Creep Zone shown in the image above, still shows signs of slow movement today. Whilst this is small compared with the overall scale of the landslide, it is still huge, covering an area estimated to be about 800 km².
The trigger for this landslide is, of course, unclear. Interestingly, Zhu et al. (2019) speculate that it could have been associated with well-constrained tectonic deformation in this area at about the same time, and at least one other giant submarine landslide is found in the region dating from the same period.
A giant landslide of this type has the potential to generate a significant tsunami, as was the case for the Storegga landslide. Whilst the likelihood of such an event recurring is likely to be very low, the density of population and infrastructure (including offshore facilities) in the Pearl River Delta region means that the consequences could be high. Thus, such features deserve further investigation.
Reference
Zhu, C., Cheng, S., Li, Q. et al. 2019. Giant Submarine Landslide in the South China Sea: Evidence, Causes, and Implications. Journal of Marine Science and Engineering, 7 (5), 152. https://doi.org/10.3390/jmse7050152.
28 May 2019
Gongo Soco mine: another potential tailings dam failure in Brazil
Barão de Cocais: another failing tailings dam in Brazil
In Brazil another tailings dam, at the Gongo Soco mine in Barão de Cocais to the east of Belo Horizonte, is at risk of failure. Multiple local news agencies are covering the story, and contingency plans are in place. Fortunately, unlike at Brumadinho and Samarco, the potential failure of this dam has been detected prior to a major release of tailings (I noted that there was a risk at this site in March), and a suitably cautious approach is being adopted.
The best oversight of the issue at Gongo Soco can be found in a detailed article on em.com.br (in Portuguese – see the Google Translate version), with a less detailed (but still useful) English analysis available via France 24. The failure scenario in this case is quite complex. This is the Google Earth view of the site, on which I have marked the major features. The location is -19.973, -43.584:-
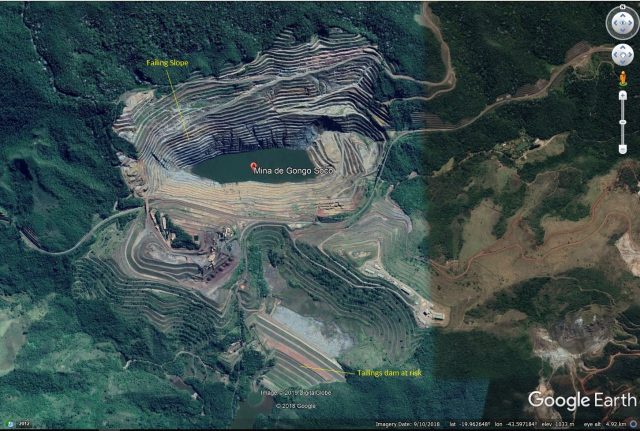
Annotated Google Earth image of the Barão de Cocais dam site at Gongo Soco mine in Brazil
.
At Gongo Soco, a large section of the pit wall in the abandoned Gongo Soco mine is displacing. Movement rates of 10 cm per year were routine in this section of wall, but in recent months this has rapidly accelerated, and in the last few days movement rates of 20 cm per day or more have been recorded. The volume of rock that is showing displacement is reported to be up to 10 million m³. The risk is that the collapse and runout of the slope will generate vibrations that trigger the failure of the Barragem Sul Superior (Sul Superior tailings dam) shown at the bottom of the image, allowing a major release of mine waste.
To deal with the threat, Vale and the emergency services have evacuated 400 people, and a further 6,000 people are on notice to move should a release occur. High intensity monitoring of the slope is continuing. A Youtube video that describes the preparatory work being undertaken at the site, which includes modelling of the inundation zone for a major failure:-
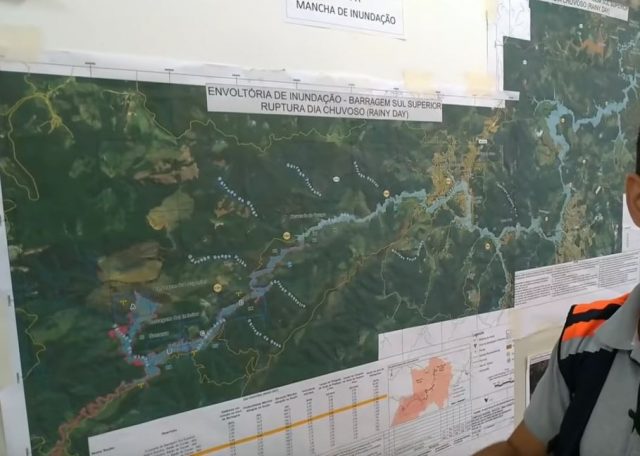
Modelling of the potential inundation one for a tailing dams failure at the Gongo Soco mine in Brail. Still from a Youtube video.
.
On Monday night (27th May), the movement rate reportedly reached 21.8 cm per day. However, predicting the time of failure is notoriously difficult, so it is a waiting game. Ironically, a difficult scenario will arise if the slope does not fail during this movement period, which will leave a potentially dangerous slope intact. Knowing how to manage it in that case will be very challenging.
21 May 2019
Joffre Peak: precursory movements and the role of temperature
Joffre Peak: precursory movements and the role of temperature
There has been some speculation about the trigger of the Joffre Peak landslides, with an abrupt rise in temperatures in the days before the landslides being cited as a potential cause. Reader Pierre Friele has very kindly taken a look at the temperature and snow pack records from three adjacent weather stations, which illustrate the point well. This is the record from the days leading up to the landslide for Cayoosh Summit at 1350 m:-
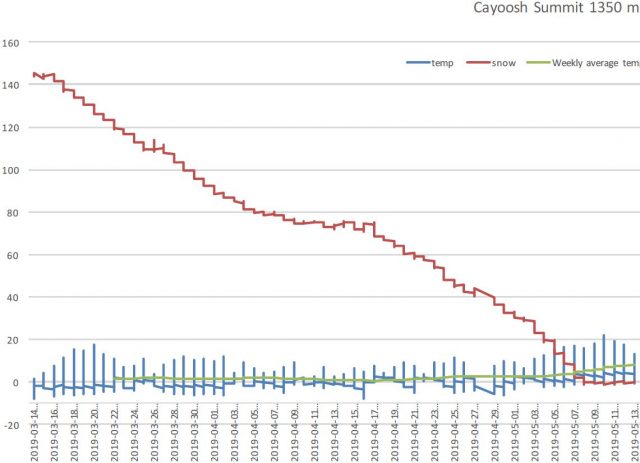
The temperature and snow pack record for Cayoosh Summit in the days leading up to the first Joffre Peak landslide. Data from The Pacific Climate Impacts Consortium. Data graphed by Pierre Friele.
.
Similarly, this is the data from Blowdown at 1890 m:-
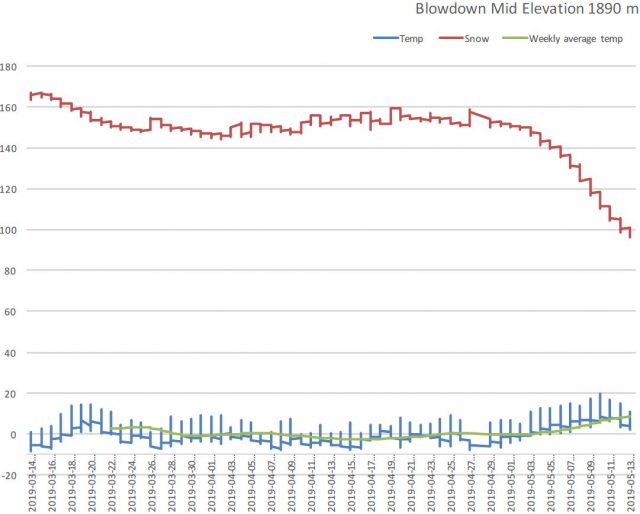
The temperature and snow pack record for Blowdown at 1850 m in the days leading up to the first Joffre Peak landslide. Data from The Pacific Climate Impacts Consortium. Data graphed by Pierre Friele.
.
And this is the data from Blowdown Peak at 2320 m:-
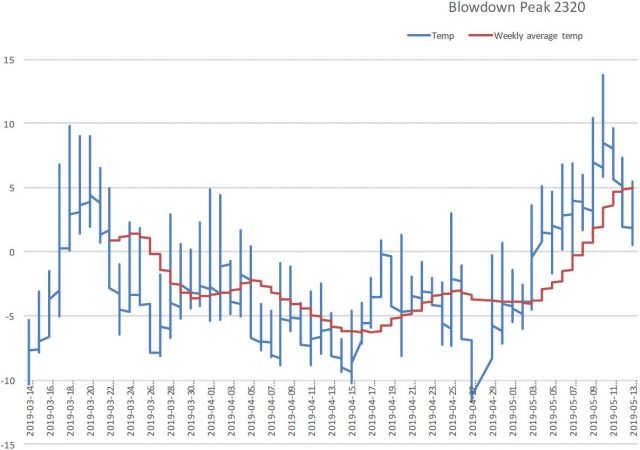
The temperature and snow pack record for Blowdown at 2320 m in the days leading up to the first Joffre Peak landslide. Data from The Pacific Climate Impacts Consortium. Data graphed by Pierre Friele.
In each case the temperature data shows rapid warming in the days leading up to the landslide, and rapid snow melt occurred. It is likely that this was enough to tip the landslide into failure. However, the site will have experienced broadly similar conditions many times before (although global heating is making these events more common of course), suggesting that something was different on this occasion. This is likely to indicate that the slope had been undergoing progressive failure – i.e. the slow development of the detachment surface over a long period of time through processes of rock fracturing and weakening. Pierre Friele has helpfully put together the graphic below, which uses satellite data to show that the rock mass had been spalling debris in the weeks leading up to the collapse. This is likely to be an indication that the block was deforming as the failure developed:-
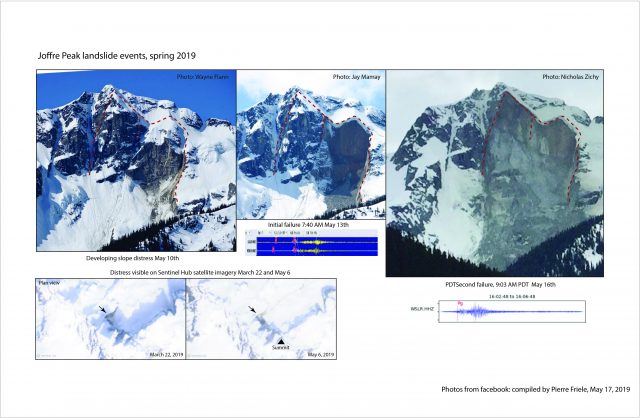
Composite image by Pierre Friele illustrating various aspects of the development of the Joffre Peak landslides.
.
Note that the rock block involved in the first collapse was shedding very large amounts of debris, whilst the second was far less active. This suggests that prior to these events the failure in the second block was much less developed than that of the first. The second collapse event was initiated by the first failure, perhaps because of the loss of lateral support.
Acknowledgement
Thanks to Pierre Friele for his amazing images for this post. I very much appreciate his hard work.
 Dave Petley is the Vice-Chancellor of the University of Hull in the United Kingdom. His blog provides commentary and analysis of landslide events occurring worldwide, including the landslides themselves, latest research, and conferences and meetings.
Recent Comments