
26 April 2018
Landslides and monsoon variation in India
Posted by Dave Petley
Landslides and monsoon variation in India
As I have noted previously, the global landslide hotspot lies in South Asia, driven by rainfall associated with the annual summer monsoon. The patterns of the monsoon are complex, driven by the very dynamic climate system combined with the extreme topography and its resultant orographic effects. In a paper just published in Atmospheric Science Letters, and available Open Access, Mahmood et al. (2018) present a new long-term regional reanalysis of the Indian monsoon, covering the period from 1979 to 2016. The aims of the project are described as follows:
The prediction of the monsoon is notoriously difficult and there are many aspects of monsoon processes from the onset through the development and decay that are relatively poorly understood and represented in model simulations…The IMDAA reanalysis will produce a long‐term historical record of climate and extreme weather events over a region spanning the Indian peninsula and surrounding areas in the form of a high‐resolution data set, which can be exploited to better understand the characteristics of the monsoon.
At the time of writing of the paper, the reanalysis of monsoon variation was still underway, but it contains the data for 2008 and 2009. The graphs below show the average daily rainfall for India for the summer monsoon months (June, July, August, September; abbrieviated as JJAS) for four different datasets. The one generated by Mahmood et al. (2018) is labelled IMDAA:-
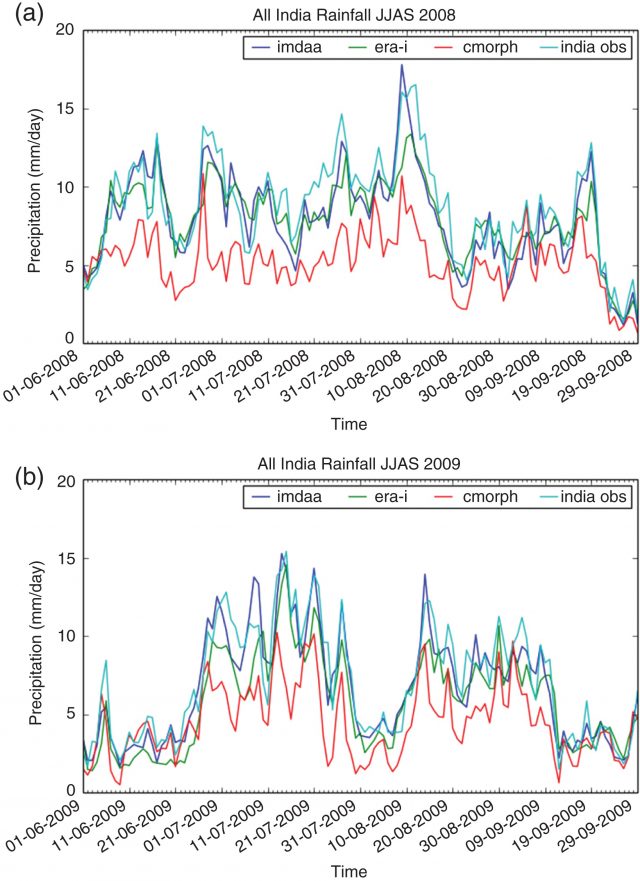
Daily monsoon variation in terms of precipitation for JJAS for 2008 and 2009, from Mahmood et al. 2018.
.
What is noticeable here is the quite different patterns of monsoon variation across the two years. In 2008 the monsoon starts quite early and peaks in mid-August. There is a second peak right at the end of the monsoon period. In comparison 2009 starts much more slowly, and there is a comparatively dry period in the first half of August, followed by a distinct wet phase. The main monsoon period ends in mid-September.
I have compared with this with the record of fatal landslides from my database for these two years. For this analysis I have used India and Nepal as in terrain terms they are effectively in the same domain. The graph below shows the cumulative number of fatal landslides for Nepal and India combined for 2008 and 2009:
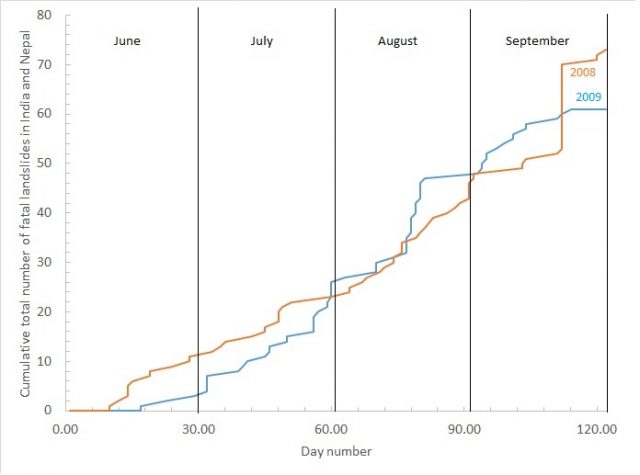
The cumulative number of landslides in India and Nepal in 2008 and 2009.
.
Interestingly, the slow start to the monsoon in 2009 is clearly evident in the landslide data, as is the wet phase in the middle of August. The much more consistent rainfall through the first half of the monsoon in 2008 is also clear in the landslide data, as is the late season rainfall pulse.
Whilst this is no more than a superficial analysis, I think that it does demonstrate the fascinating potential provided by this new reanalysis of the summer monsoon, and the potential to link it landslide patterns.
Reference
Mahmood S, Davie J, Jermey P, et al. 2018 Indian monsoon data assimilation and analysis regional reanalysis: Configuration and performance. Atmospheric Science Letters 19:e808. https://doi.org/10.1002/asl.808
 Dave Petley is the Vice-Chancellor of the University of Hull in the United Kingdom. His blog provides commentary and analysis of landslide events occurring worldwide, including the landslides themselves, latest research, and conferences and meetings.