
6 November 2017
The Nuugaatsiaq landslide in Greenland: understanding the failure processes
Posted by Dave Petley
The Nuugaatsiaq landslide in Greenland: understanding the failure processes
An interesting paper has just been published in the journal Geophysical Research Letters (Poli 2017) that examines the seismic record leading up to the failure of the Nuugaatsiaq landslide in Greenland in June. This is the event that triggered a significant local tsunami that killed four people. The landslide was located close a set of seismic stations that meant that good data were collected leading up to the failure; as I noted previously, a series of small seismic events prior to the main collapse had been observed in the record by Jackie Caplan-Auerbach; this new paper seeks to analyse and interpret them.
For me the most interesting aspect of this paper is that the event rate (i.e. the number of mini-earthquakes) increases with time leading up to the final failure event. Poli (2017) provides this illustration of this effect (there are other data in the original that I have removed for clarity):
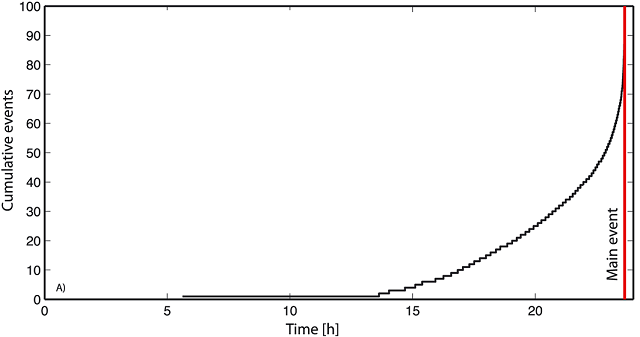
Increasing seismic event rate for the Nuugaatsiaq landslide, after Poli (2017).
.
In the paper, the author describes this increasing event rate as being exponential, but in fact this is not correct. The actual function in hyperbolic; the distinction is important. Work that I did with Chris Kilburn some years ago (Kilburn and Petley 2003) and then re-examined using field and lab data (e.g. Petley et a. 2005) showed that hyperbolic increases in event rate are associated with brittle processes, representing the first time failure of the landslide in brittle materials, driven by the growth of the shear surface as a fracture. In this interpretation, the seismic events represent the failure of the rock bridges as the fracture grows. The failure of each successive rock bridge increases the stress on the remaining intact rock bridges, which in turn drives this increasing event rate.
Non-brittle processes also show an increasing event rate, but in this case the characteristic function is exponential.
A fascinating aspect of this is that, in cases in which this processes is operating, it is possible to predict the time of final failure from the event rate data. This is the so-called Saito effect. The trick is to plot 1/event rate or 1/velocity (depending on which data are available – Saito used velocity). In a hyperbolic acceleration to failure this plots as a straight line. I have extracted the data from the Poli (2017) paper, and plotted this graph:
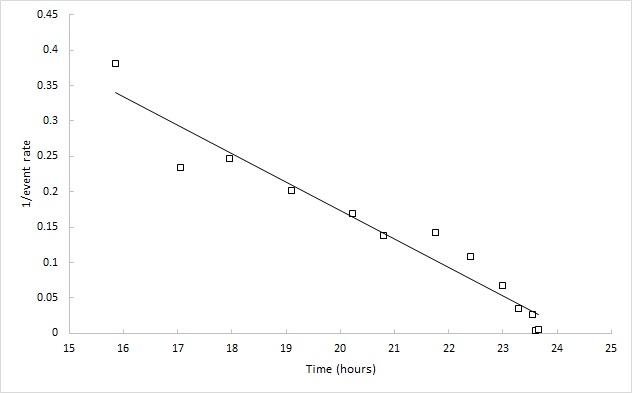
The “Saito effect” graph for the Nuugaatsiaq landslide. Data from Poli (2017)
.
The time of failure can be predicted as the point at which the trend reached 1/event rate = 0 (i.e. a hypothetical infinitely high event rate). This is characteristic of first time failures; we do not see this effect in reactivations of landslides.
The analysis of the seismic signals from the landslide by Poli (2017) is fascinating, but needs to be seen in the context of the understanding of the mechanics of first time failures in slopes rather than in the behaviour of earthquake faults (which are usually ruptures on an existing failure planes).
References
Kilburn, C.J. and Petley, D.N. 2003. Forecasting giant, catastrophic slope collapse: lessons from Vajont, Northern Italy. Geomorphology 54, 1-2, 21-32.
 Dave Petley is the Vice-Chancellor of the University of Hull in the United Kingdom. His blog provides commentary and analysis of landslide events occurring worldwide, including the landslides themselves, latest research, and conferences and meetings.
That’s a wonderfully scary failure cascade !
Thank you.