
21 May 2019
Joffre Peak: precursory movements and the role of temperature
Posted by Dave Petley
Joffre Peak: precursory movements and the role of temperature
There has been some speculation about the trigger of the Joffre Peak landslides, with an abrupt rise in temperatures in the days before the landslides being cited as a potential cause. Reader Pierre Friele has very kindly taken a look at the temperature and snow pack records from three adjacent weather stations, which illustrate the point well. This is the record from the days leading up to the landslide for Cayoosh Summit at 1350 m:-
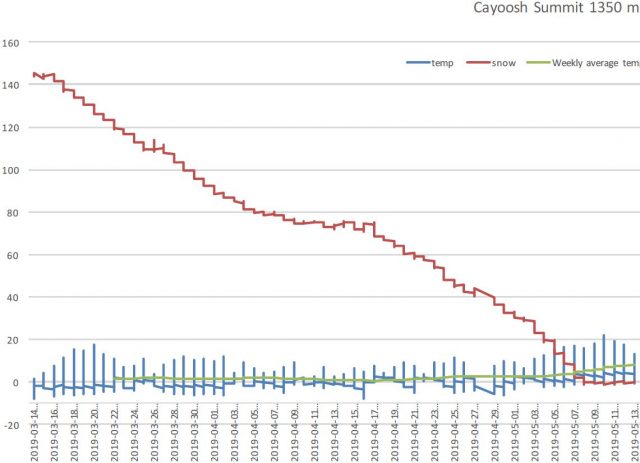
The temperature and snow pack record for Cayoosh Summit in the days leading up to the first Joffre Peak landslide. Data from The Pacific Climate Impacts Consortium. Data graphed by Pierre Friele.
.
Similarly, this is the data from Blowdown at 1890 m:-
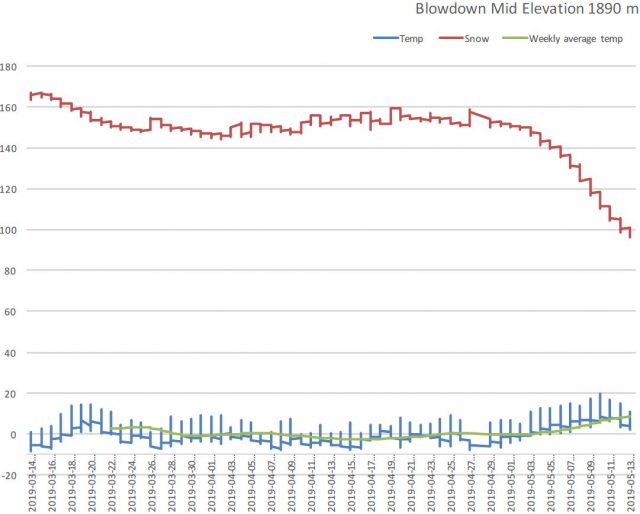
The temperature and snow pack record for Blowdown at 1850 m in the days leading up to the first Joffre Peak landslide. Data from The Pacific Climate Impacts Consortium. Data graphed by Pierre Friele.
.
And this is the data from Blowdown Peak at 2320 m:-
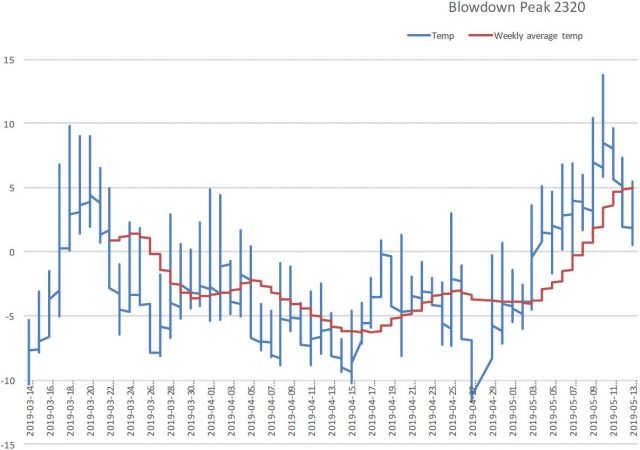
The temperature and snow pack record for Blowdown at 2320 m in the days leading up to the first Joffre Peak landslide. Data from The Pacific Climate Impacts Consortium. Data graphed by Pierre Friele.
In each case the temperature data shows rapid warming in the days leading up to the landslide, and rapid snow melt occurred. It is likely that this was enough to tip the landslide into failure. However, the site will have experienced broadly similar conditions many times before (although global heating is making these events more common of course), suggesting that something was different on this occasion. This is likely to indicate that the slope had been undergoing progressive failure – i.e. the slow development of the detachment surface over a long period of time through processes of rock fracturing and weakening. Pierre Friele has helpfully put together the graphic below, which uses satellite data to show that the rock mass had been spalling debris in the weeks leading up to the collapse. This is likely to be an indication that the block was deforming as the failure developed:-
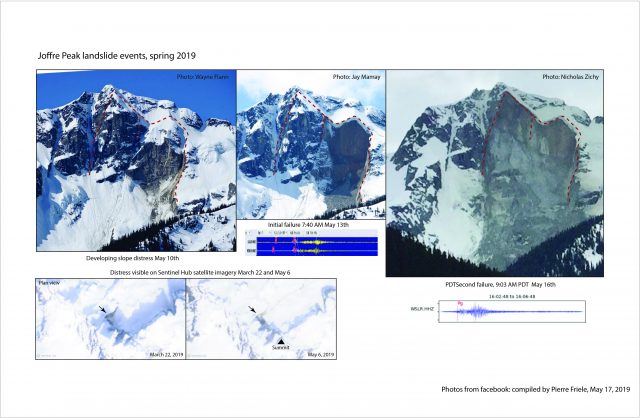
Composite image by Pierre Friele illustrating various aspects of the development of the Joffre Peak landslides.
.
Note that the rock block involved in the first collapse was shedding very large amounts of debris, whilst the second was far less active. This suggests that prior to these events the failure in the second block was much less developed than that of the first. The second collapse event was initiated by the first failure, perhaps because of the loss of lateral support.
Acknowledgement
Thanks to Pierre Friele for his amazing images for this post. I very much appreciate his hard work.
 Dave Petley is the Vice-Chancellor of the University of Hull in the United Kingdom. His blog provides commentary and analysis of landslide events occurring worldwide, including the landslides themselves, latest research, and conferences and meetings.
Is there a higher-resolution version of the final, composite image? In its present form it is not legible.
Hi Dave,
Please chk my article on Shishpar glacier supra-glacial surge.
https://twitter.com/rajfortyseven/status/1130736246089691137
Regards