
19 February 2021
Trends in landslides and landslide losses in Nepal over three decades
Trends in landslides and landslide losses in Nepal over three decades
I have written frequently about landslide losses in Nepal, both on this blog and in papers. I started to work on landslide problems there 20 years ago. Subsequently, many others have picked up the baton, such that there is a host of good work being undertaken there at present. A really interesting paper has just been published in the journal Landslides, Muñoz-Torrero Manchado et al. (2021), which is open access, which looks at landslide losses there over three decades. Based on an area in western Nepal, this is significant for two reasons. First, it uses the rapid development in our ability to use time series imagery to extract landslide scars from the landscape, which provides new opportunities to understand temporal and spatial patterns of landslide occurrence. Second, it casts light in an unprecedented manner on landslide patterns themselves with time and in space.
Muñoz-Torrero Manchado et al. (2021) have extracted annual landslide maps for their study area between 1992 and 2018, mapping 8,778 landslide events during the study period (and many more that preceded the start of the study). They have then been able to link these annual events to the weather and other conditions in the study area.
Not surprisingly, the strongest correlation that they found was between total monsoon precipitation and the number of landslides – in wet years there were more slides. Interestingly, this effect was amplified when a year with high rainfall monsoon came after a year in which the monsoon that was warm and dry.
In many ways the most interesting aspect of this study is explained in this diagram from the paper:-
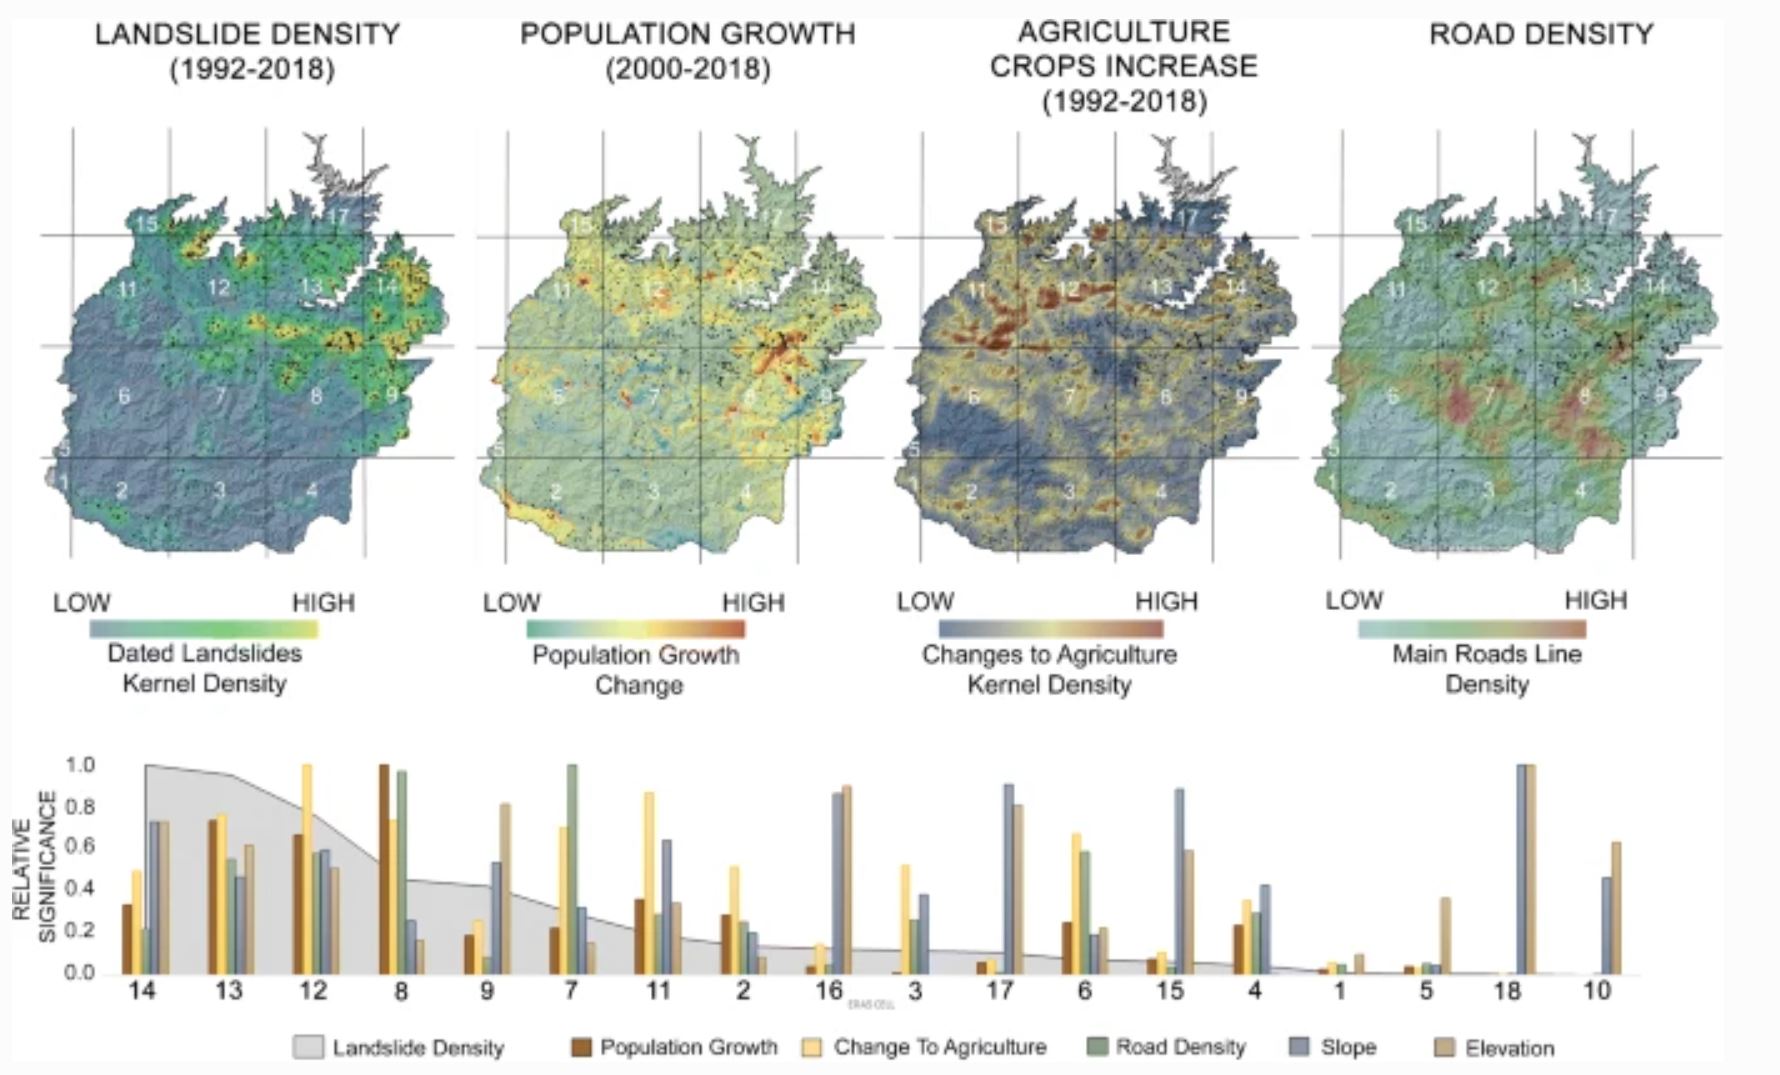
Patterns of landslides over three decades in western Nepal. Figure from Muñoz-Torrero Manchado et al. (2021).
.
The four panels at the top show maps of the study area. The black dots are the landslides. The heat maps show variability in key parameters as per the labels. The graph below divides the study area in a set of smaller zones. The grey shading shows the landslide density, and the bars show the influence of various factors. In those areas with the highest landslide density there has been population growth, and associated changes to agriculture, and increases in the road density.
Thus, Muñoz-Torrero Manchado et al. (2021) conclude that the annual pattern of landslides is being heavily driven by the patterns of the monsoon in this area, but it is also strongly affected by human factors such as poor slope management and road construction.
The paper ends with a very clear message about the need for community-led landslide management:
[T]he increase in reported landslide fatalities in western Nepal relates primarily to the notable demographic expansion in this area, placing more people and assets in harm’s way. Hence, there would appear to be significant potential and need for community-focused disaster risk management strategies to reduce local exposure levels and minimize landslide losses.
I agree completely.
Reference
Muñoz-Torrero Manchado, A., Allen, S., Ballesteros-Cánovas, J.A. et al. 2021. Three decades of landslide activity in western Nepal: new insights into trends and climate drivers. Landslides (2021). https://doi.org/10.1007/s10346-021-01632-6
18 February 2021
A GIS-based map of the Chunchi landslide in Ecuador
A GIS-based map of the Chunchi landslide in Ecuador
On Twitter, Angel Valdiviezo of the Scuela Superior Politécnica Nacional (ESPOL) has highlighted a GIS based system that has been set up to compile information about the Chunchi landslide in Ecuador. Included in the data in this system is an aerial image of the landslide site, which starts to provide insight into the situation. The portal is attributed to attributed to the Servicio Nacional de Gestión de Riesgos y Emergencias / Instituto Geográfico Militar, who should be commended for getting this information online. This is the aerial image:-
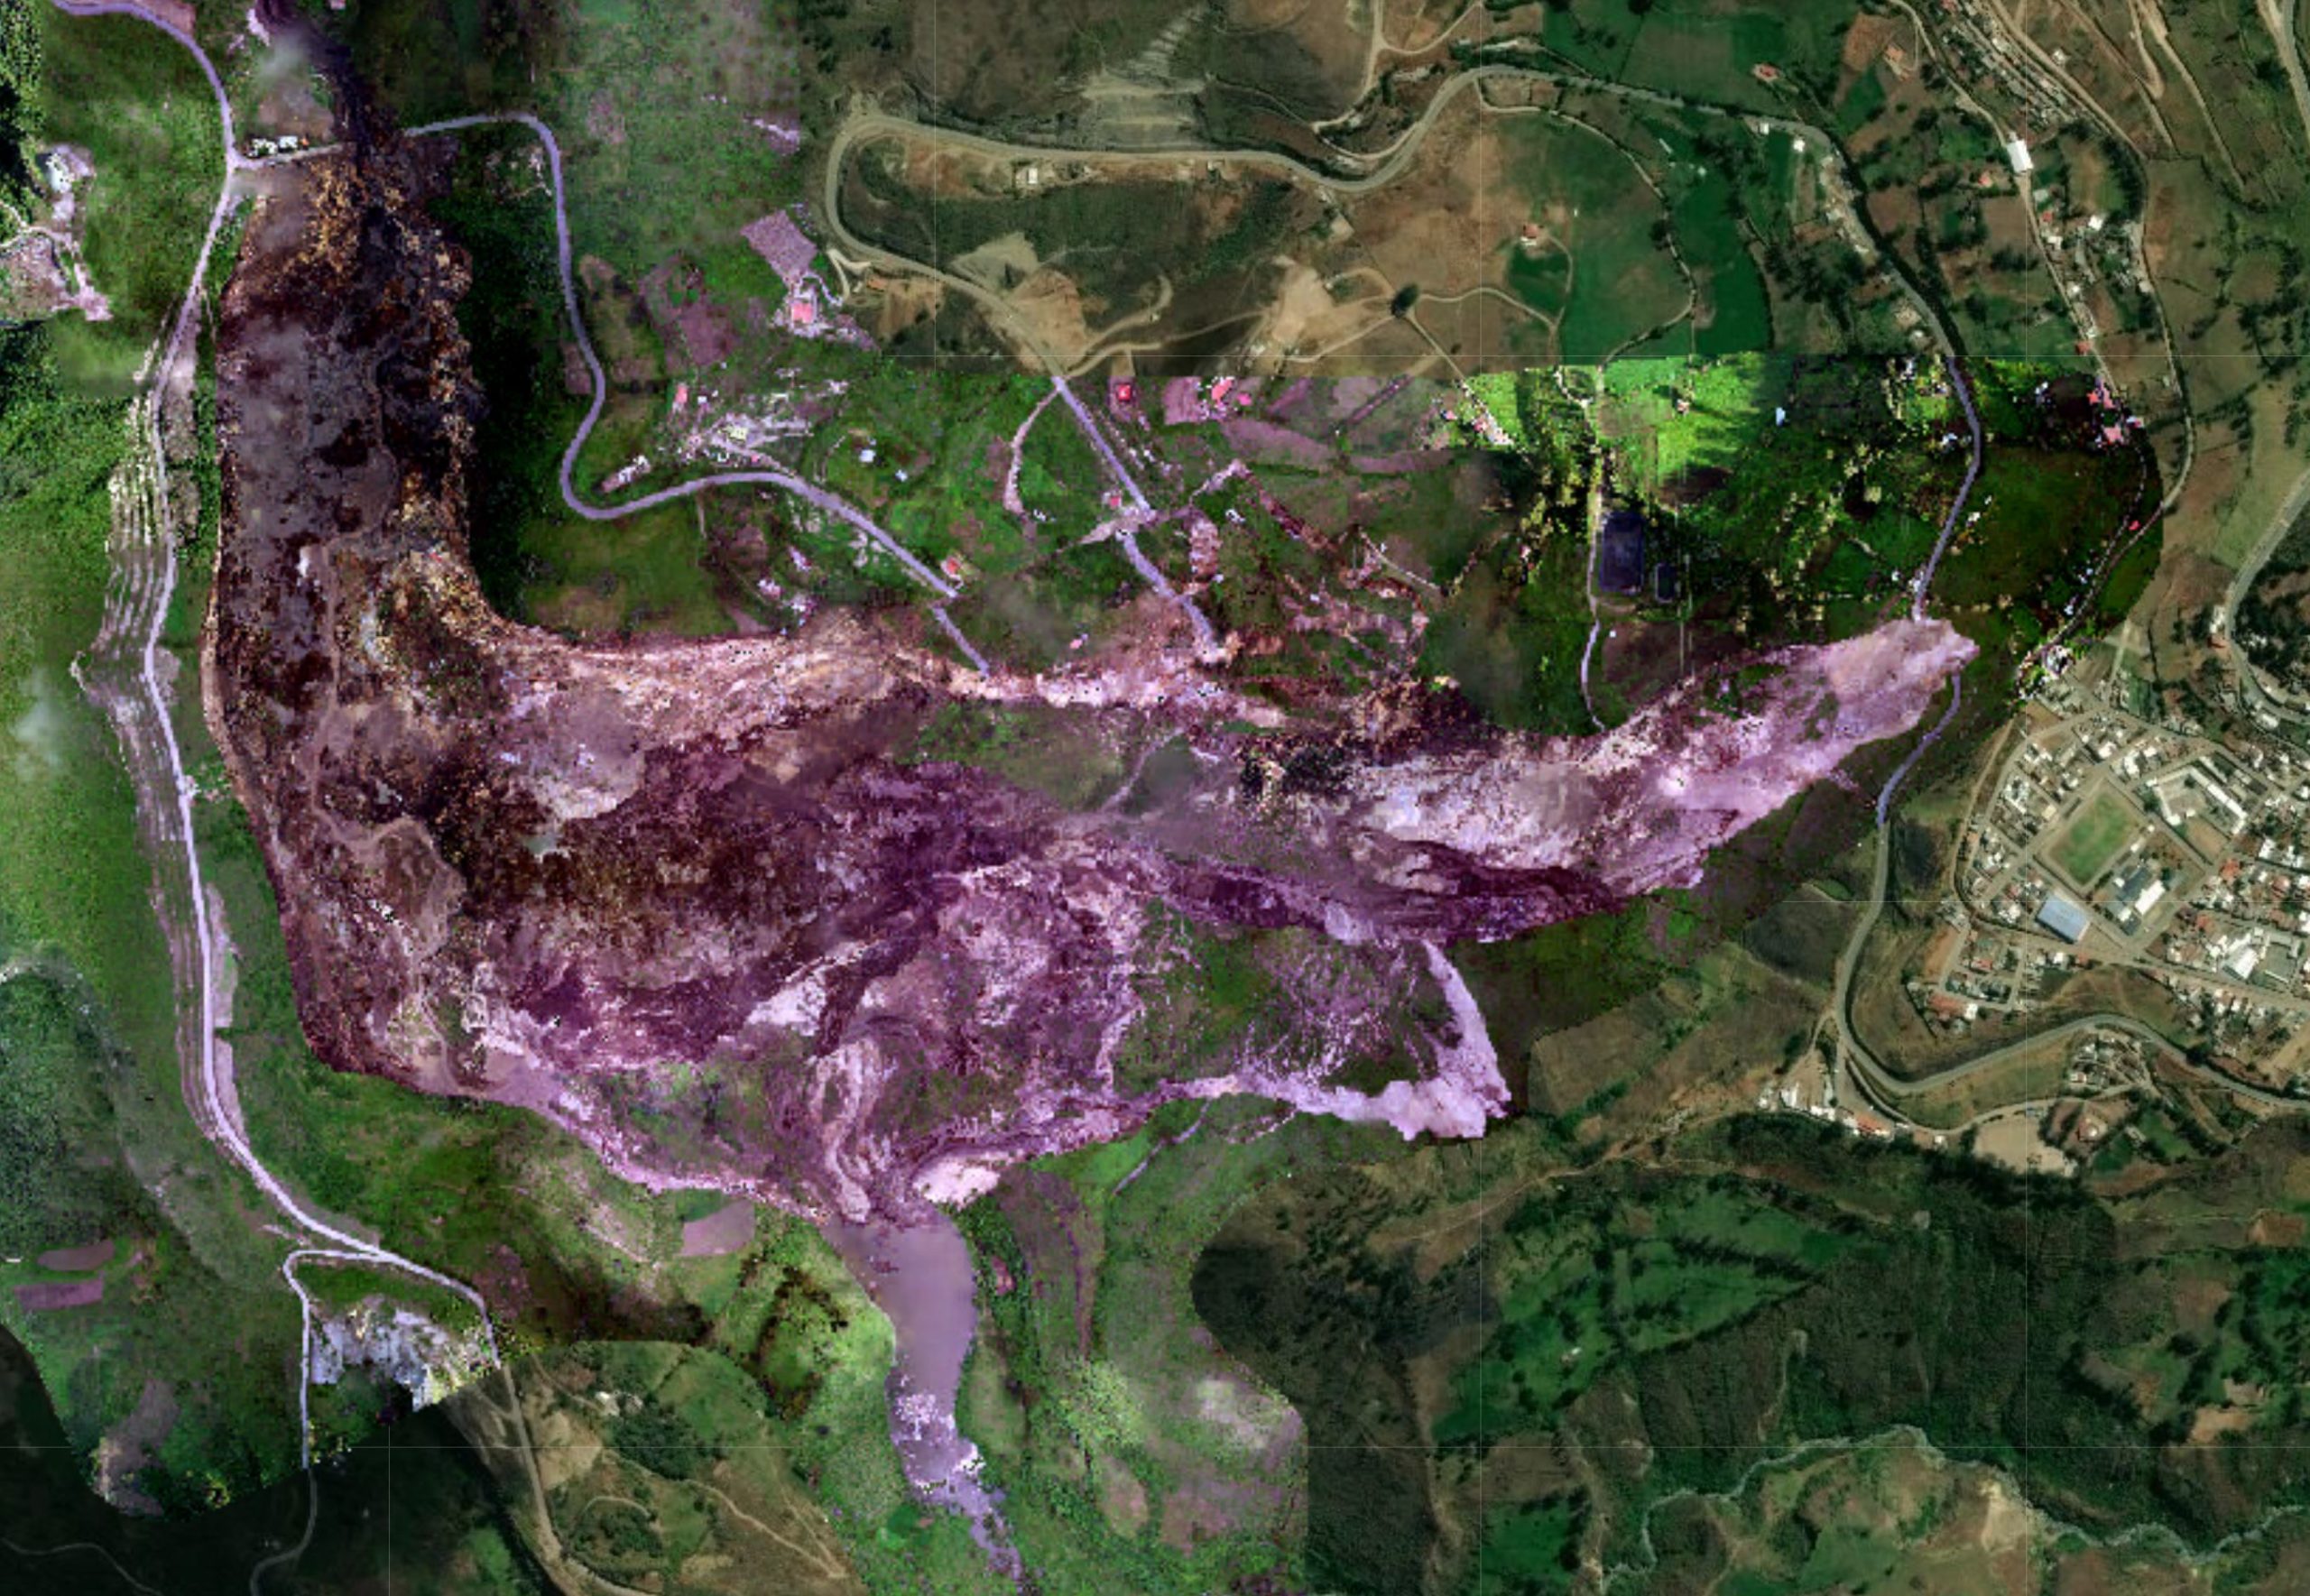
A vertical aerial photograph of the Chunchi landslide. Image uploaded to an online GIS portal attributed to the Servicio Nacional de Gestión de Riesgos y Emergencias / Instituto Geográfico Militar.
.
I thought it would be helpful to label the major features on first inspection. I would welcome comments:-
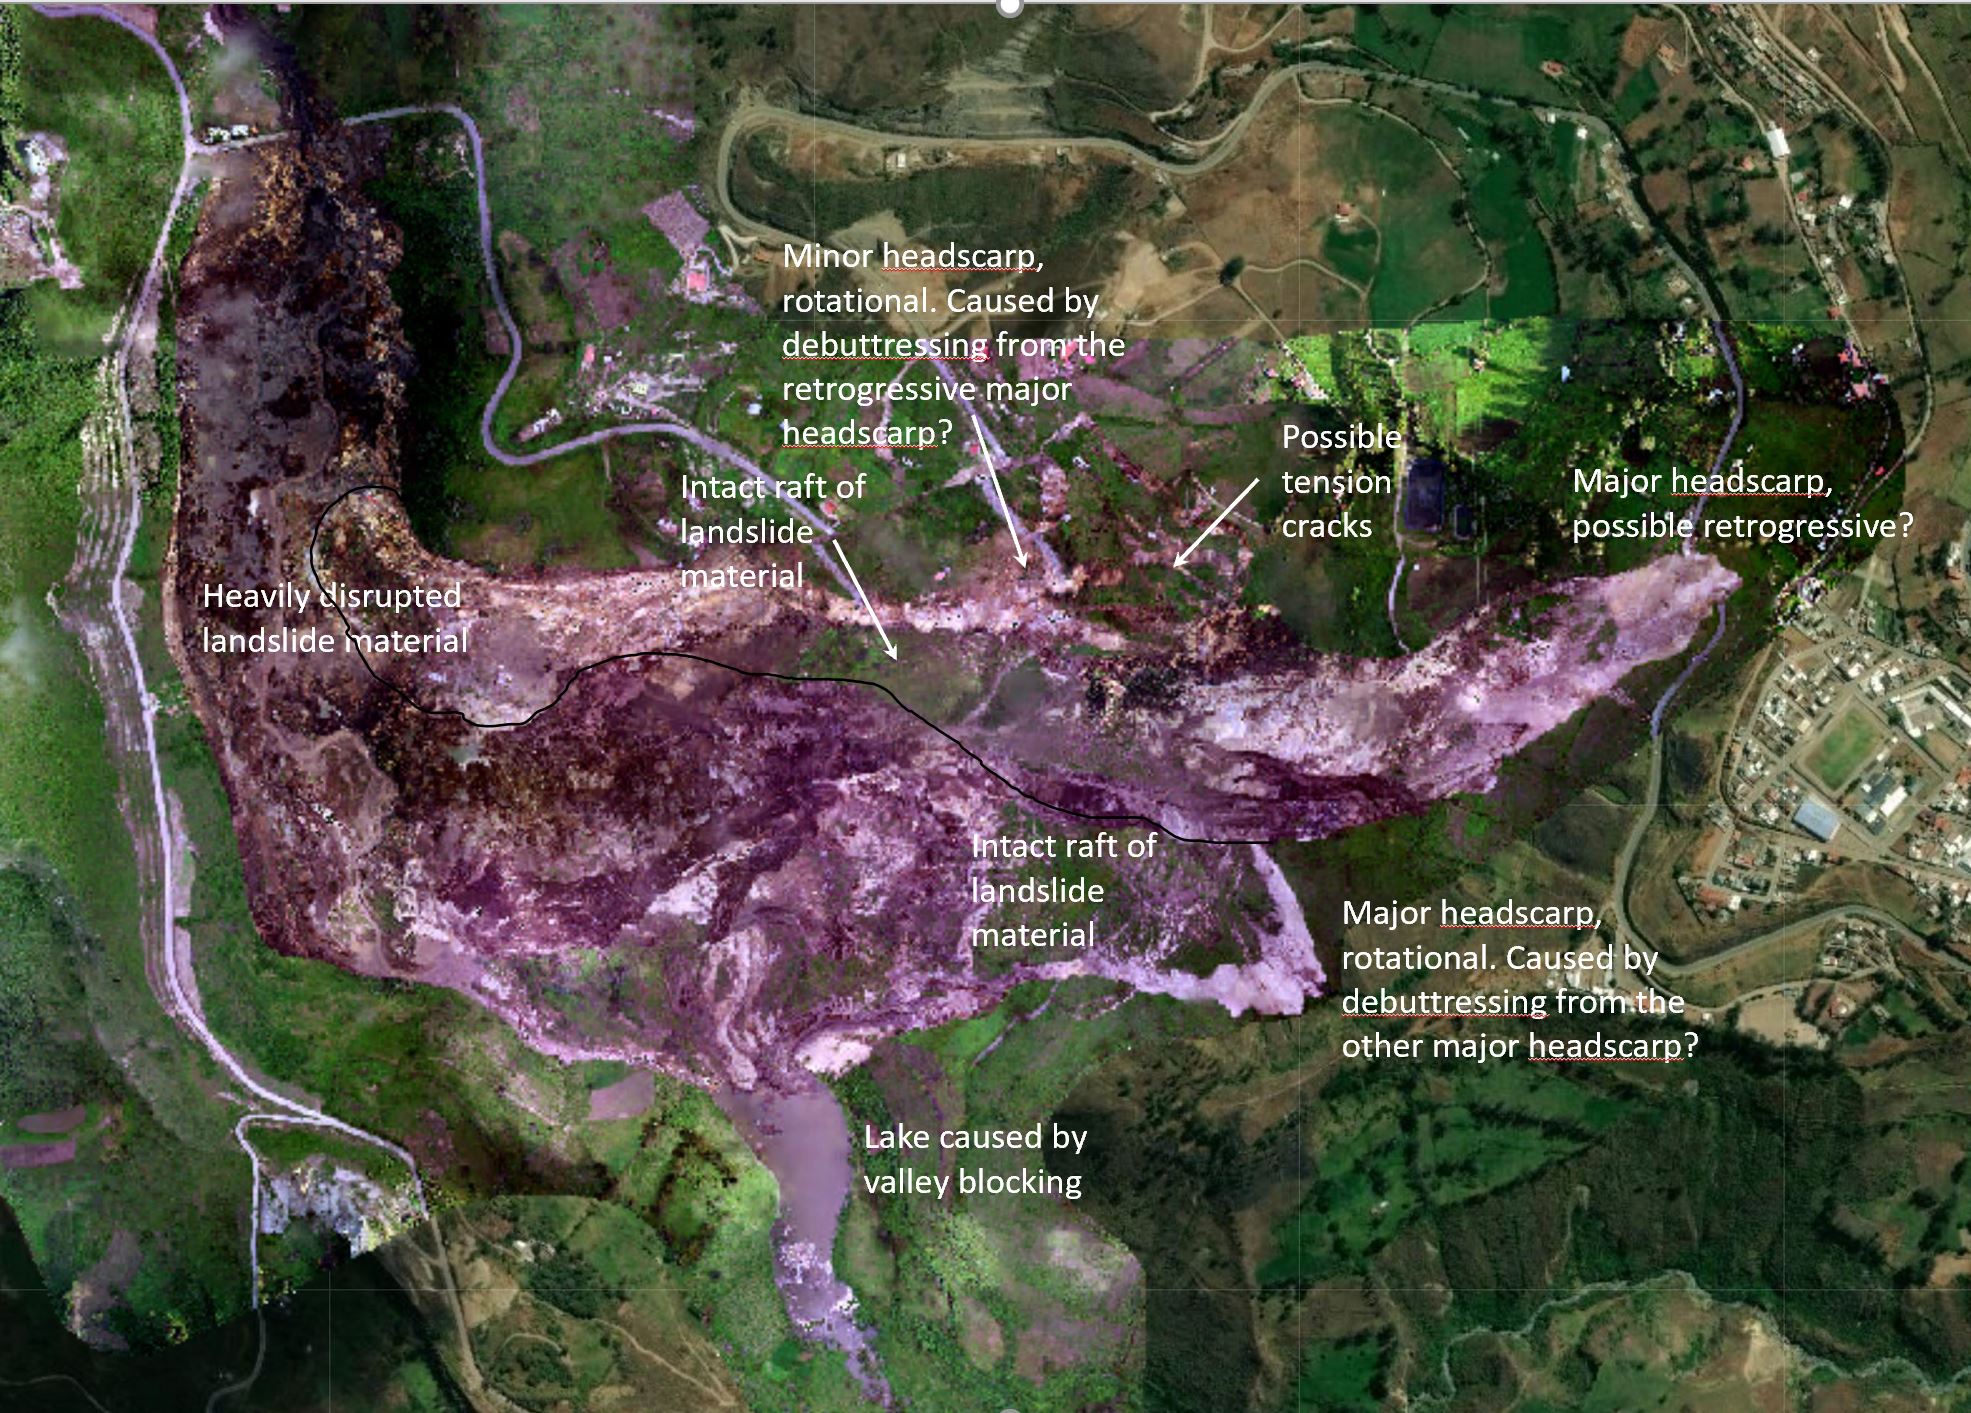
Annotated vertical aerial photograph of the Chunchi landslide. Image uploaded to an online GIS portal attributed to the Servicio Nacional de Gestión de Riesgos y Emergencias / Instituto Geográfico Militar.
.
There are two major headscarps in this landslide, which has a reported volume of about 30 million cubic metres. The one to the east appears to be retrogressive, the one to the southeast is rotational. Downslope from both there are large rafts of essentially intact land. There is a minor scarp to the north, and an areas of what appears to be very large tension cracks. I have drawn in an approximate boundary between the two flows from the major scarps. Downslope the landslide material us very heavily disrupted, which is consistent with the videos.
To the south there is small lake caused by the blockage of the valley.
The most likely mechanism is that one of the two major failure areas developed, driving the static liquefaction in the lower part of the slope. This then debutressed (unloaded the toe) of the other major failure. My hunch would be that it was the retrogressive failure that developed first, but it could be the other way around.
A third hypothesis is that a smaller failure developed lower on the slope, triggering a chain reaction upslope as the materials weakened.
This could only be resolved with fieldwork and eyewitness accounts. Sadly, Covid-19 is likely to hamper this work, but hopefully a locally-based team will be able to study it in detail. This is a landslide that justifies a detailed publication.
16 February 2021
The very large Chunchi landslide in Ecuador
The very large Chunchi landslide in Ecuador
Last week a very large landslide occurred near to the town of Chunchi in Ecuador. The scale of the landslide makes this a somewhat unusual event. It was captured on a couple of videos that were posted to Twitter:-
Increíble deslizamiento de gran magnitud en Chunchi, sector la Armenia, Ecuador. A su paso la enorme masa inestable destruye viviendas, tramos de carretera y obstruye el cauce del río. #Landslide #earthflow @davepetley #procesosmorfodinámicos #GestiónDelRiesgoDeDesastres pic.twitter.com/MlI6waa8H9
— Geotweets (@Yobanygf) February 13, 2021
#Chimborazo #Chunchi#Urgente
En el cantón Chunchi se registró un Fuerte deslizamiento de tierra en el sector la Armenia que sepultó a la comunidad de ChanChan .. pic.twitter.com/v2jEBg98t6— ECO DIGITAL (@EcoDigital45) February 12, 2021
.
The landslide occurred on 12 February 2021. It is not clear to me at the moment as to the trigger of this enormous landslide, news reports link it to the presence of a fault and to groundwater. The landslide has caused the evacuation of 80 families, and over 500 people, but fortunately did not cause loss of life. Given the very dramatic movements in the video, that is very fortunate.
The scale of the landslide is such that getting a decent image of it is challenging with a drone or satellite imagery. The best picture I have seen is this one:-
The Chunchi landslide in Ecuador. Image by Riesgos via Primicias.
.
The upper part of the landslide appears to be a very large rotational failure, which can be seen in the middle right side of the image above. There are some hints that there may be a second source as well, located to the left of the main source – this is on the left side of the image. The main slide appears to have undercut the valley side, causing another substantial area of failure, on the right side of the image (this is the most obvious failure visible).
The failed debris appears to have transformed into a flow with quite high levels of mobility in places, judging by the videos. The consequence is a substantial area of inundated valley.
The biggest threat now appears to be blockage of the channel of the Picay River. Reports indicate that a lake is developing on the upstream side. Efforts are under way to create a channel to avoid an uncontrolled breach.
Many thanks to those people who pointed this one out to me – much appreciated.
15 February 2021
New perspectives on the Chamoli debris flow disaster
New perspectives on the Chamoli debris flow disaster
The grim search for the victims of the Chamoli debris flow disaster in Uttarakhand in India is continuing, with much of the effort being focused on the tunnels associated with the Tapovan Vishnugad hydroelectric scheme. As of this morning (15 February 2021), 54 people are known to have lost their lives and 179 people are reported to be missing. The Tapovan tunnel operation is extremely challenging as it is filled with sediment, including large boulders.
The Planet Labs high resolution images are incredible – it is almost impossible to do them justice. I have imported them into Google Earth and draped them onto the landscape, which helps to provide a perspective on the events. The image below shows the slope that failed, taken a few days before the landslide:
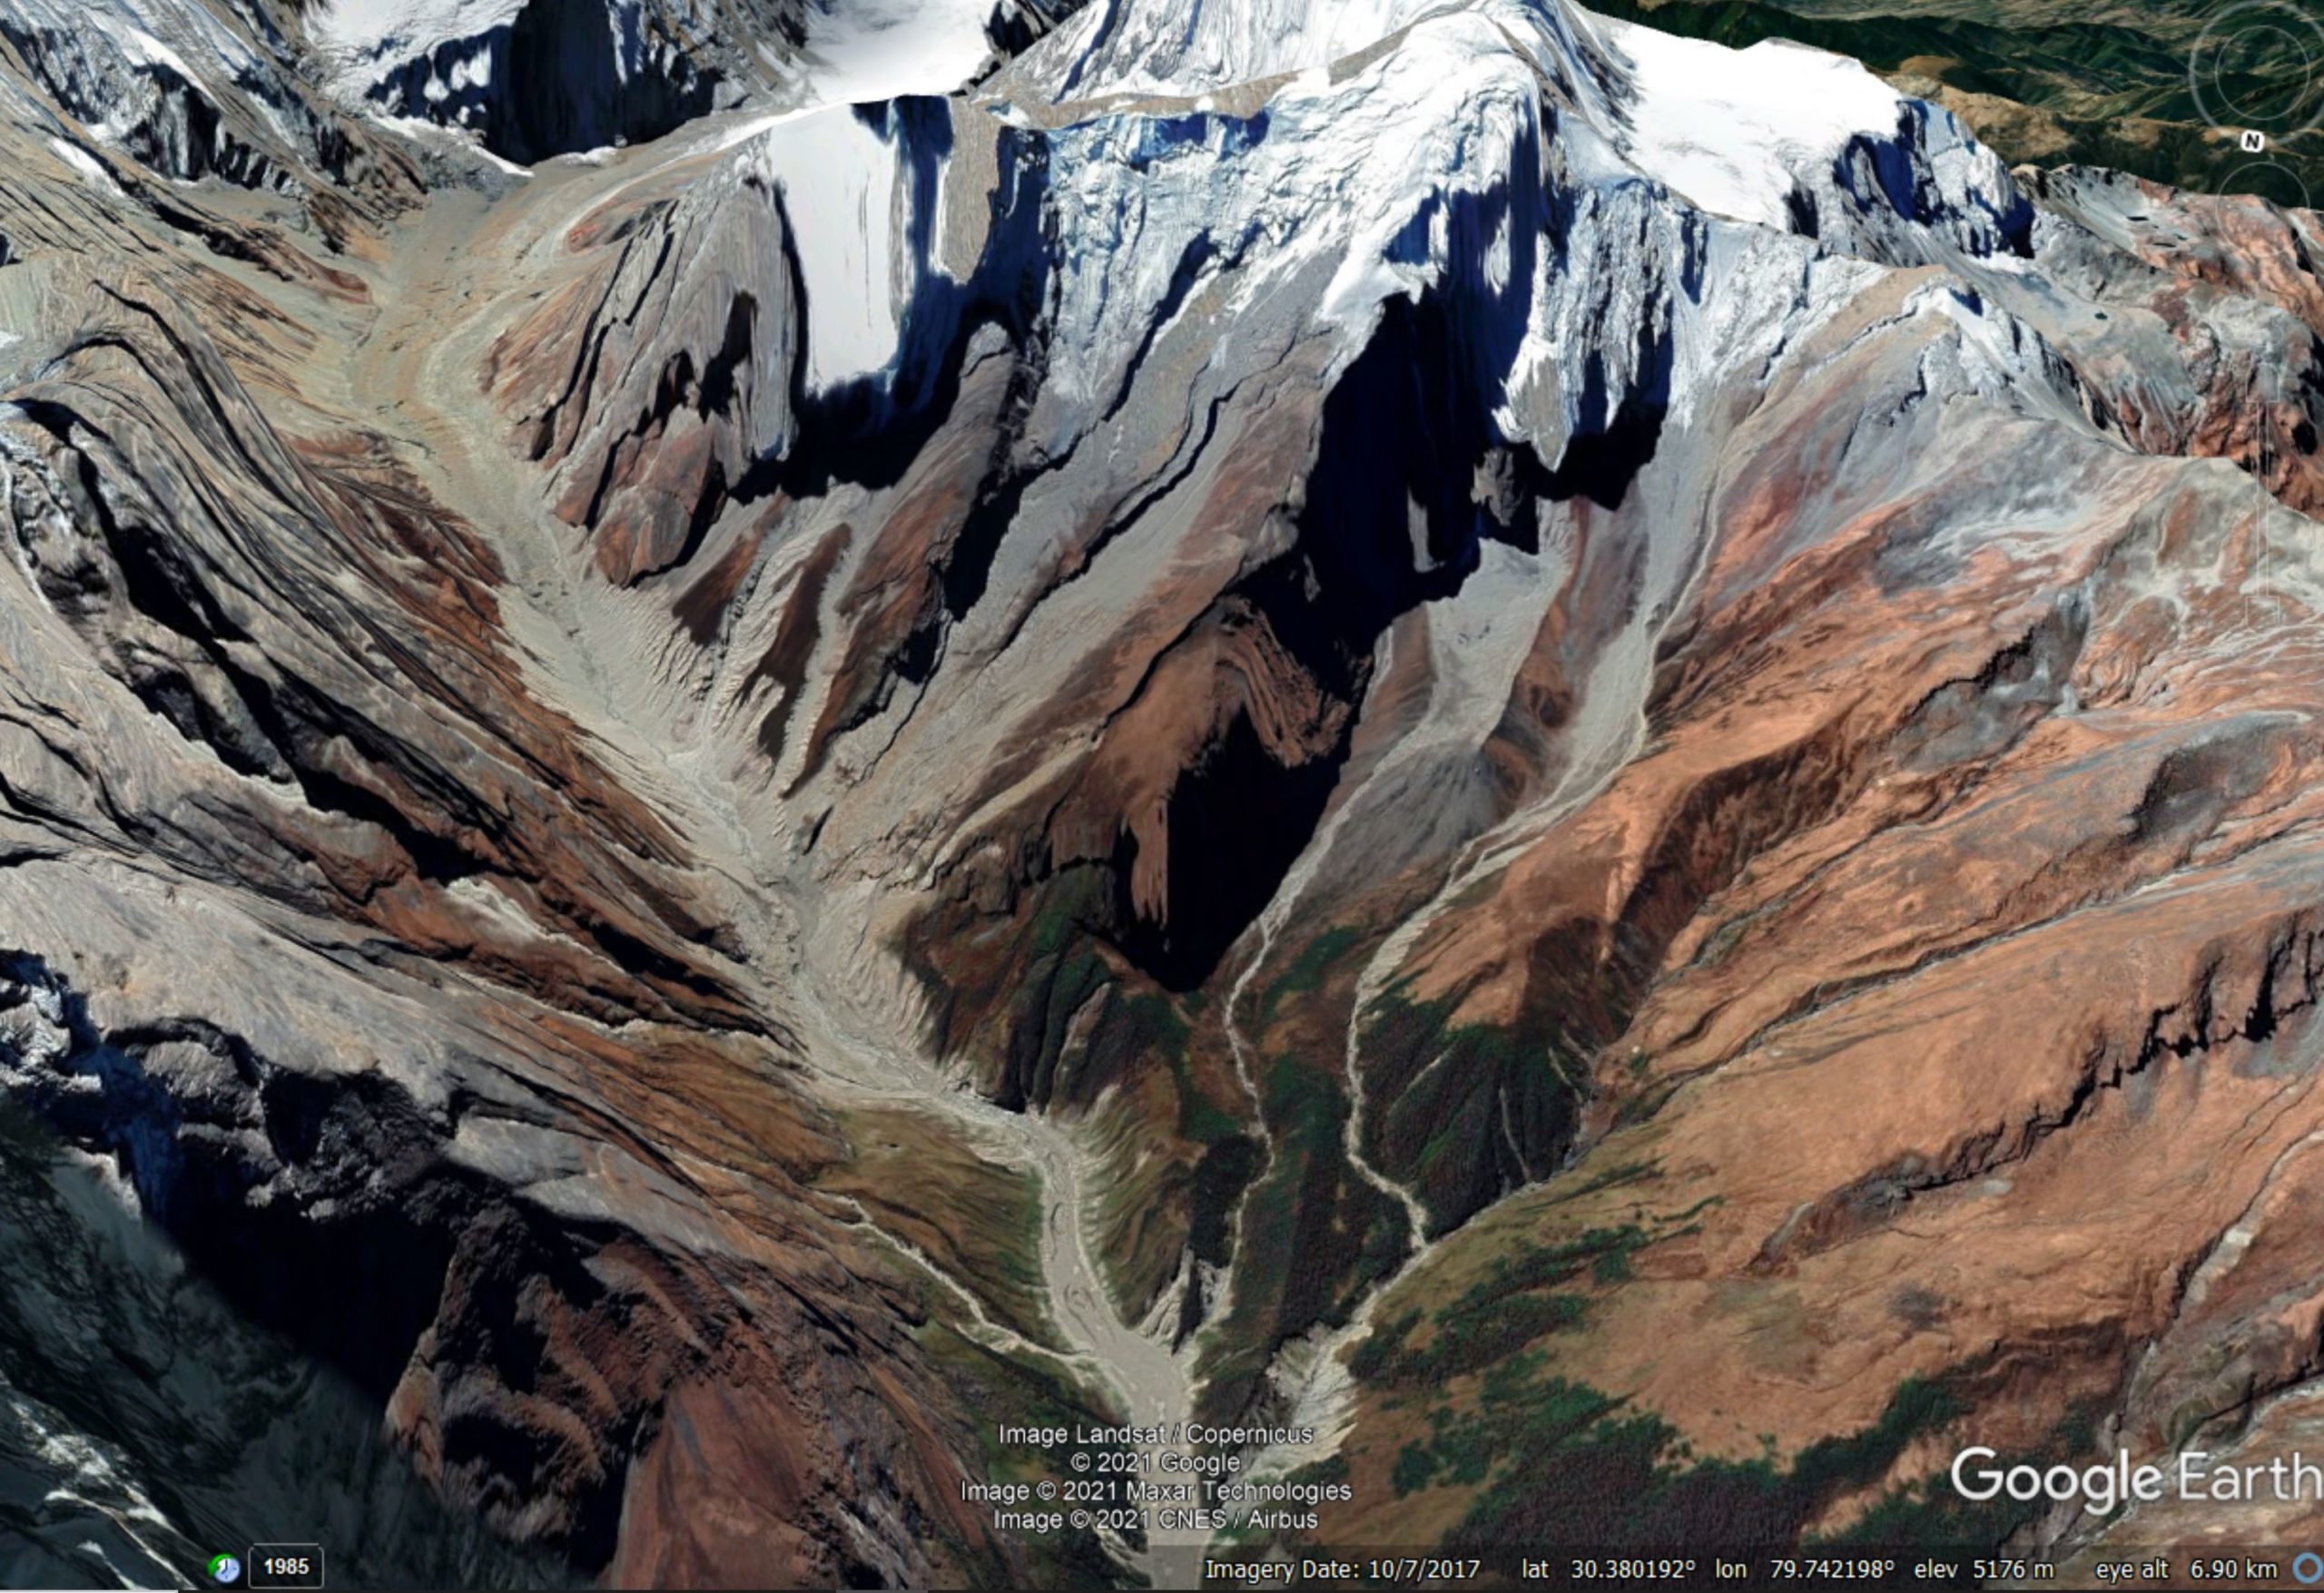
Google Earth perspective view of the slope that failed in the Chamoli landslide
.
The terrain was steep and barren, with some woodland in the lower parts of the valley. The image below shows the same view, but with the Planet Labs SkySat image draped onto the topography:-
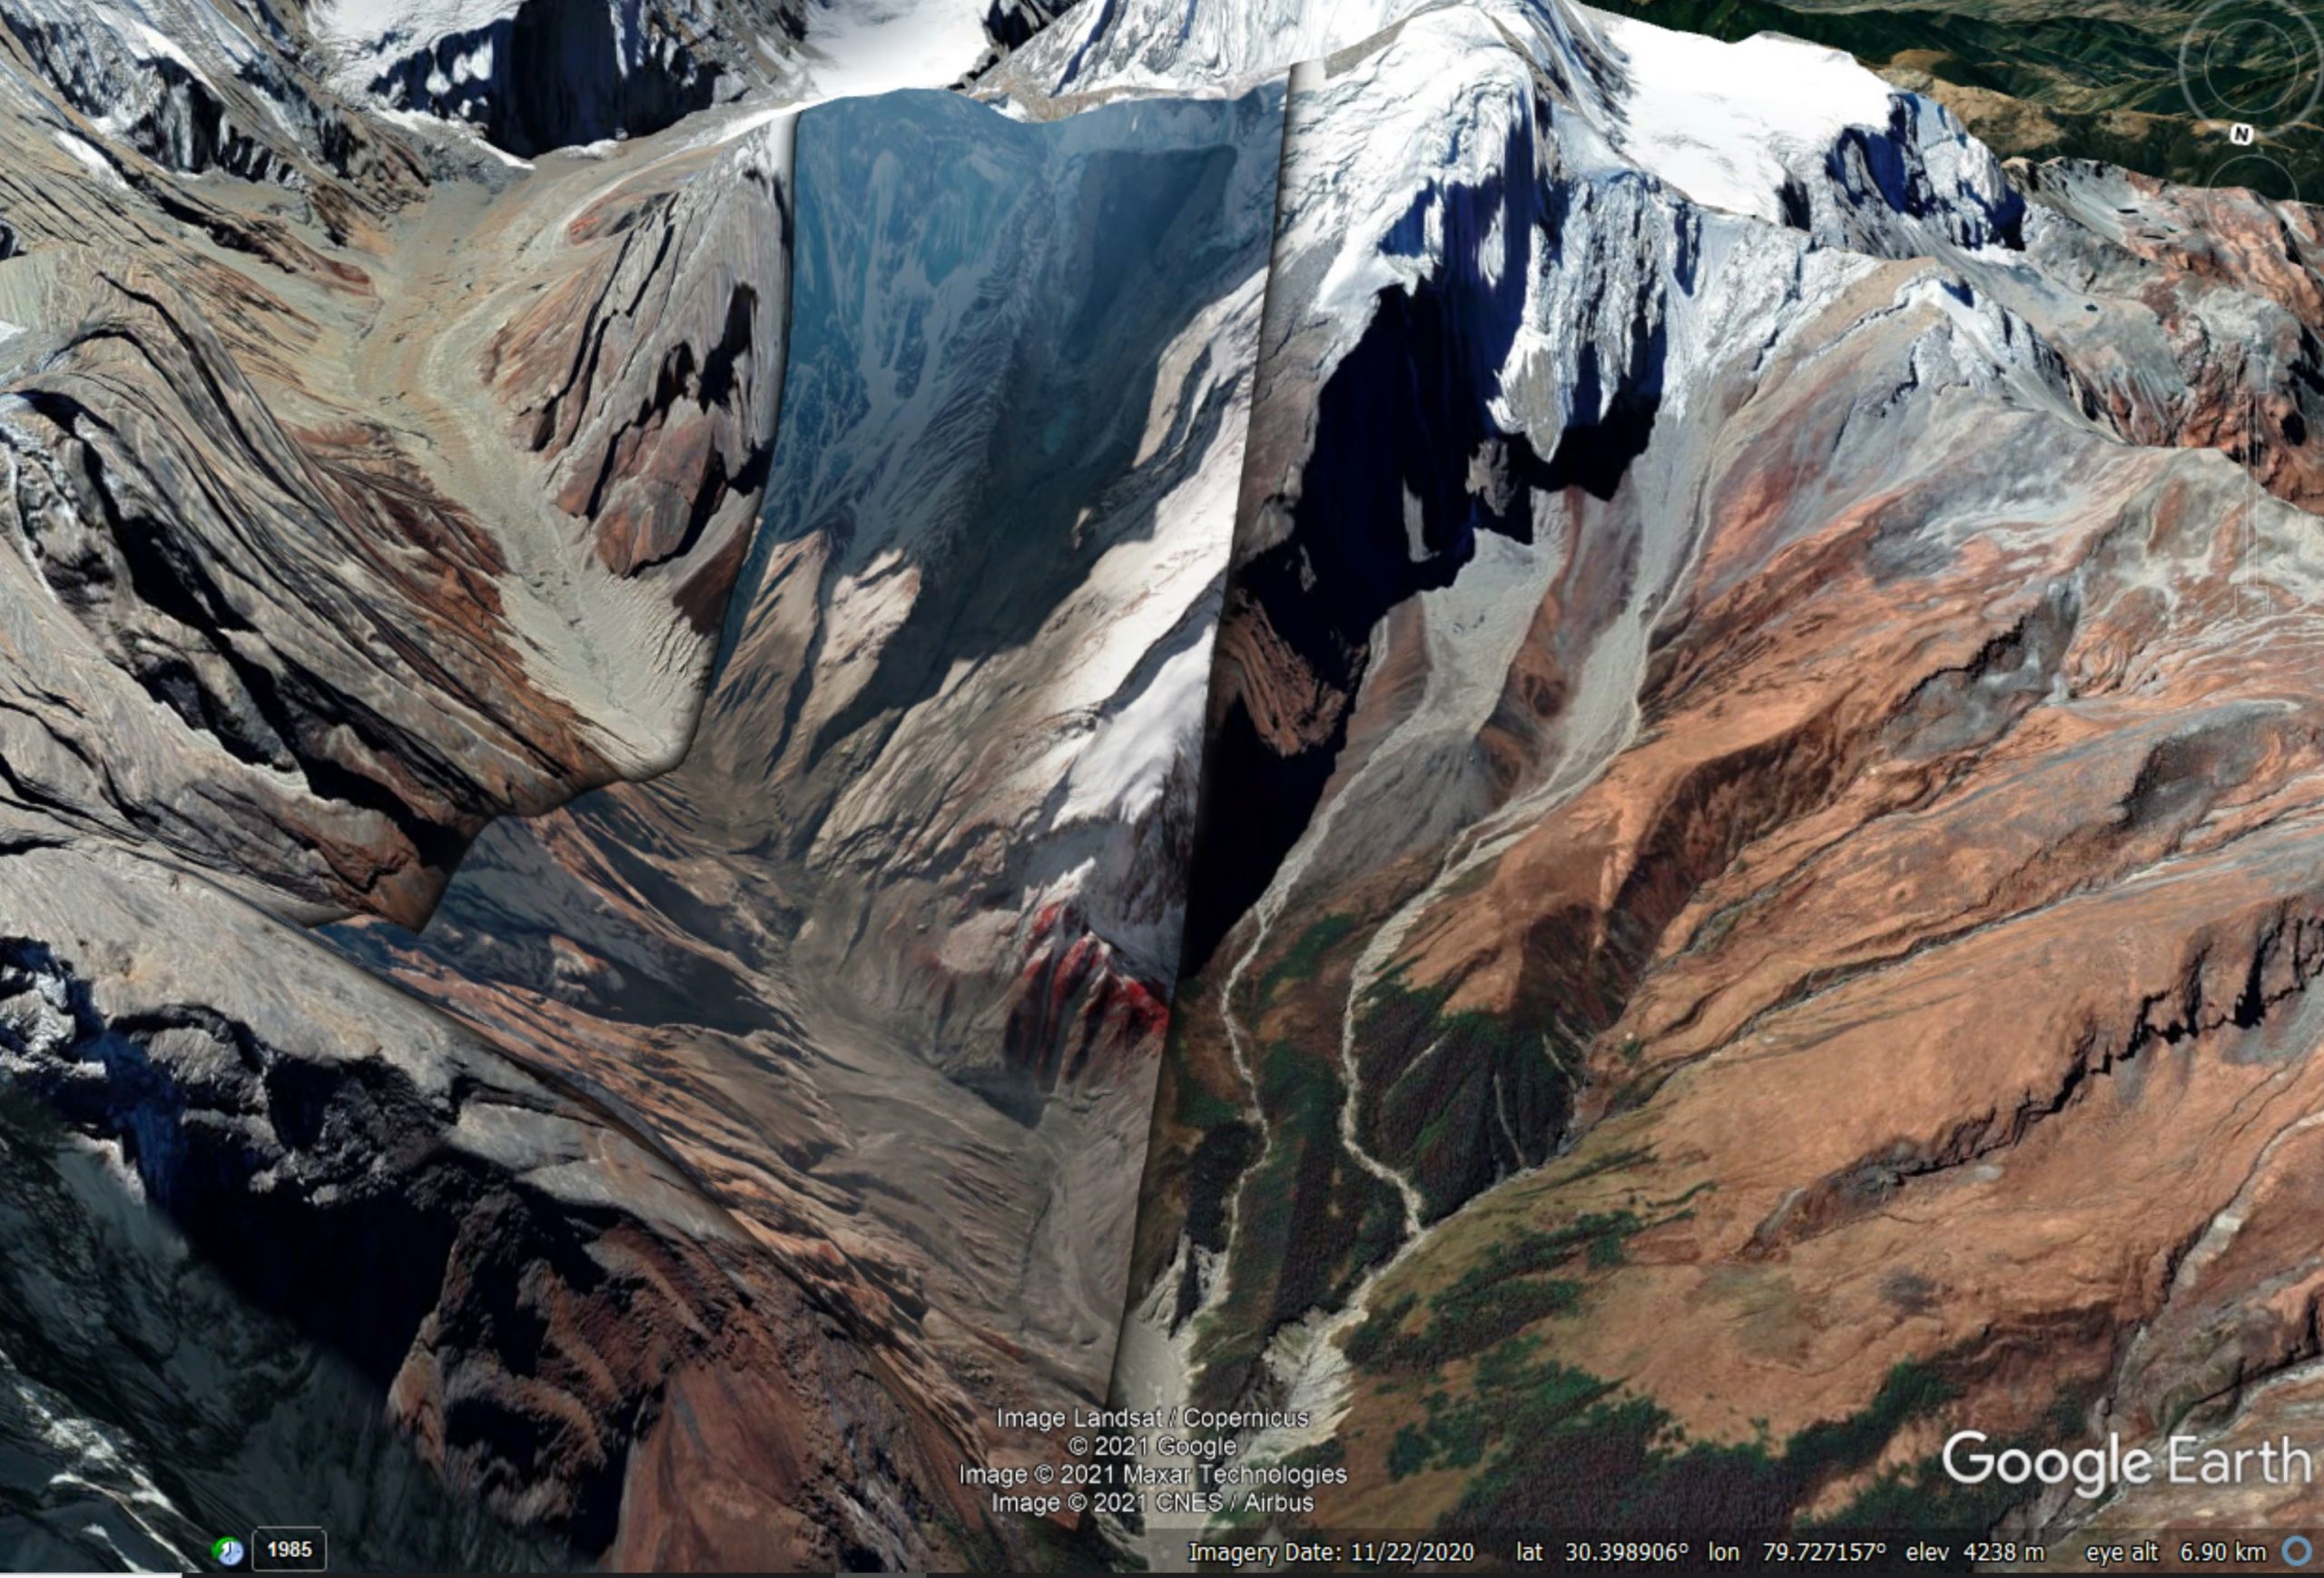
Google Earth perspective view of the slope that failed in the Chamoli landslide, with the Planet Labs SkySat imagery draped over. Imagery copyright Planet Labs, used with permission.
.
To provide a comparison, I have created a slider below that allows you to flick between the images:-
.
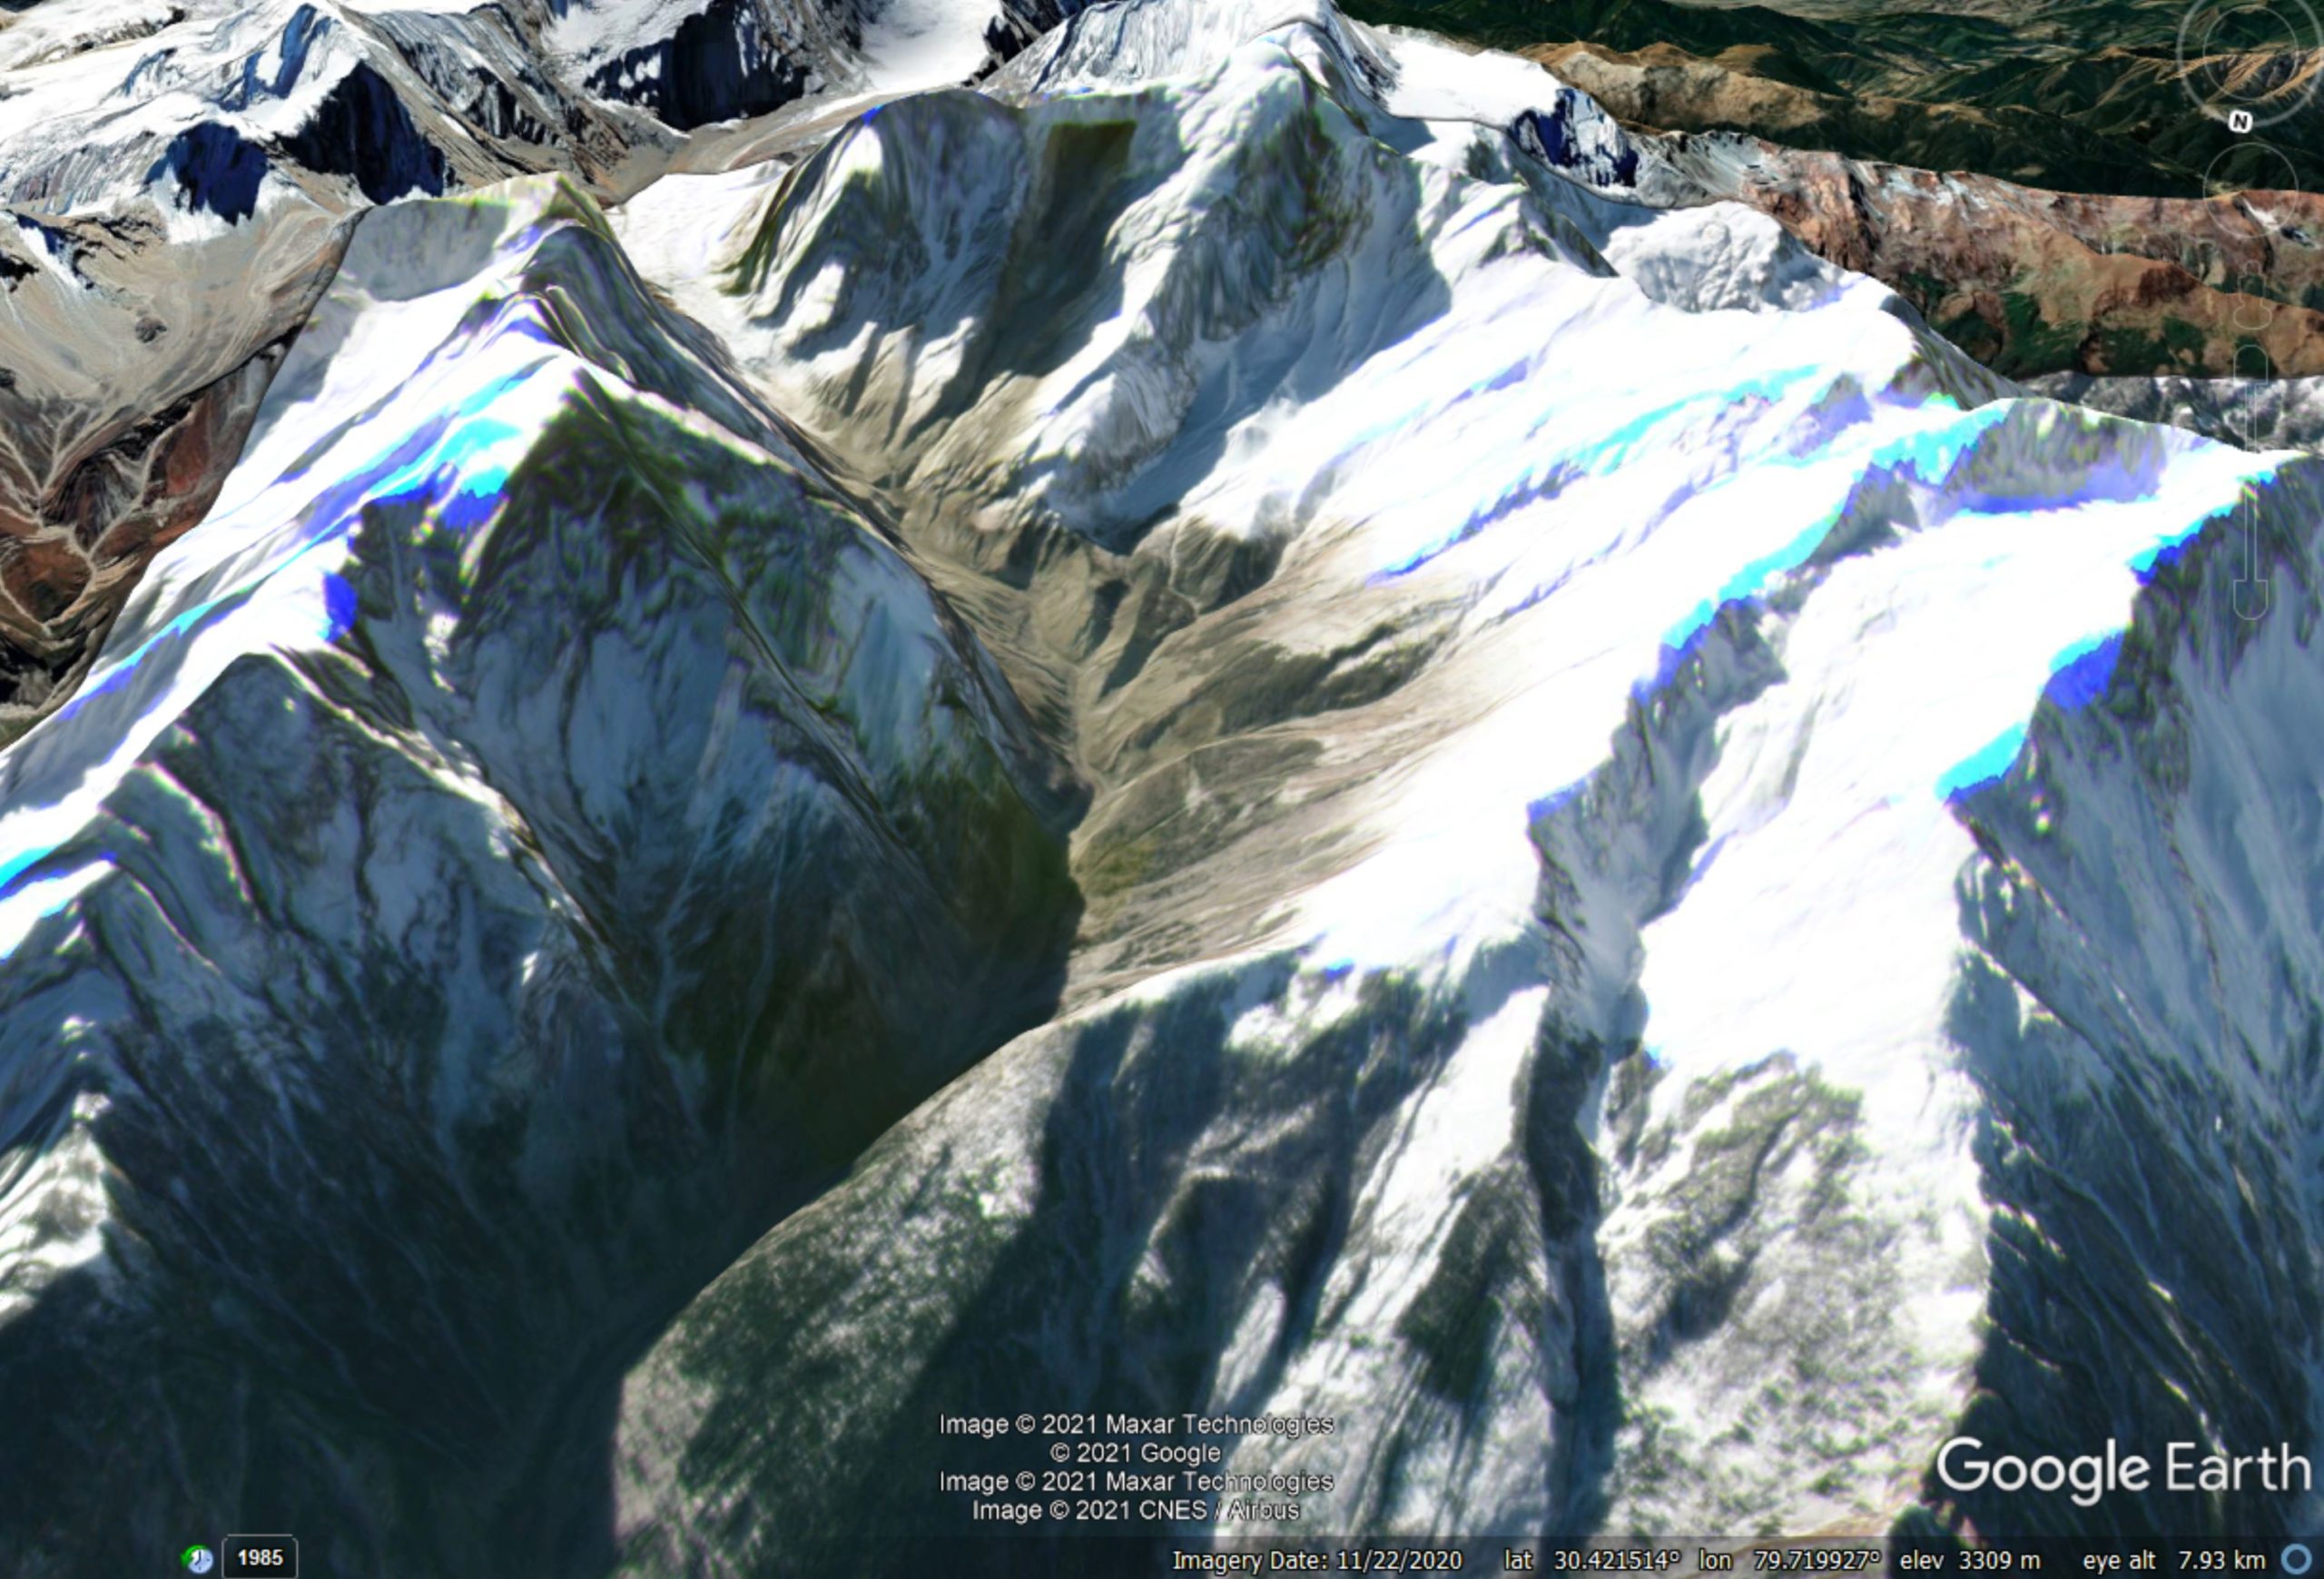
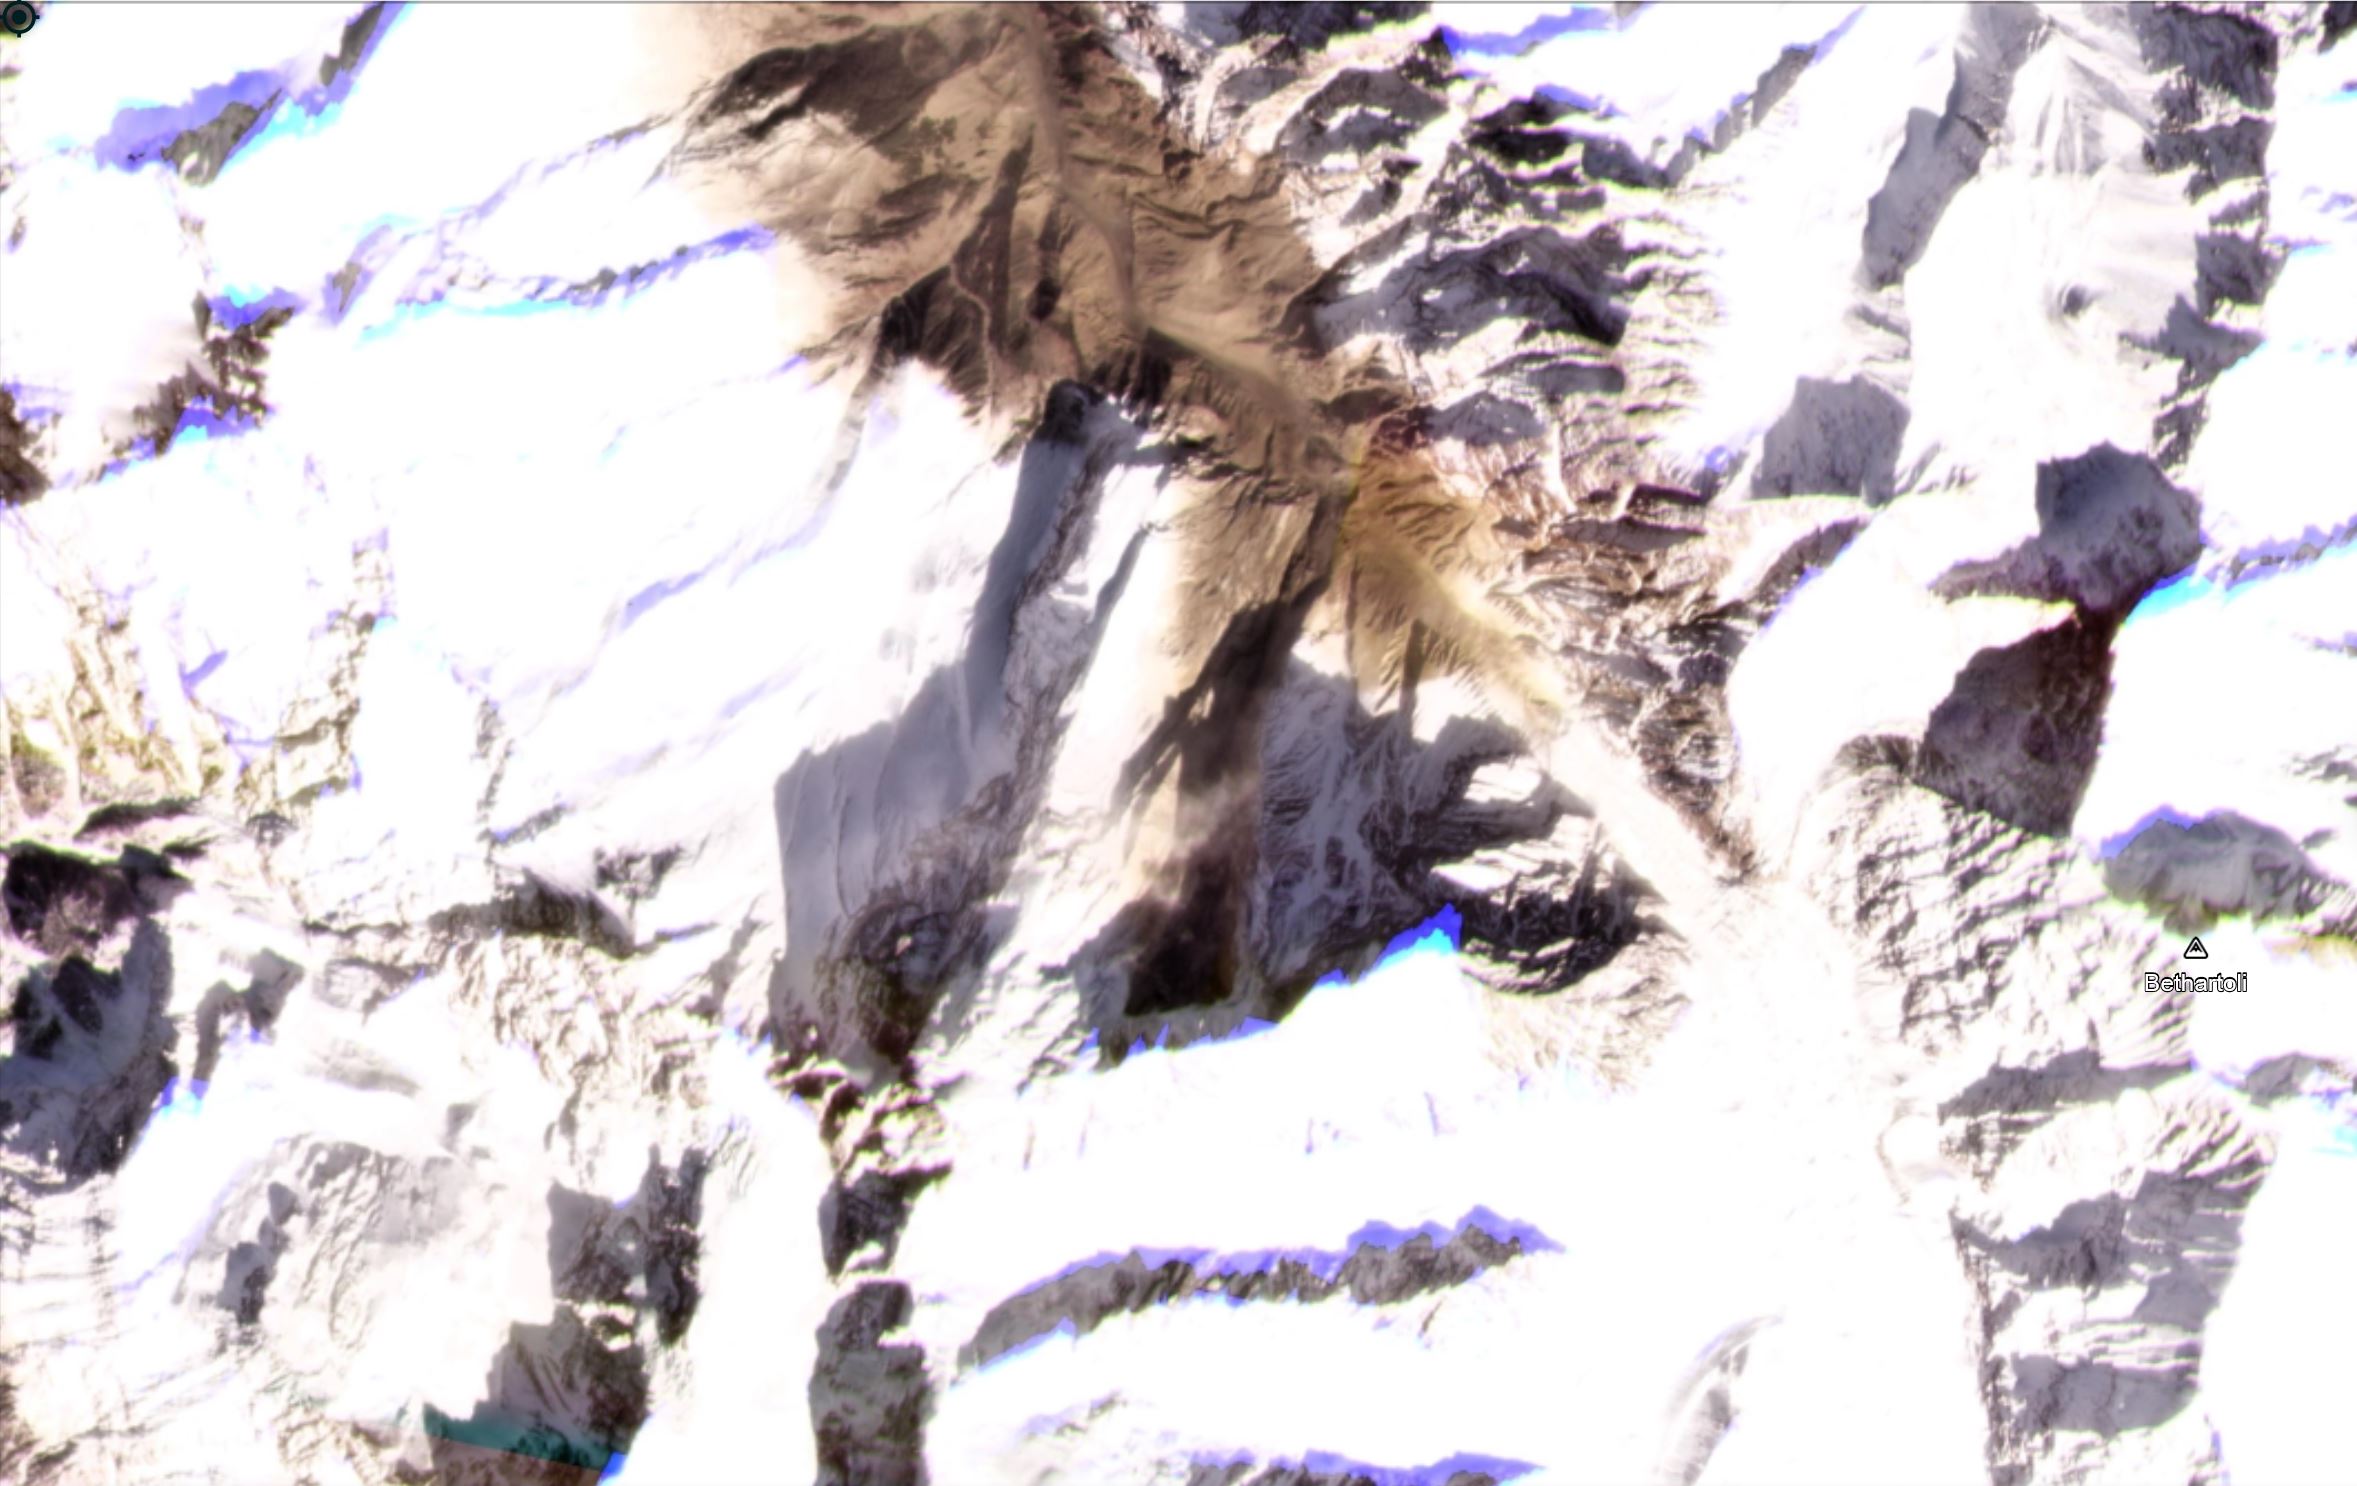
The large block that has failed is clearly seen in the later image, as is the very steep slope down which the debris travelled. The debris appears to have travelled some distance up the opposite slope before heading down the valley. The image below uses the lower resolution Planet Labs PlanetScope imagery to show the path of the debris:
The path of the debris that formed the Chamoli debris flow. Imagery copyright Planet Labs, used with permission.
.
The area of dust deposition in the upper part of the flow path is clear. It appears that the flow became increasingly confined to the lower part of te valley, possibly as it transitioned into a debris flow.
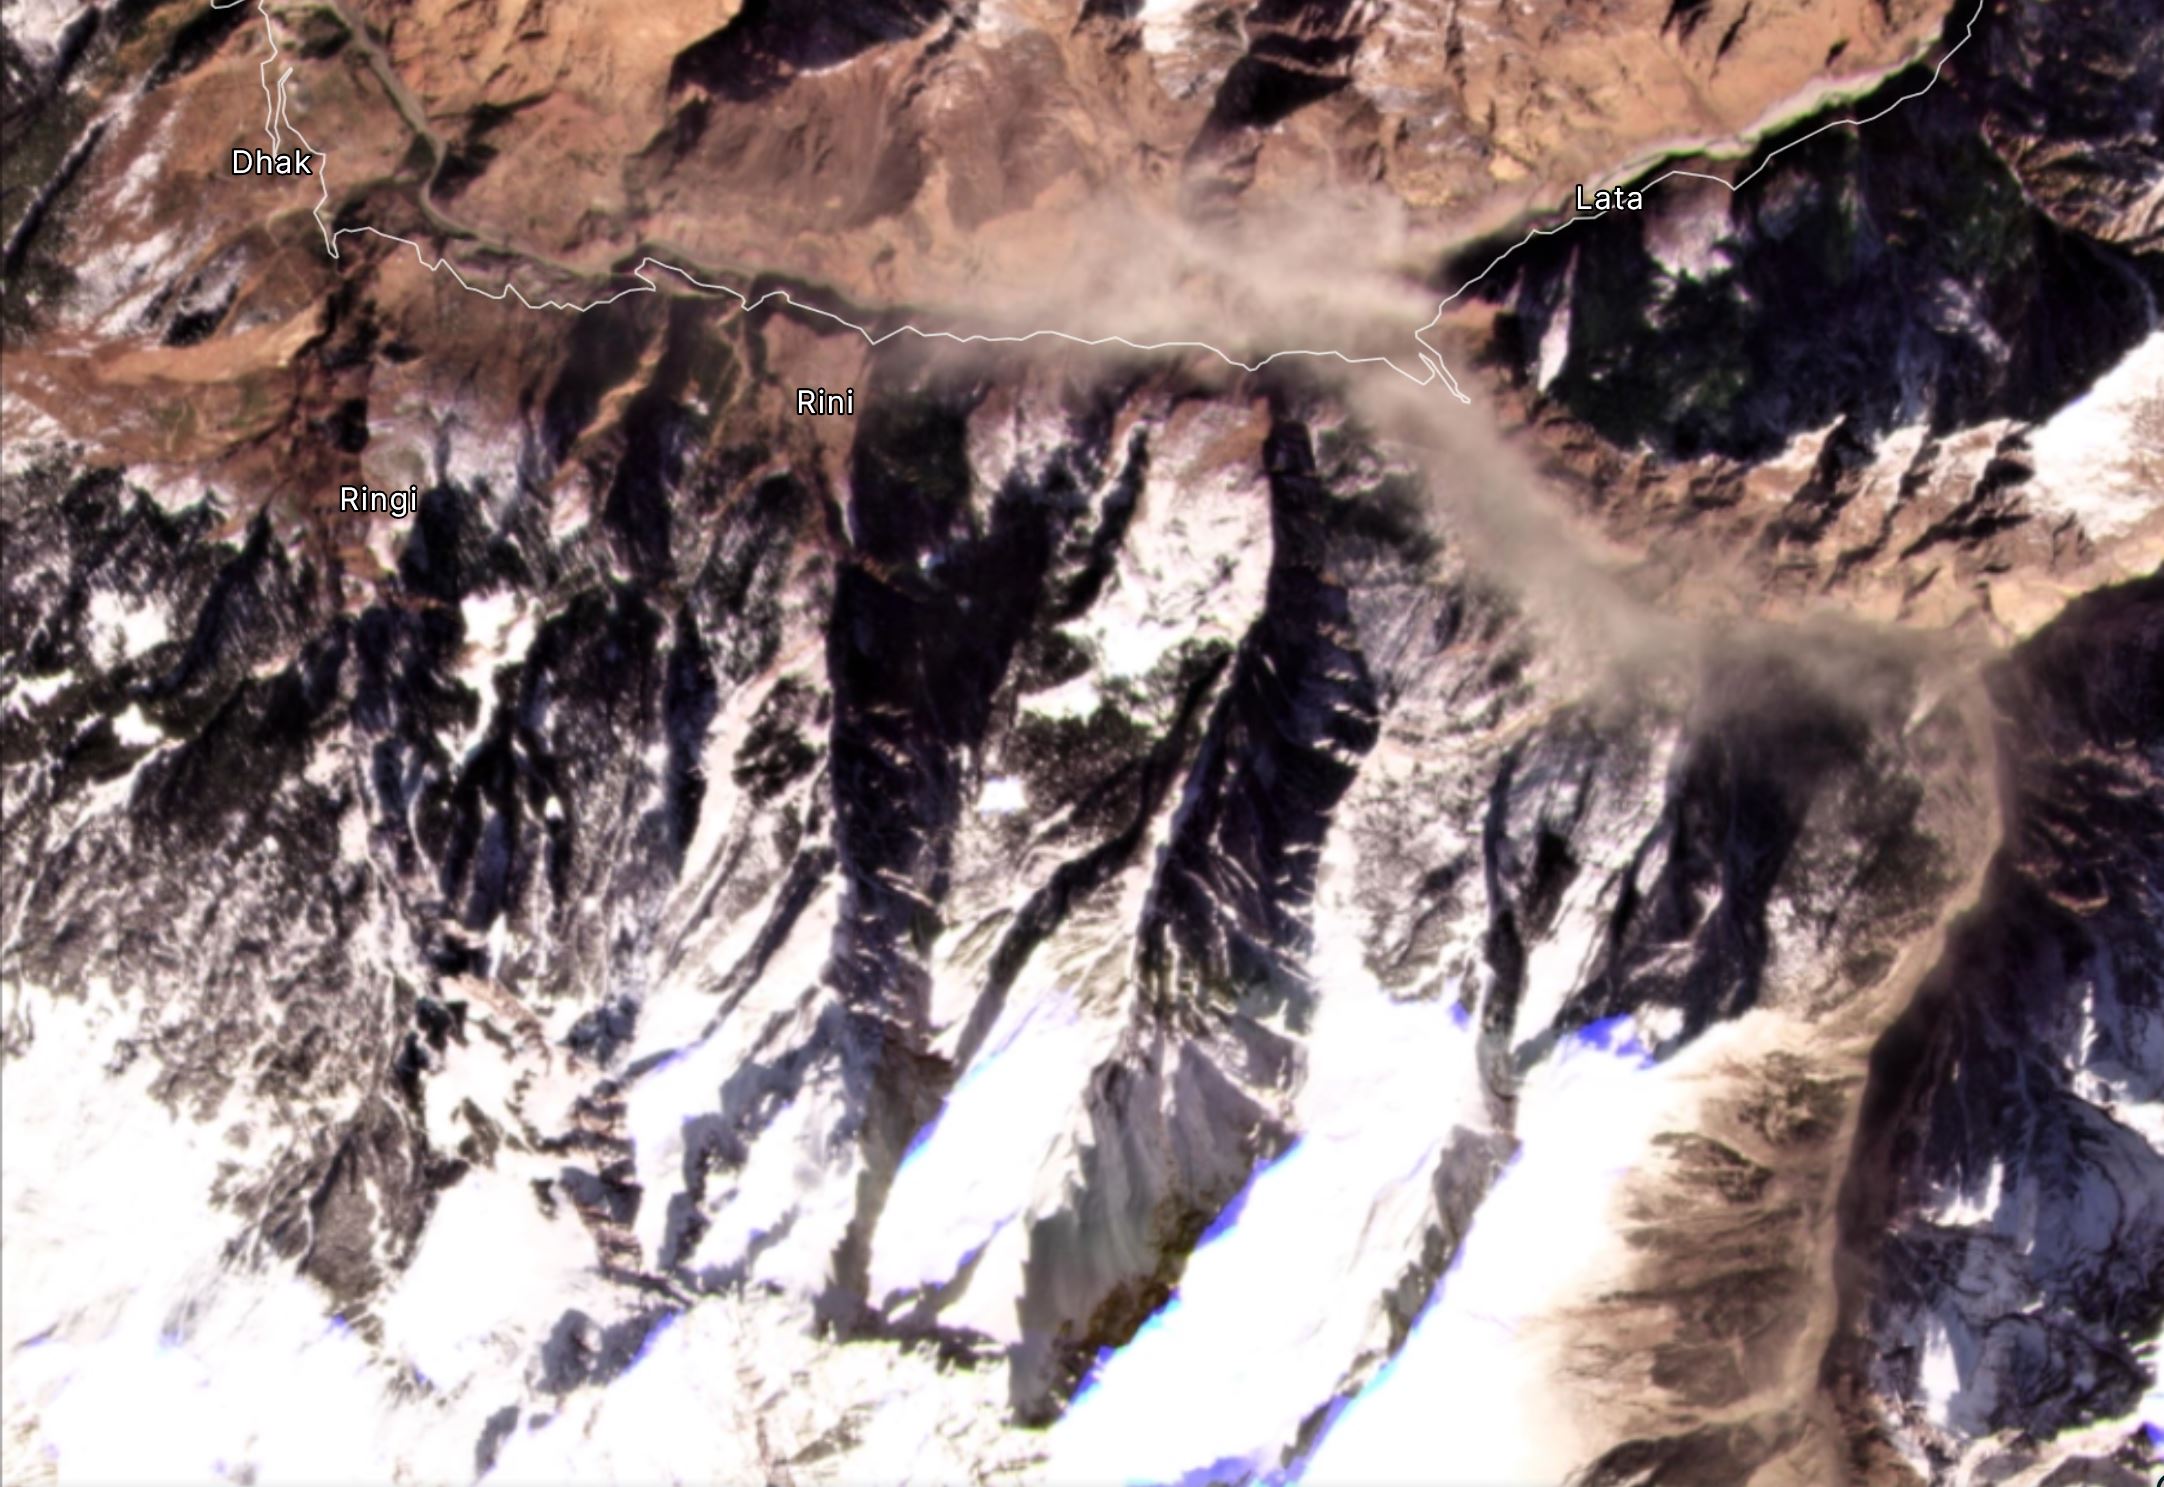
The image below, which was prepared by my friends at Planet Labs, show the full path of the Chamoli landslide and debris flow to the Tapovan Vishnugad hydroelectric dam site:
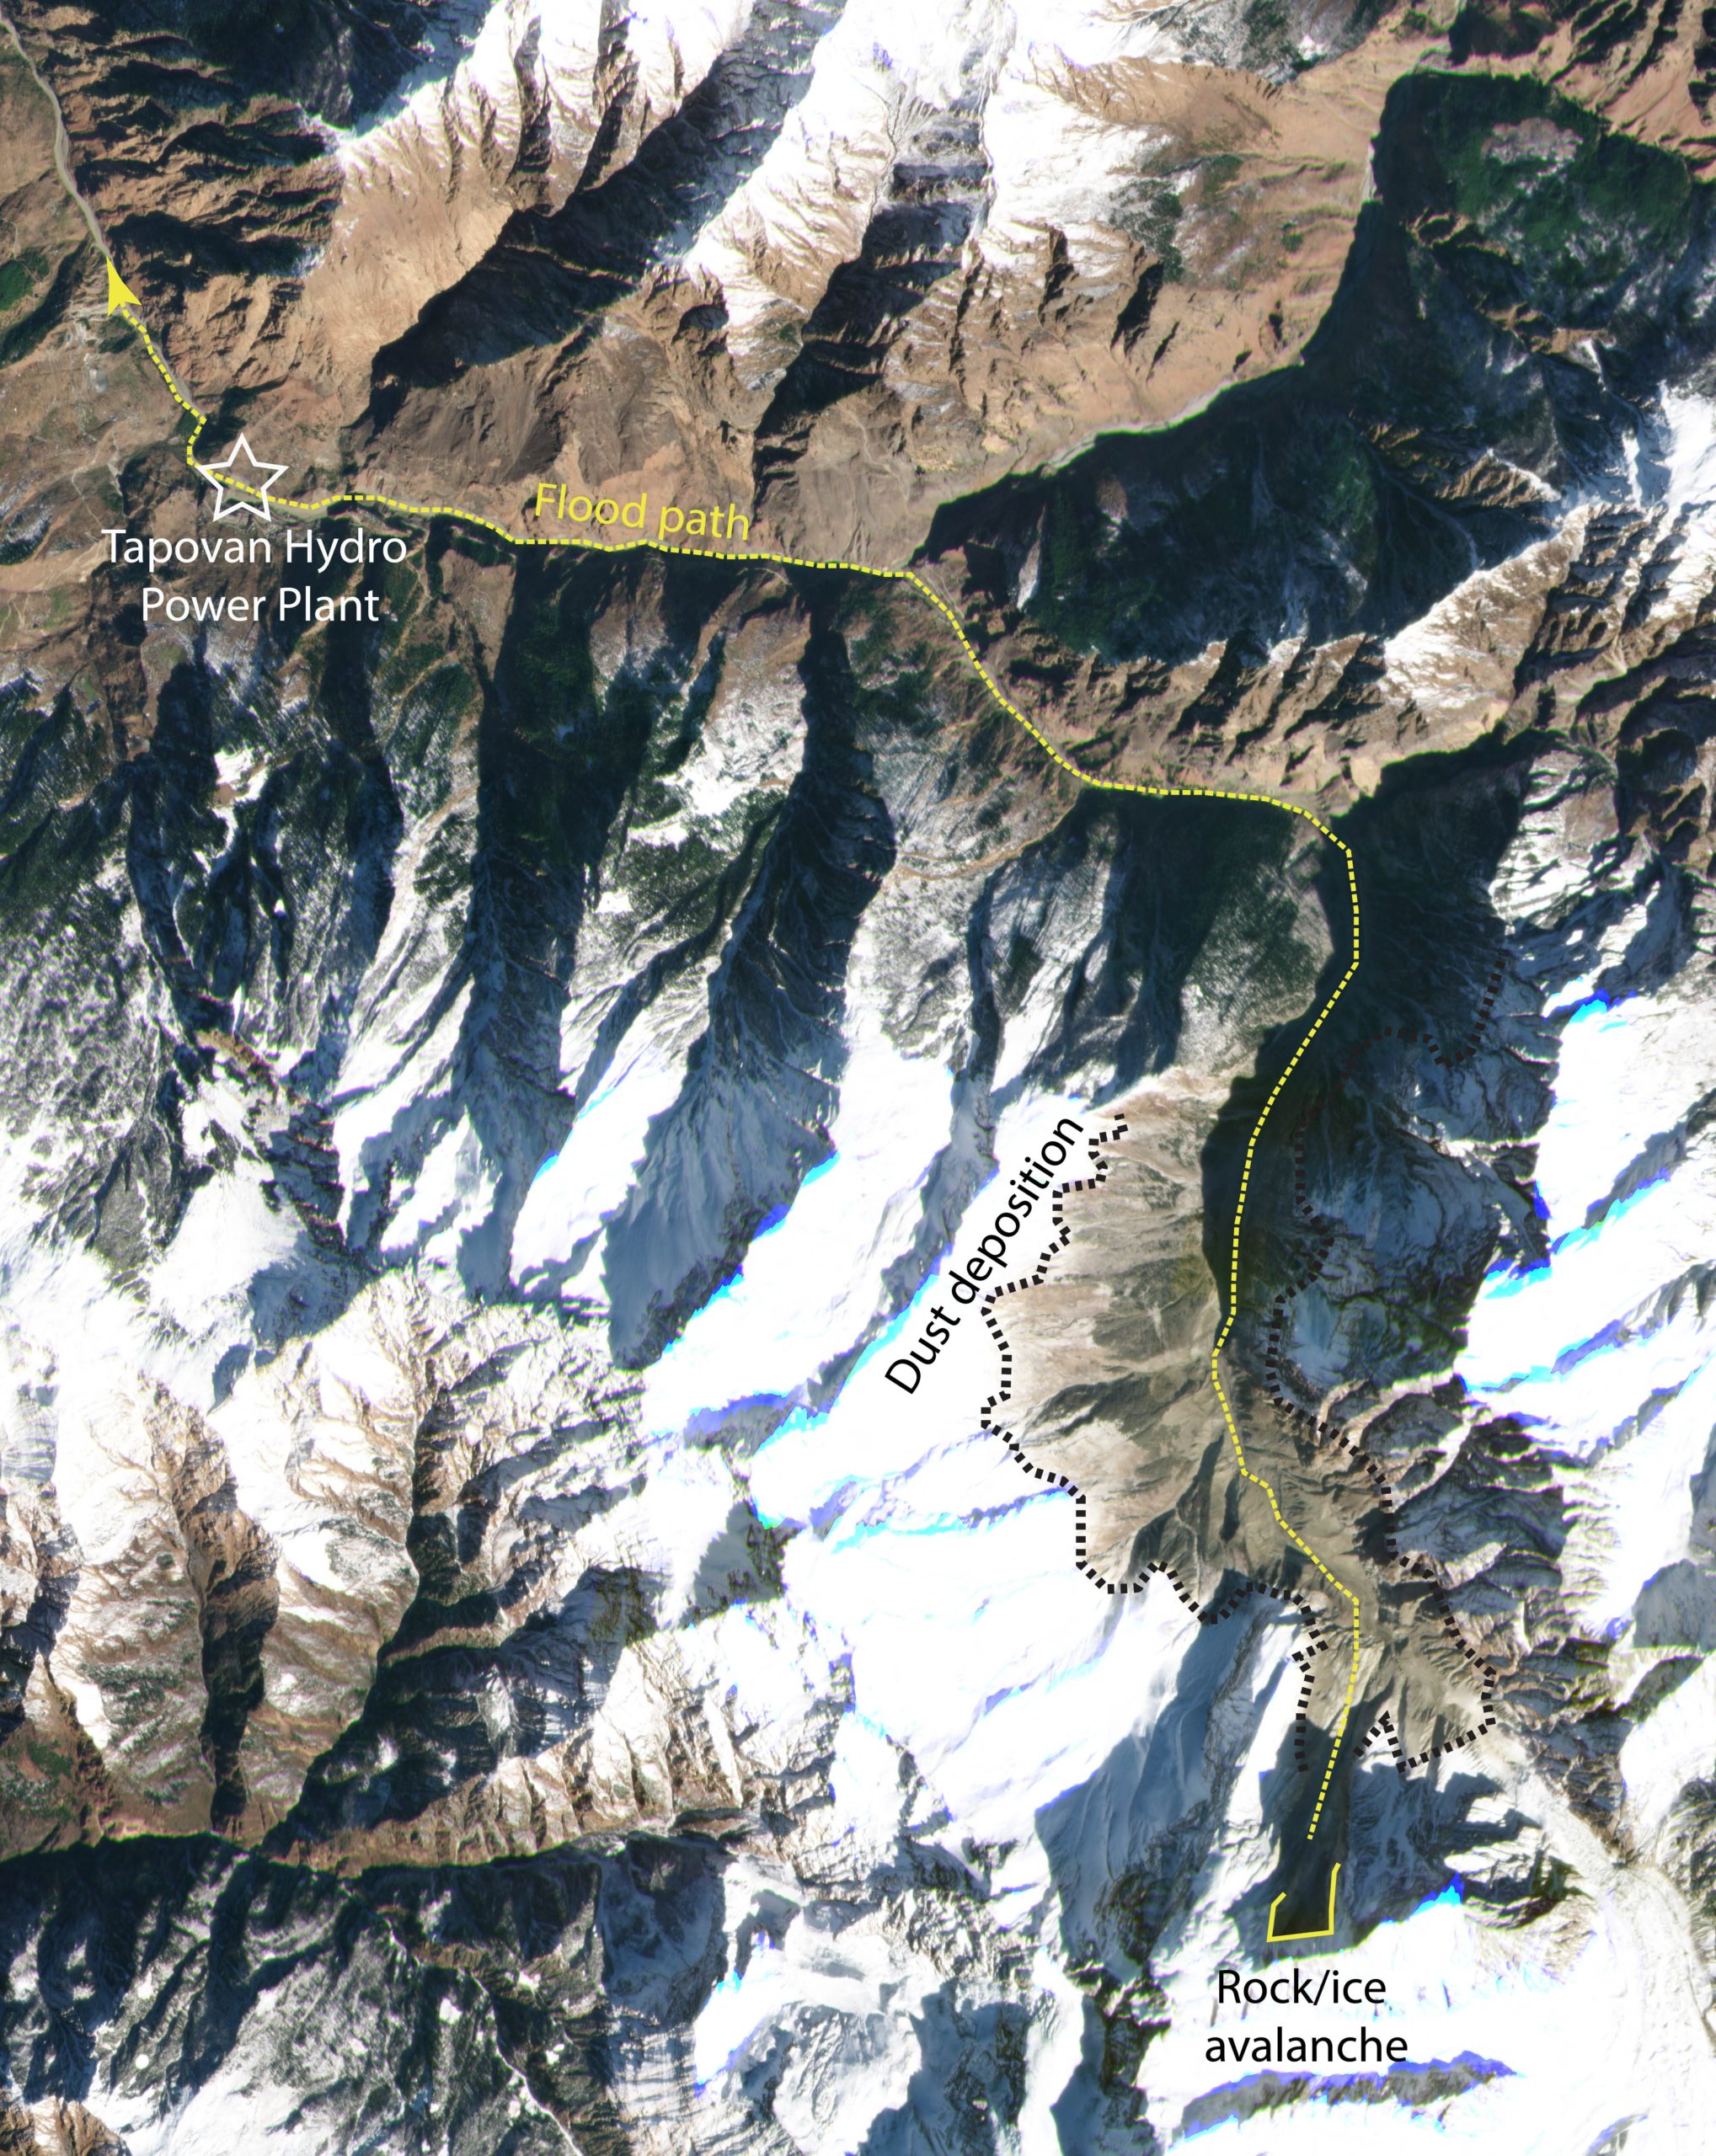
The track of the Chamoli landslide and debris flow. Image prepared by Planet Labs, used with permission.
.
Reference
Planet Team (2021). Planet Application Program Interface: In Space for Life on Earth. San Francisco, CA. https://www.planet.com/
11 February 2021
High resolution Planet Labs imagery of the Chamoli landslide in Uttarakhand
High resolution Planet Labs imagery of the Chamoli landslide in Uttarakhand
Planet Labs has very kindly captured a set of high resolution SkySat imagery of the Chamoli landslide, which they have made available to the research community. Once again I must note my appreciation and thanks for this – it is invaluable. The dataset is so rich that I hardly no where to start with it; at this stage I don’t really have a plan as to how I will post it here. But a good place to start is with the block that detached to create the disaster.
I must also add here that all my interpretations on this blog are initial – they are not intended to be definitive. Proper peer reviewed papers will follow; I hope that I will be involved in some of them. They will provide the definitive story. My posts here are intended to provide an initial interpretation and to give insight into how our thinking evolves over time. As with previous posts, I will seek to correct the posts as new information becomes available.
This is the a Planet Labs SkySat image of the landslide source (part of a much larger image). The image is fantastic, and alongside the Pleaides image that is also available, it gives a really clear impression of what has happened:-
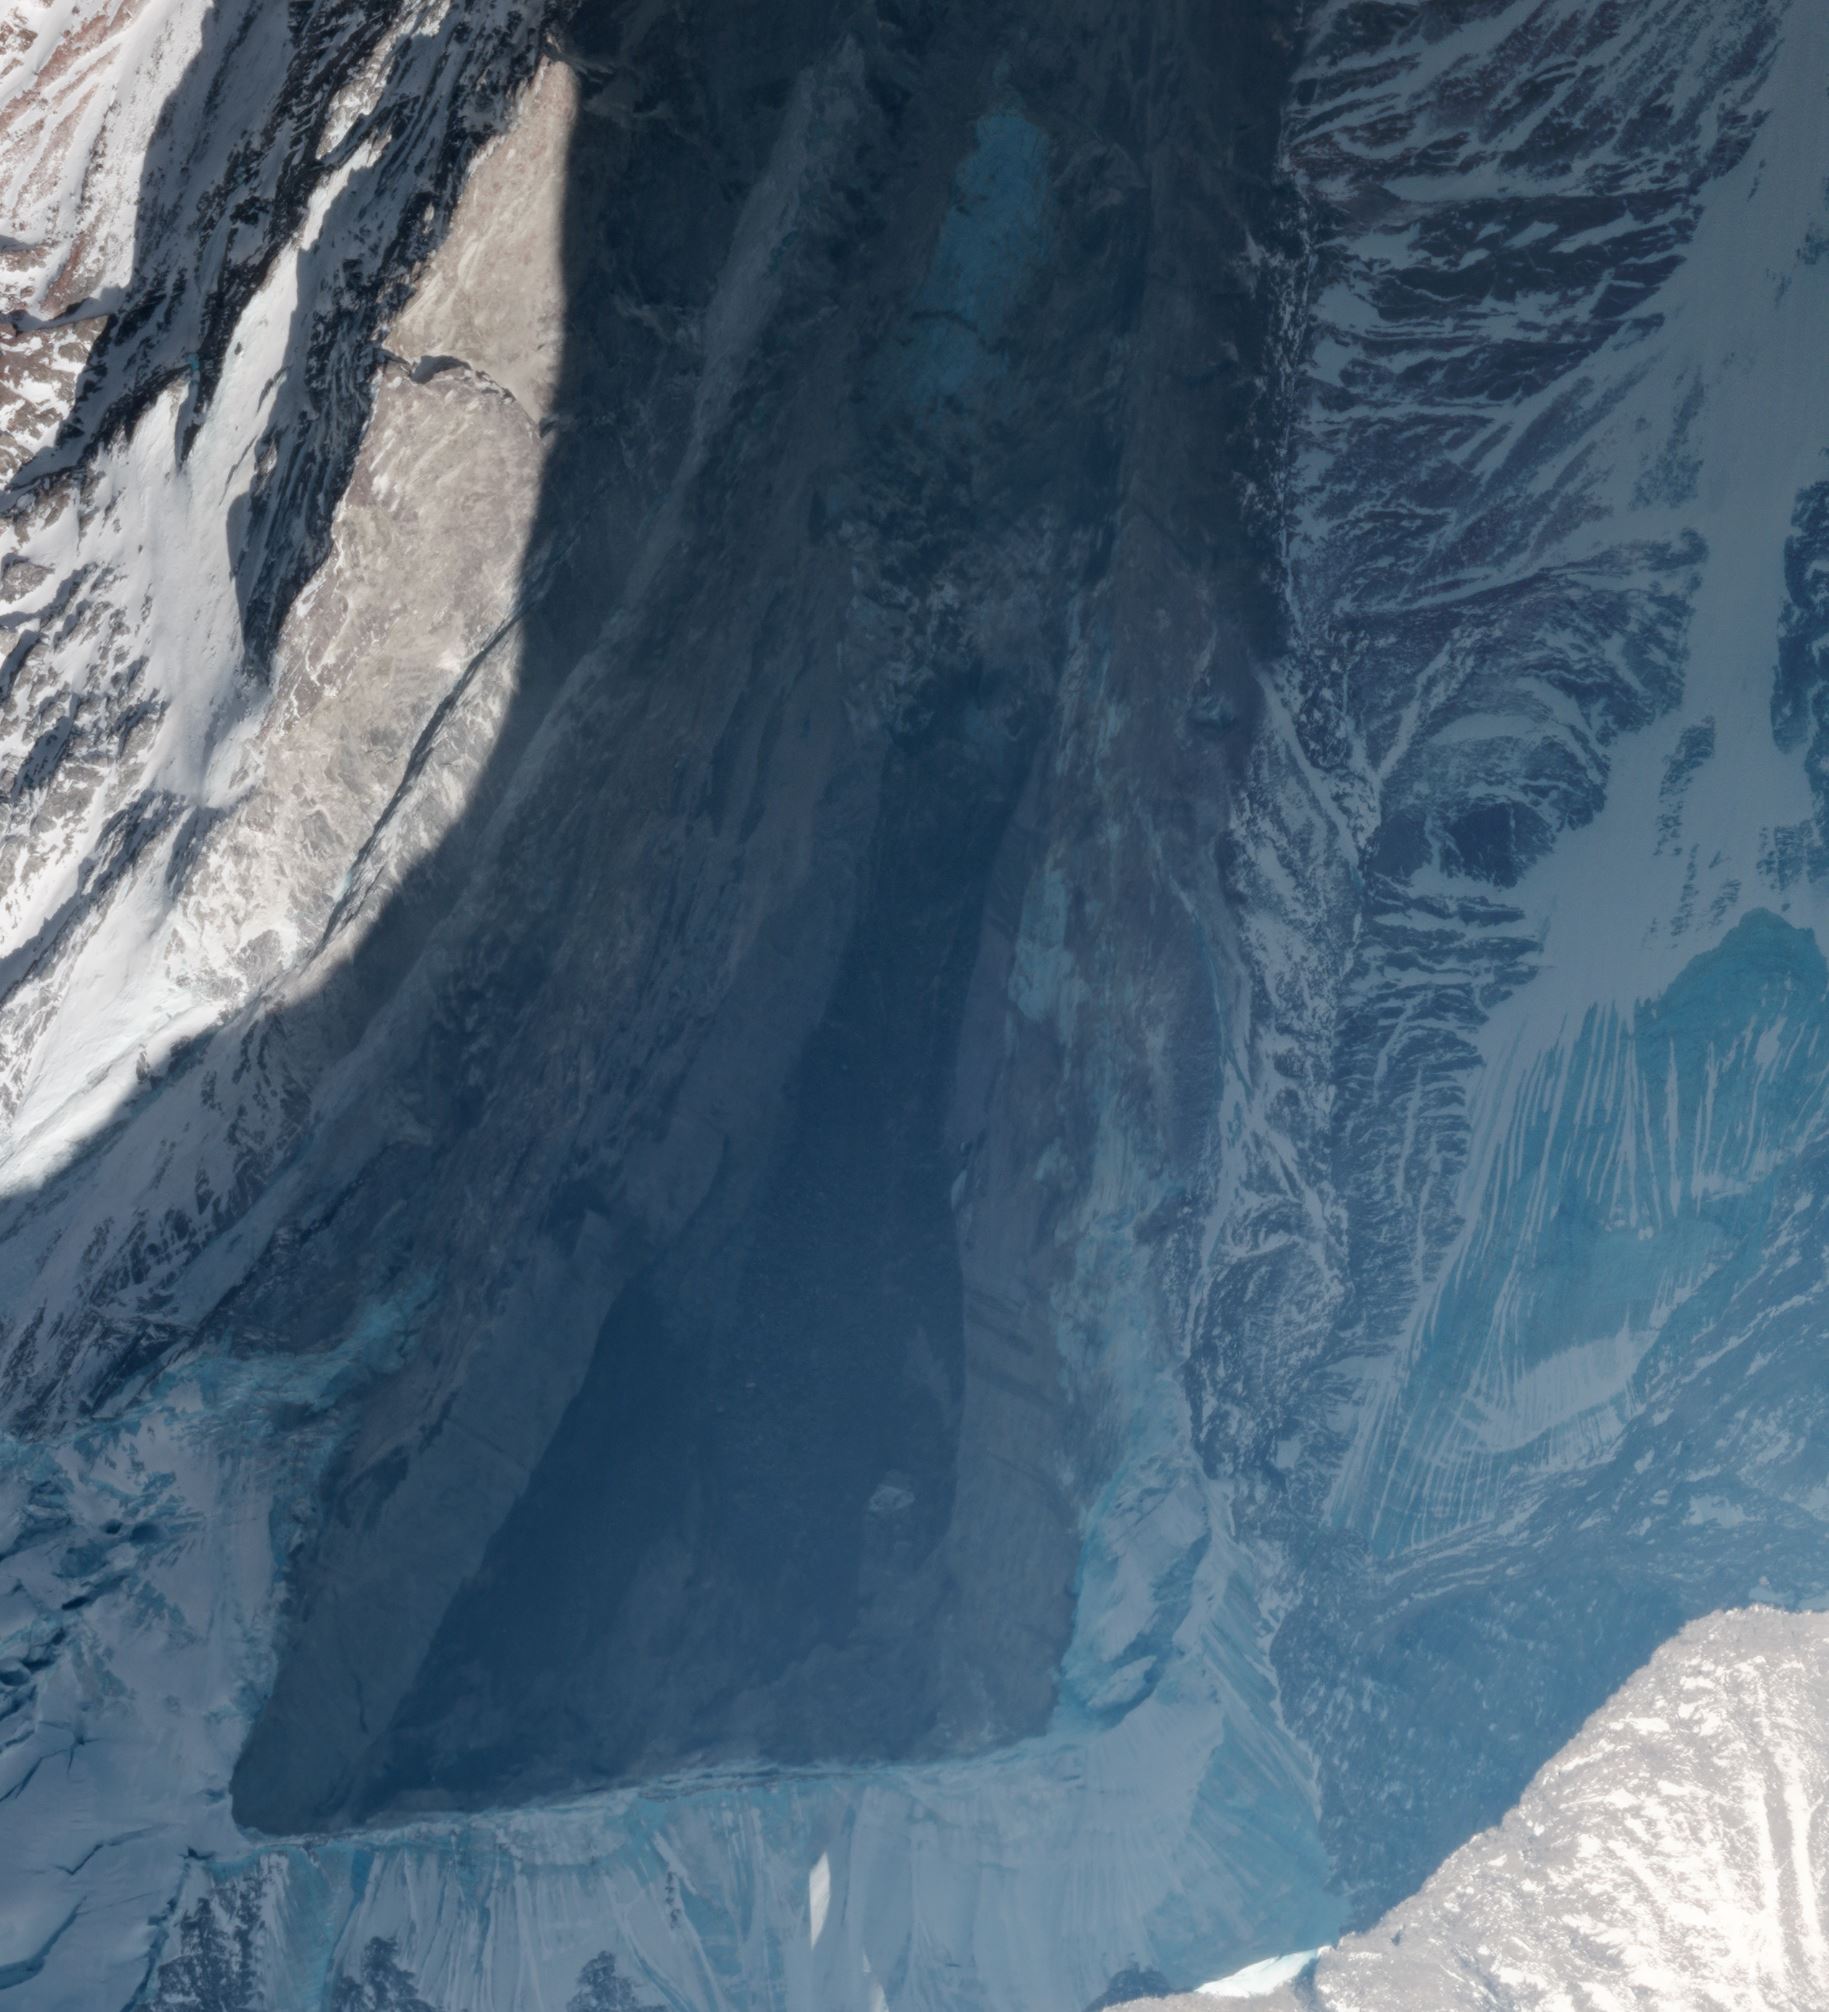
Planet Labs SkySat image of the Chamoli landslide in Uttarakhand. Copyright Planet Labs, used with permission.
.
For orientation, the valley floor is to the north, and the block that has dropped off is about 550 m wide. This is a very steep slope, so the block is very large indeed.
My interpretation is that this is a wedge failure – note the inclined surfaces on the east and west side, although the basal shear plane (the darker rock in the image) may be another, slope parallel, joint. The block has dropped out of this wedge-shaped source, and fallen almost vertically about 1800 metres.
It is interesting to compare the image above with one from the days before the collapse. The image below of the site of the Chamoli landslide was captured by Planet Labs using their lower resolution PlanetScope instrument on 30 January 2021:-
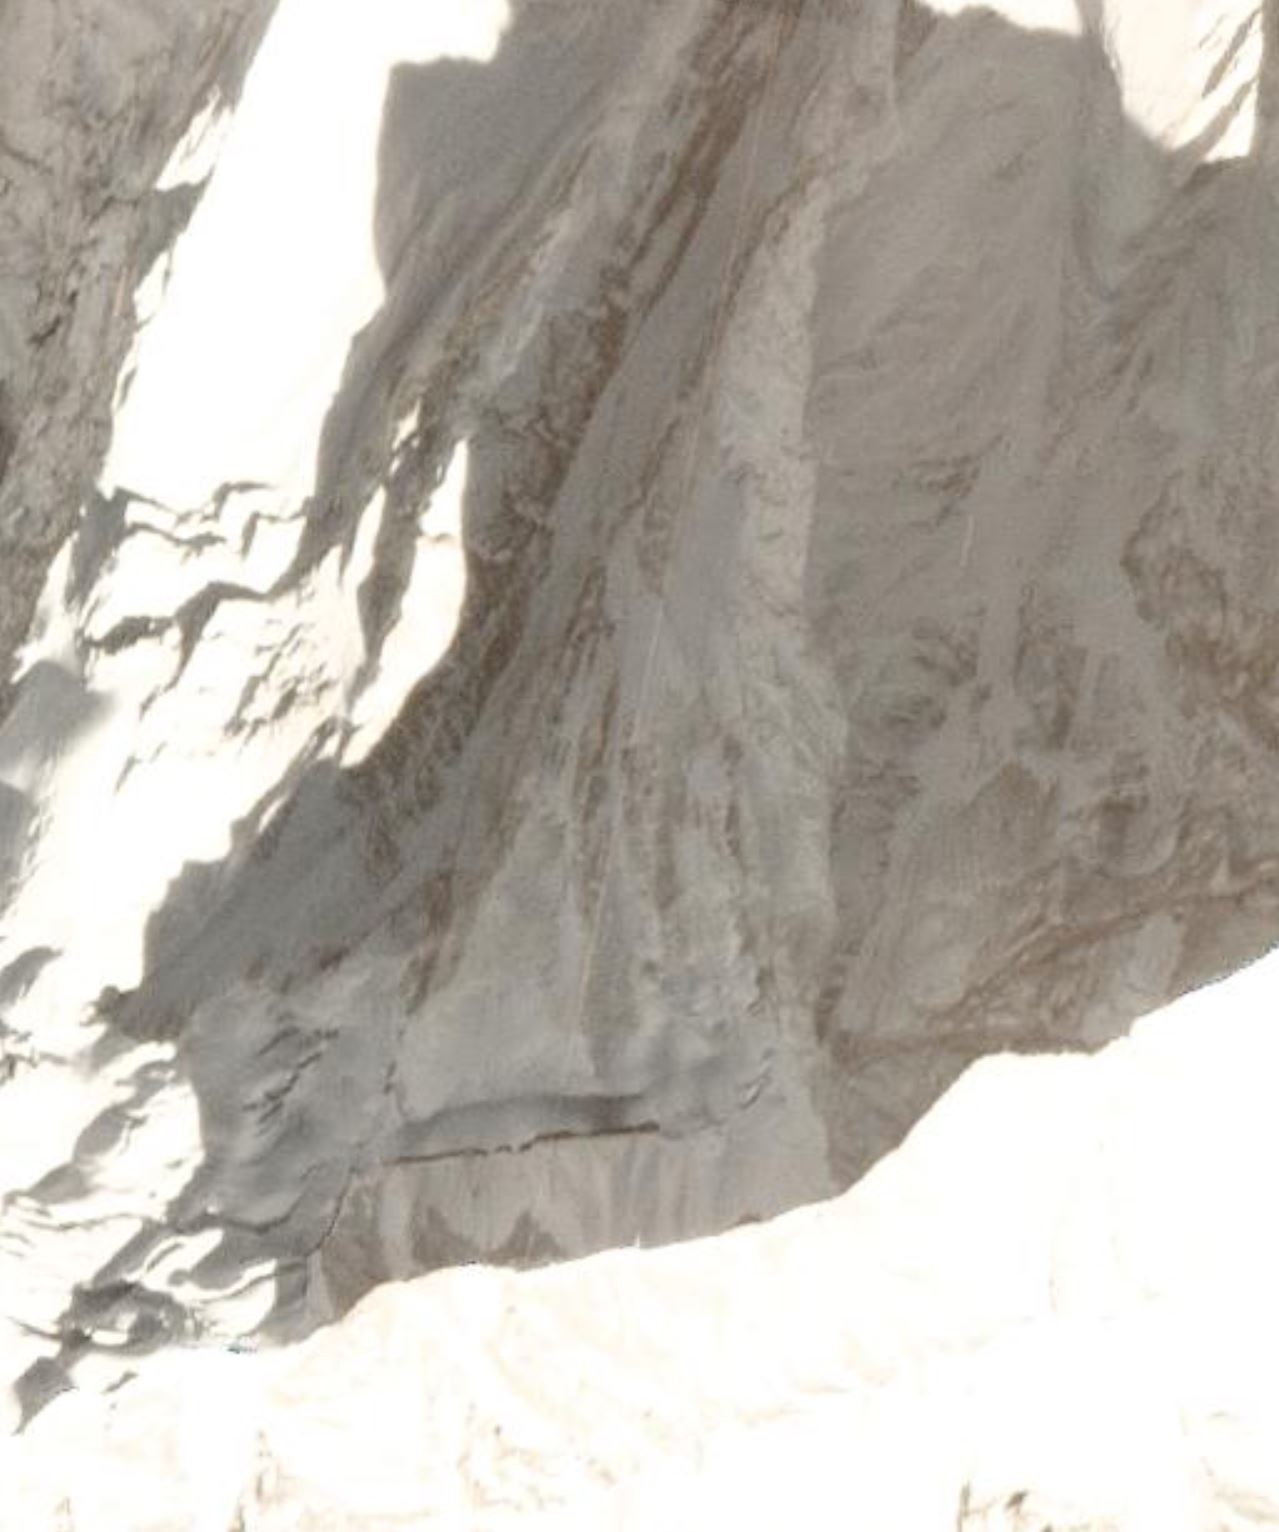
Planet Labs PlanetScope image of the site of the Chamoli landslide in Uttarakhand. Copyright Planet Labs, used with permission.
.
A couple of things to note here. First, a large tension crack at the crown of the landslide is clearly visible in the January image. To have been captured on imagery with a 3 m spatial resolution means that this was a really substantial feature. Second, whilst there have been some suggestions that this was a hanging glacier. There was some thick ice in the upper reaches, but I don’t believe that this could be described as a hanging glacier. Further down the slope, on the block that failed, bare rock is visible.
Thus, I continue to believe that this is the failure of a rock block not of a hanging glacier. It is a landslide not a glacial event, in my opinion at this time.
Reference
Planet Team (2021). Planet Application Program Interface: In Space for Life on Earth. San Francisco, CA. https://www.planet.com/
10 February 2021
Hydroelectric power, dams and landslides in the Himalayas (and in other high mountain areas)
Hydroelectric power, dams and landslides in the Himalayas
Controversy continues to rage in India as to the cause of the dreadful debris flow in Chamoli, with some organisations continuing to claim that it was caused by a GLOF or by some sort of glacial collapse, despite strong evidence to the contrary. Meanwhile efforts continue to recover the remains of the victims of the landslide, with some sources suggesting that there may be about 200 fatalities.
The macro-scale issue is however the management of risk in high mountain areas of the Himalayas, especially in the context of a warming climate, which is affecting this area particularly severely. At the time of the 50th anniversary of the 1963 Vajont dam disaster in Italy, I wrote a paper outlining the poor track record of landslide management in hydroelectric power schemes in high mountain areas in poor countries, especially in the Himalayas and in China. My central point was that the risk of landslides was insufficiently appreciated, and that slope failures were being poorly managed, in many dam projects in these mountain areas.
Over seven years on, significant landslide accidents continue to occur in hydroelectric power projects in the Himalayas and elsewhere. Notable examples have included Mangdechu in Bhutan, Taining County in China, Upper Madi in Nepal and the massive, ongoing problems at Punatsangchhu-I in Bhutan. There are many more that I have not featured here. Away from Asia, the extraordinary and deeply troubled Hidroituango project in Colombia is notable.
The events at Chamoli adds another, dreadful example to this roll call. There appears to be two hydroelectric schemes involved in the Chamoli debris flow, of which the most significant in the 520 MW Tapovan Vishnugad scheme:-
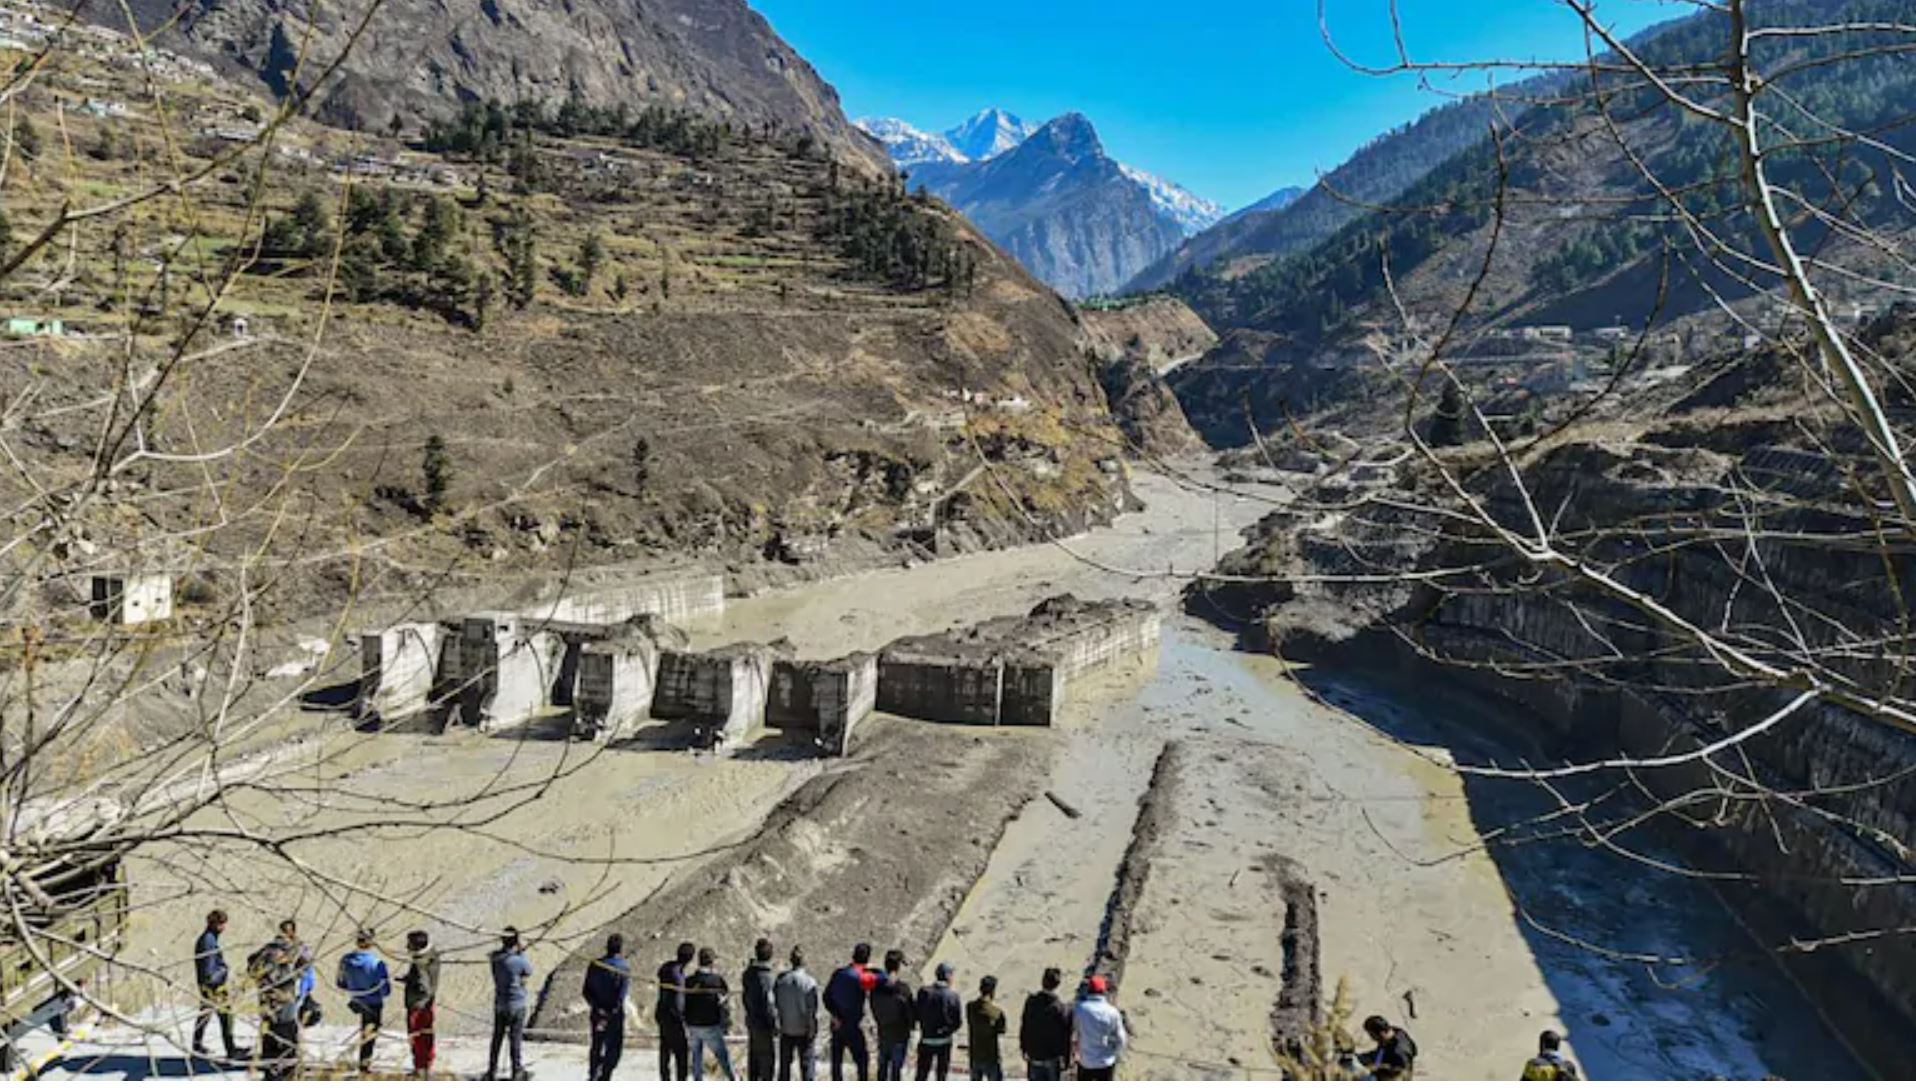
The Tapovan Vishnugad HEP site in the Himalayas after the Chamoli debris flow. Image from PTI via India Today.
.
The appears to have been a deeply troubled scheme even before the landslide. Descriptions of this project indicate that the expected completion date was in 2012, but at the time of the landslide it was still under construction. Problems seen to be associated with very difficult geological conditions, leading to slow progress in the tunnelling operations, including significant groundwater ingress. In 2014 there were reports of at least three occasions in which the TBM had become trapped.
But as the image above shows, the problems with this scheme are now much more serious. Aside from the damage to the infrastructure, which looks to be extremely severe (see the satellite images in an article in India Today), there will be a need to assess properly the likelihood of another event of this type in the life of the dam. In a warming climate this cannot be precluded.
Back in 2013 I noted that (Petley 2013):
In the coming years a very large amount of dam construction is planned around the world as the need for hydroelectric power increases for both social and environmental reasons. Major hydroelectric power projects are planned or proposed in high mountain areas on all of the inhabited continents. However, the global centre for large-scale dam and reservoir projects in the next two decades will inevitably be South and East Asia, with the steep valleys of the Himalayas being responsible for a substantial proportion of that planned activity.
It is clear that a very large number of new projects are planned in this region in the coming years. In most cases these projects will be constructed in areas that have been subject to high levels of landslide activity in the past, such that palaeo-landslide deposits are likely to be extensive. Landslide activity under contemporary climatic conditions is likely to be high, and most of this area is also subject to occasional large or very large earthquakes, which are likely to be associated with extensive landslide activity. Finally, the effects of climate change in this area may be increased precipitation intensity , which may increase landslide activity in coming years. Thus, without careful management there is a strong potential for continued landslide impacts on large dam and reservoir projects.
Since the Vajont disaster, the dam and reservoir industry has very successfully identified and mitigated landslides, albeit at times at very high cost. A similar level of action is now required to address landslides occurring at and around dam construction sites and in the camps housing the workers, especially in East and South Asia. To do so will require concerted effort from planners, funding agencies, regulators and construction companies.
Sadly, the lessons from Vajont, and from many subsequent landslide events in and around large dam projects, have not been learnt. Until they are we will see many failures, with high levels of loss.
.
Reference
Petley, D.N. 2013. Global losses from landslides associated with dams and reservoirs. In: Genevois, R. and Prestininzi, A. (eds) International Conference on Vajont – 1963-2013. Thoughts and analyses after 50 since the catastrophic landslide. Italian Journal of Engineering and Environment – Book Series N. 6, pp 63-72.
9 February 2021
Southannan: a major railway landslide in Scotland
Southannan: a major railway landslide in Scotland
The United Kingdom has seen a prolonged period of heavy rainfall and, at times, snowfall in recent weeks. This has led to reports of landslides from around the country, including substantial numbers on coastal cliffs. Perhaps the most significant event however has happened close to Southannan in Ayrshire, in SW Scotland. This landslide, and another smaller event, have affected the railway line between Ardrossan and Largs.
Network Rail Scotland has tweeted out an image that provides a really good overview of the landslide:-
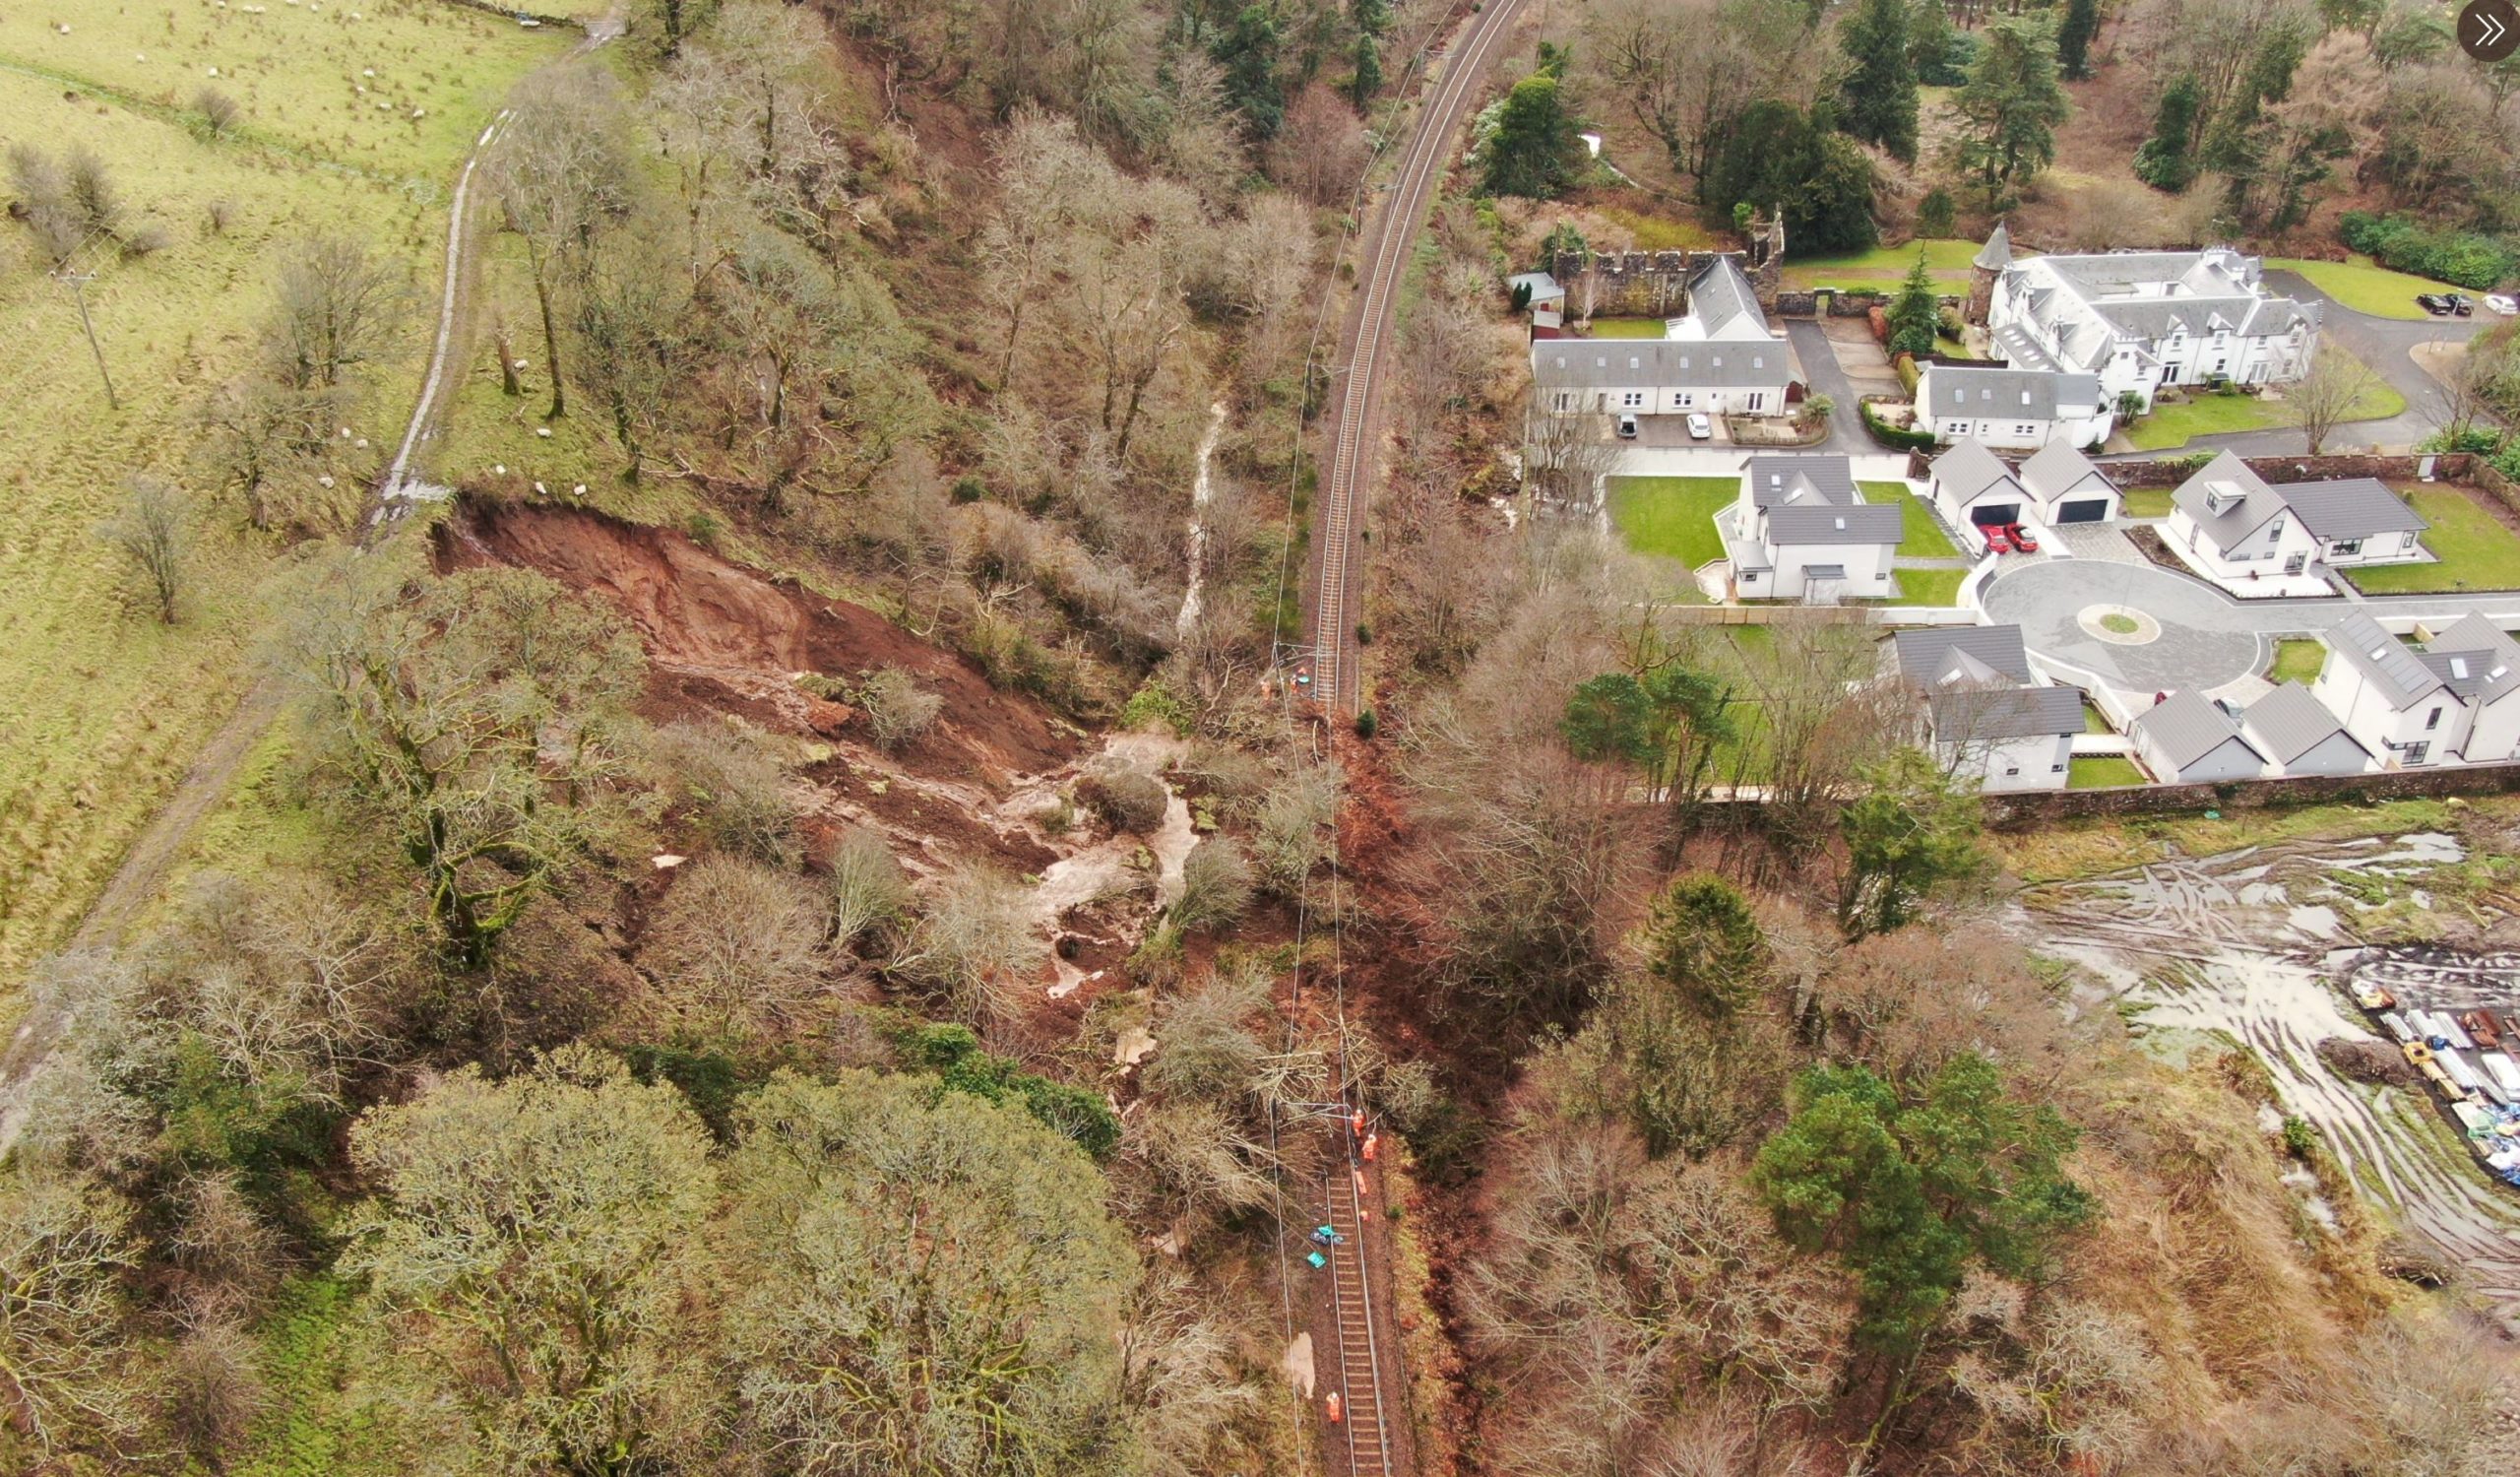
The landslide at Southannan in SW Scotland. Image tweeted by Network Rail Scotland.
.
This is a classic translational slope failure, with a failure plain that is quite deep, in weathered soil and regolith. It has reportedly blocked the line for a distance of about 50 metres. Note the large amounts of water on the surface of the landslide. I’m also interested by the surface water at the crown of the slide. It appears that water has flowed down the track from the top of the image, and there is then a puddle right at the head of the landslide (alongside some inquisitive sheep). Is it possible that water was being fed into the slope at this point, triggering the failure?
The Largs and Millport Weekly News website has a report about this landslide.
The other landslide has occurred on a slope below the railway line. There is a video in a tweet by Network Rail Scotland:-
This is the other landslip we're dealing with, between Ardrossan and West Kilbride. You can see the signalling cable and the troughing which normally holds it suspended in the air.
We'll be speaking to the team who'll reopen the railway again at lunchtime for an update. pic.twitter.com/MAN8cgHBLz
— Network Rail Scotland (@NetworkRailSCOT) February 8, 2021
.
Whilst the track itself has not been lost so far, the signalling cable is damaged and of course there is the possibility of retrogression.
The landslide at Southannan, and the second event shown above, are fixable of course, but they will represent large pieces of work. I would expect that the railway line will be closed for some time.
8 February 2021
The catastrophic landslide and flood in Chamoli in Uttarakhand: the sequence of events
The catastrophic landslide and flood in Chamoli in Uttarakhand: the sequence of events
Deciphering the sequence of events that lead to the terrible debris flow / flood in Chamoli yesterday was quite a challenge, especially on a Sunday. However, a combination of the willingness of a number of people to use their expertise, and the availability of daily satellite imagery from Planet Labs, meant that we had the sequence determined within 8 hours of the event. This is remarkable – the landslide occurred in a very remote location, and the infrastructure was severely damaged. It took us a few days to understand the 2012 Seti landslide in Nepal, which was similar to this one. Now we can do this in a few hours.
So, for clarity, I thought it would be helpful to lay out the sequence events. I am going to lean heavily on Twitter, but these tweets come from a combination of world experts and citizen scientists. I have no doubt that this is the true story of what happened, but there are details to understand still.
1. For a few months a large failure had been developing in the high mountains
Although we did not detect it, high in the mountains at 30.339, 79.731 a large crack was developing on the flank of one of the high peaks over a few months. I believe that this is Trisul, but there is some uncertainty about the names of the peaks. It is now clear that this mountain was Nanda Ghunti. This crack was detected after the event in a sequence of Sentinel satellite images by Julien Seguinot. At the end of the sequence the unstable block is clearly visible:
https://twitter.com/pyjeo/status/1358480152682987523
.
These cracks defined the block that failed.
2. On the morning of 7 February 2021 the block collapsed in an enormous landslide
The failure of this block shows up very clearly in a satellite image collected later in the day by Planet Labs. It was first identified by Dr Dan Shugar:
https://twitter.com/WaterSHEDLab/status/1358437031802593280
.
The best view of this has been provided by Scott Watson:-
3D rendering of @planetlabs image collected 7th Feb showing the source of the Uttarakhand disaster located by @WaterSHEDLab. Appears to be a complete detachment of a previously glaciated slope #Chamoli #Disaster #Landslide pic.twitter.com/SElrZh36kH
— Scott Watson (@CScottWatson) February 7, 2021
.
The 3D diagram shows the events brilliantly. The block of rock, with some ice, dropped from about 5,600 m to about 3,800 m, a fall of almost two kilometres, before impacting on the valley floor. It will have instantly fragmented to generate a huge rock and ice avalanche, which travelled down the glacier. This would have been extremely fast and very energetic. On the way it generated a vast quantity of dust, which is smeared on the valley side to the west of the glacier valley.
The landslide from Trisul that caused the Chamoli debris flow and flood. Image copyright Planet Labs, used with permission.
.
3. The landslide entrained stagnant ice and glacial debris
Down valley (to the north) the rock avalanche was able to entrain a vast amount of water and sediment. The most likely source for this was identified by Matt Westoby:
It's late, and I'm squinting, but looks to be ~3.5km-worth of stagnant glacier/ice-cored moraine downstream of the point where the avalanche hit the valley floor. If so, there's your source of additional water for flow bulking. pic.twitter.com/cuGMRCxXGC
— Matt Westoby (@MattWestoby) February 7, 2021
.
It seems likely that much of this material was the remains of previous landslides and some glacial material. The rock avalanche will have generated a huge amount of heat and will have induced fragmentation. The ice will have been entrained into the flow, crushed and melted, allowing the landslide to transition to a debris flow. The volume will have continued to increase as the landslide rushed to the north.
.
4. The flow followed the valley to the west, and struck the populated areas
The Planet Labs images show that the landslide swung round to the west, and raced down the valley. The Planet Labs image below, taken shortly after, shows the aftermath:-
The area of the landslide downstream from Trisul that caused the Chamoli debris flow and flood. Image copyright Planet Labs, used with permission.
.
Note that dust still in the air when the image was collected.
The movement of the landslide was so rapid that the debris flow pushed water from the river ahead of it before incorporating it. You can see this very clearly in one of the videos:
https://twitter.com/LicypriyaK/status/1358318430940585987
.
Unfortunately there were many people working on the river floor, and in tunnels, as part of the two hydroelectric power schemes in the Chamoli area. This appears to account for the majority of the human losses. Rescue operations continue.
.
Misinformation and conspiracies
Whilst the cause of this event is clearly established, the media is continuing to publish stories that this was a glacial collapse, or an avalanche, or a GLOF. There was real uncertainty at the start, but we have known what happened for 24 hours now. This is quite unfortunate. I hope that this post will set the record straight.
This is important as a set of conspiracies are starting to emerge as to the cause of this landslide. For example, there are suggestions that such an event cannot occur in winter, meaning that it was dynamite that triggered the disaster. Some sources are linking this to activities by China.
This is not the case. This was a classic progressive failure in mountain flank. We have seen similar events elsewhere. It is fair to say though that these events might be increasing in frequency as a result of climate change.
.
Acknowledgement
Planet Team (2021). Planet Application Program Interface: In Space for Life on Earth. San Francisco, CA. https://www.planet.com/
7 February 2021
Chamoli: the catastrophic flood was caused by a landslide
Chamoli: the catastrophic flood was caused by a landslide
I have posted detail of the sequence of events on a new blog post here.
There are a number of posts on Twitter this morning showing the massive, catastrophic flood flood event in the Chamoli area of Uttarakhand in northern India this morning. The videos are terrifying and remarkable – an example is this one:-
https://twitter.com/LicypriyaK/status/1358318430940585987
.
There is uncertainty about the cost of this event, but some reports suggest around 170 people, possibly including about 50 labourers at the construction site of the Rishiganga hydroelectric scheme. There will be huge uncertainty in this figure; hopefully it will reduce.
There is increasing clarity about the events at Chamoli. There are a number of reports that the HEP scheme at Tapovan has been swept away (this may be the site in the video in the tweet above), and also that the landslide affected the village of Raini. The Google Earth image below shows these two locations:-
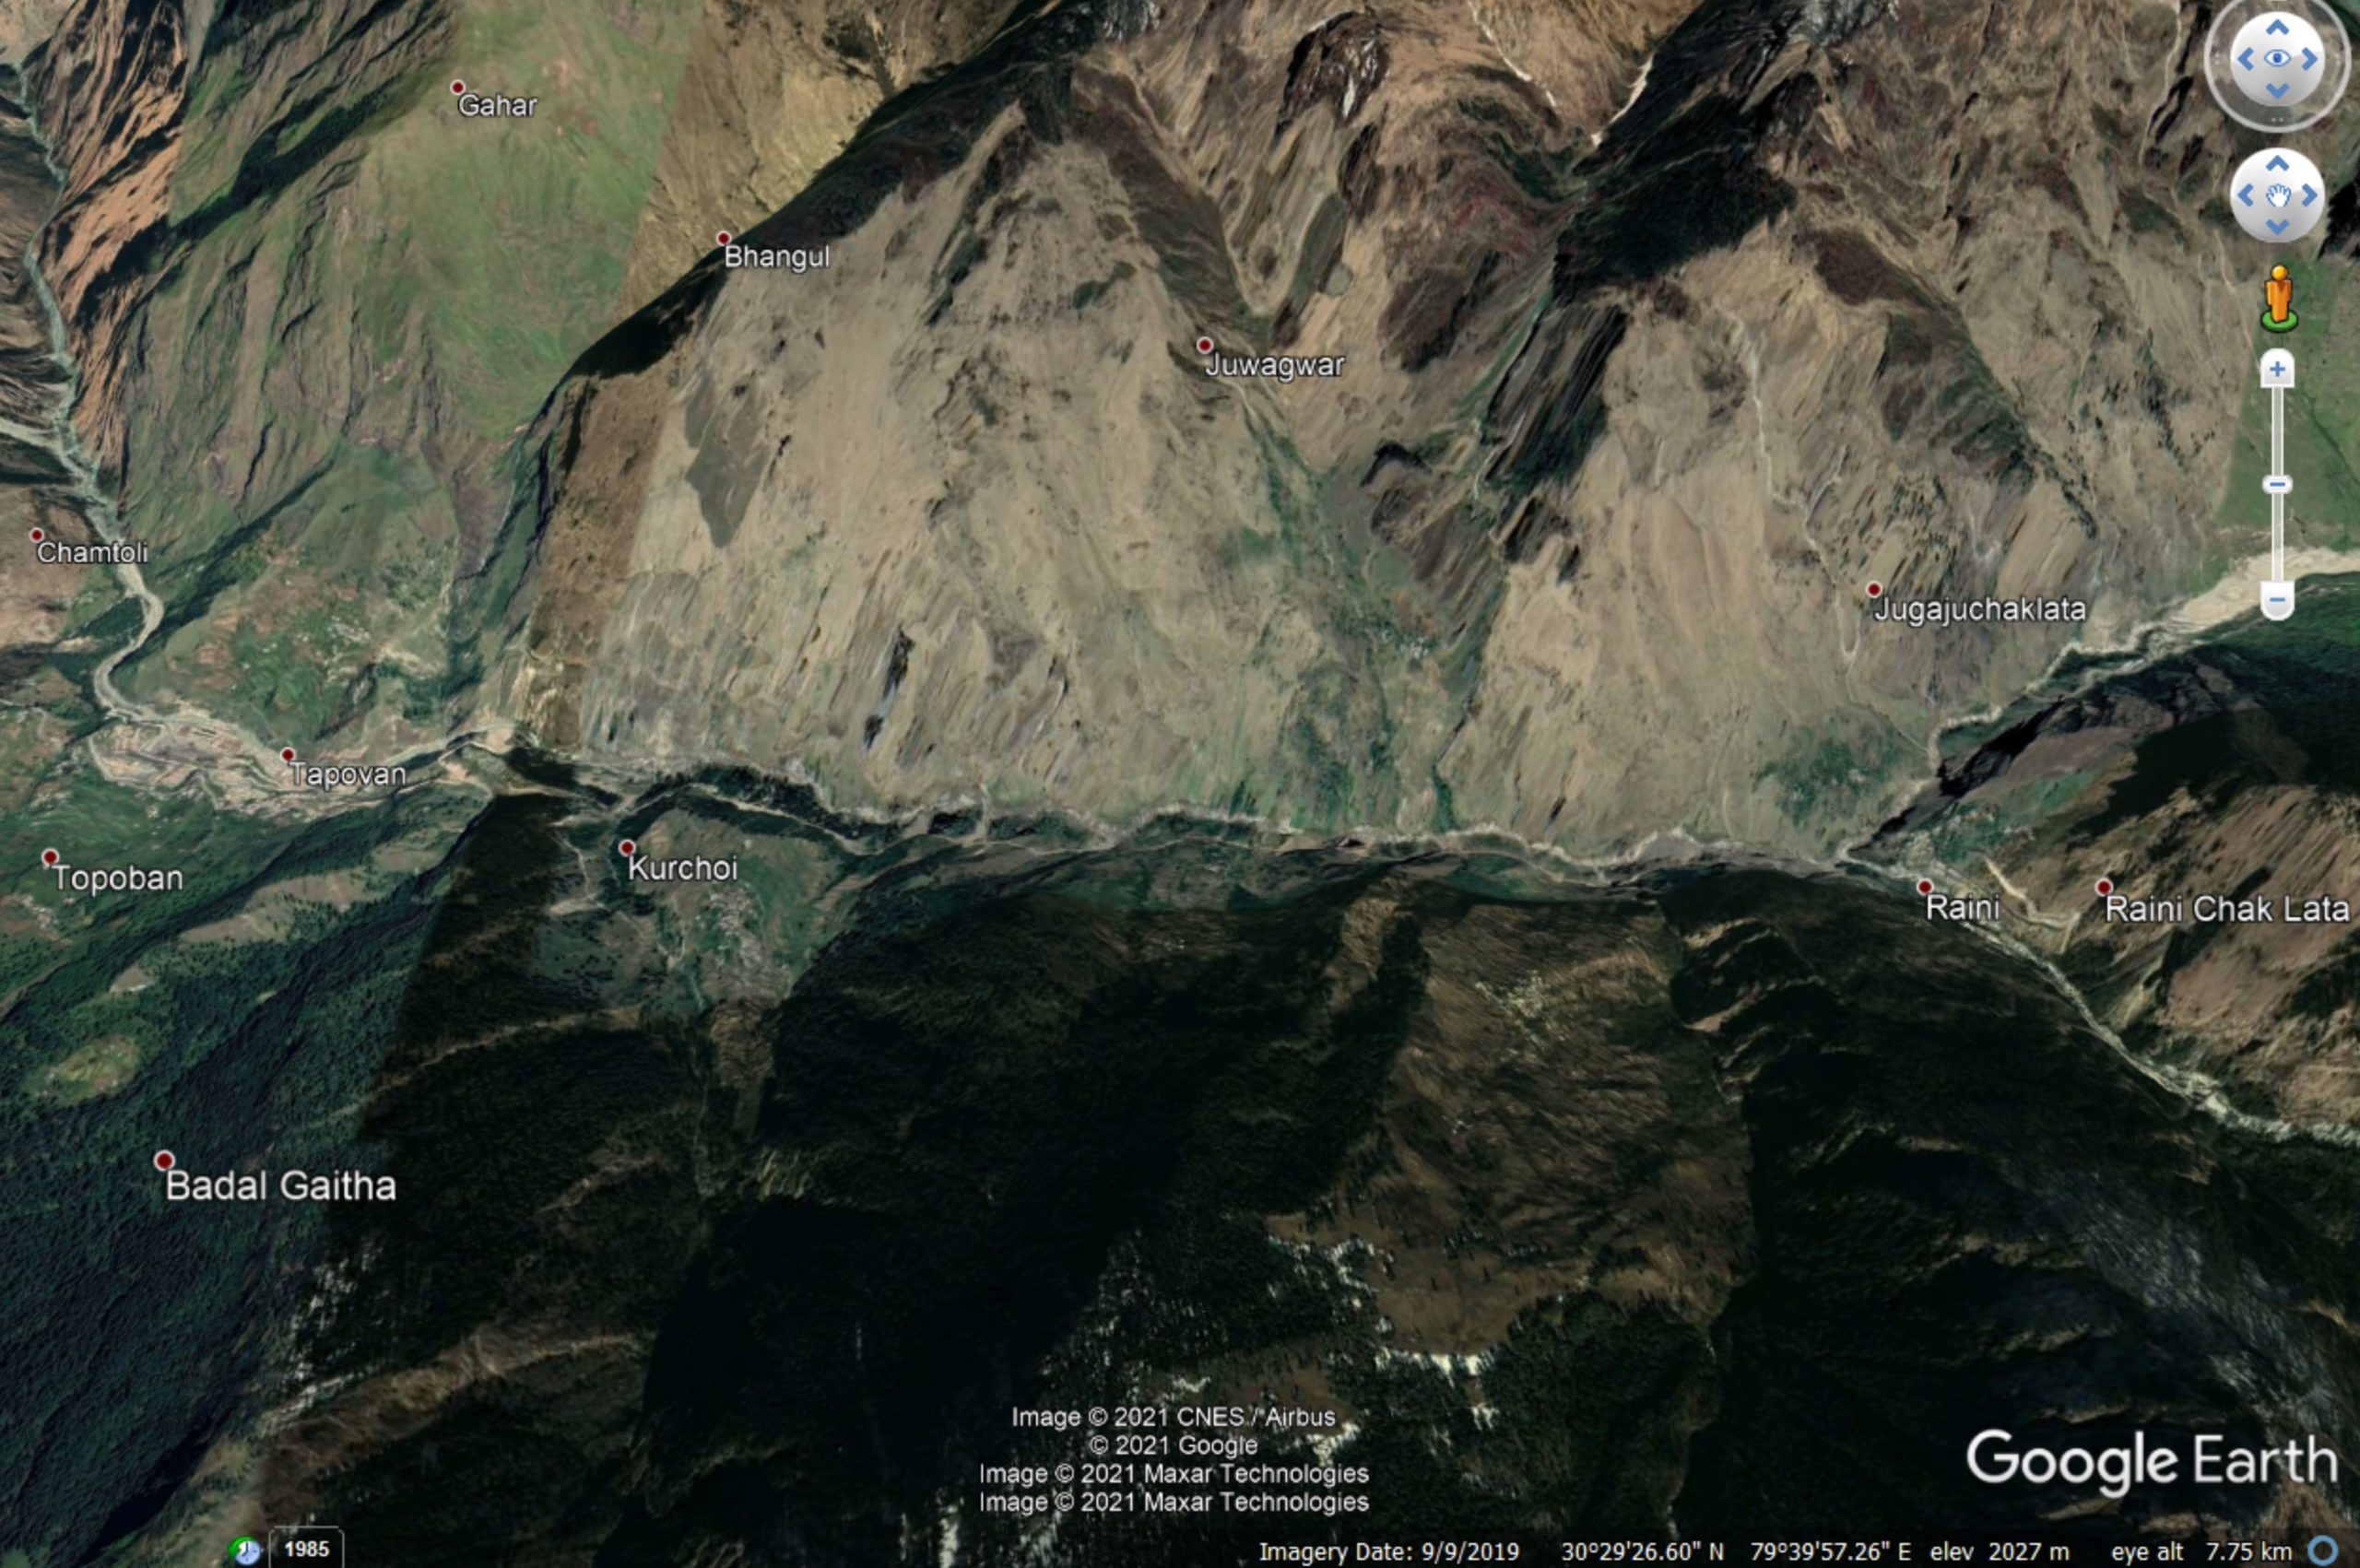
Google Earth image of the area affected by the catastrophic flood at Chamoli.
.
The question as to the cause of this event has been solved by the availability of a Planet Labs image collected today (7 February 2021). Dr Dan Shugar of the University of Calgary was the first person to deduce from this that the cause of the disaster was a landslide. This image shows the source of the disaster – it a large rockslope detachment from Trishuli, The scar is the dark area just below the centre of the image. It has moved northwards onto the glacier, and turned into a rock and ice avalanche that has moved toward the northwest. Note the huge amounts of dust that has been left by the landslide:
The landslide from Trishuli that caused the Chamoli flood. Image copyright Planet Labs, used with permission.
.
The Planet Labs imagery shows the impact of this event downstream. To the north of the image above there is still a vast amount of dust in the air:-
The area of the landslide downstream from Trishuli that caused the Chamoli flood. Image copyright Planet Labs, used with permission.
.
The valley with the road marked is the one containing Raini (located where steep bends are seen in the east) and Tapovan, as shown in the first image in this post.
In many ways this event is similar to the 2012 Seti River flood in Nepal. That was also triggered by a giant rockslope failure, from the Annapurna massif, which transitioned into a catastrophic flood.
Hopefully we will get further images soon of the upstream areas to understand this event (and of course to determine the risk of another event), but it is now clear that this was a landslide. In the meantime, rescue operations are underway. Reports suggest about 10 bodies have been recovered.
.
I have posted detail of the sequence of events on a new blog post here.
Reference
Planet Team (2020). Planet Application Program Interface: In Space for Life on Earth. San Francisco, CA. https://www.planet.com/
5 February 2021
Planet Labs high resolution satellite image of the Rat Creek Washout
Planet Labs high resolution satellite image of the Rat Creek Washout
Planet Labs has once again very kindly captured a high resolution satellite image for this blog – as ever I am really appreciative of the help that they provide. On this occasion they have imaged the Rat Creek Washout in the Big Sur in California, which was caused by intense rainfall onto a post-wildfire area. The washout has closed the main coastal route.
This is the very beautiful Planet Labs SkySat image that shows the washout:-
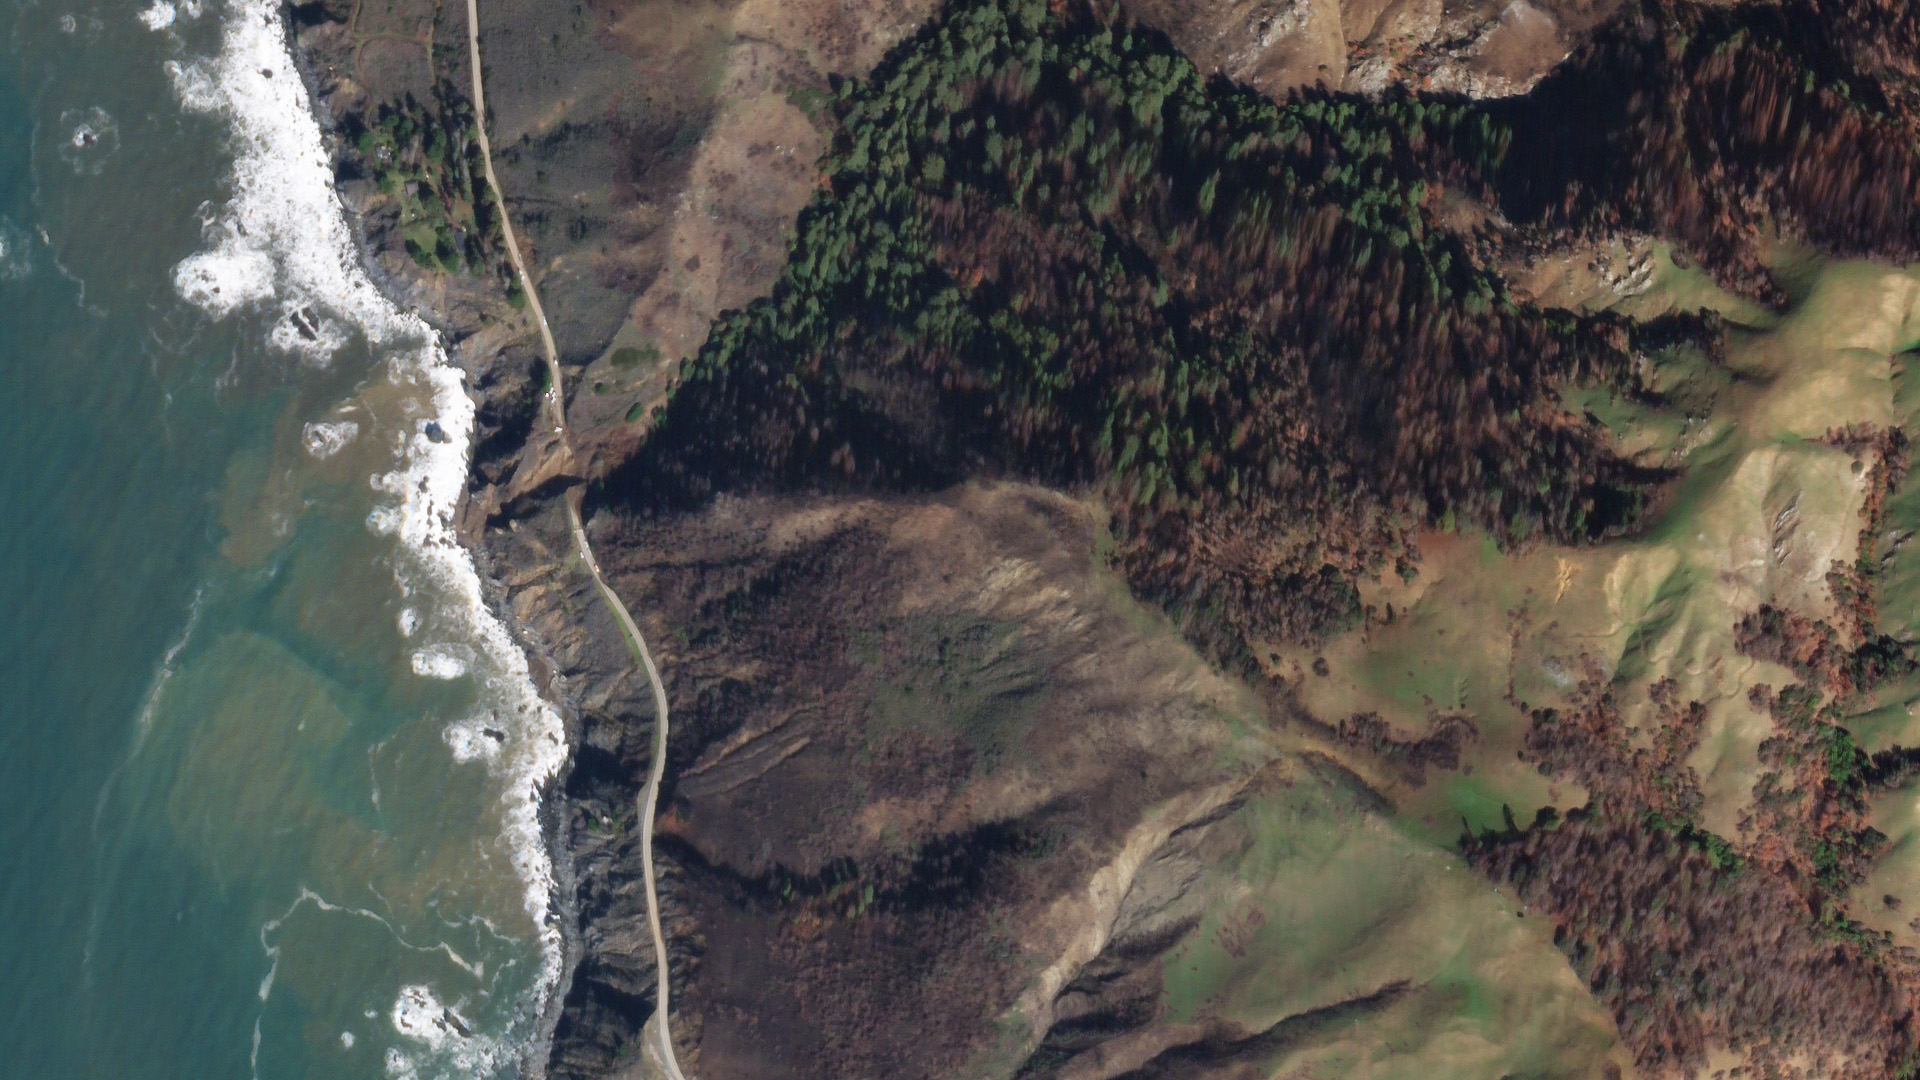
The Rat Creek Washout as imaged by Planet Labs. Planet Labs SkySat image, captured on 3 February 2021. Image copyright Planet Labs, used with permission.
.
The image captures the scale of the Rat Creek Washout, and illustrates the challenges of making this site safe. The complex pattern of burnt trees in the catchment is clear, with areas of burnt land coming close to the road. Note also the multiple shallow landslides in the landscape, especially on the coastal slopes, but also in the inland catchments. There are also some relict larger and deeper landslides as well.
This pattern is even more clear in an image that captures a larger part of the catchment:-
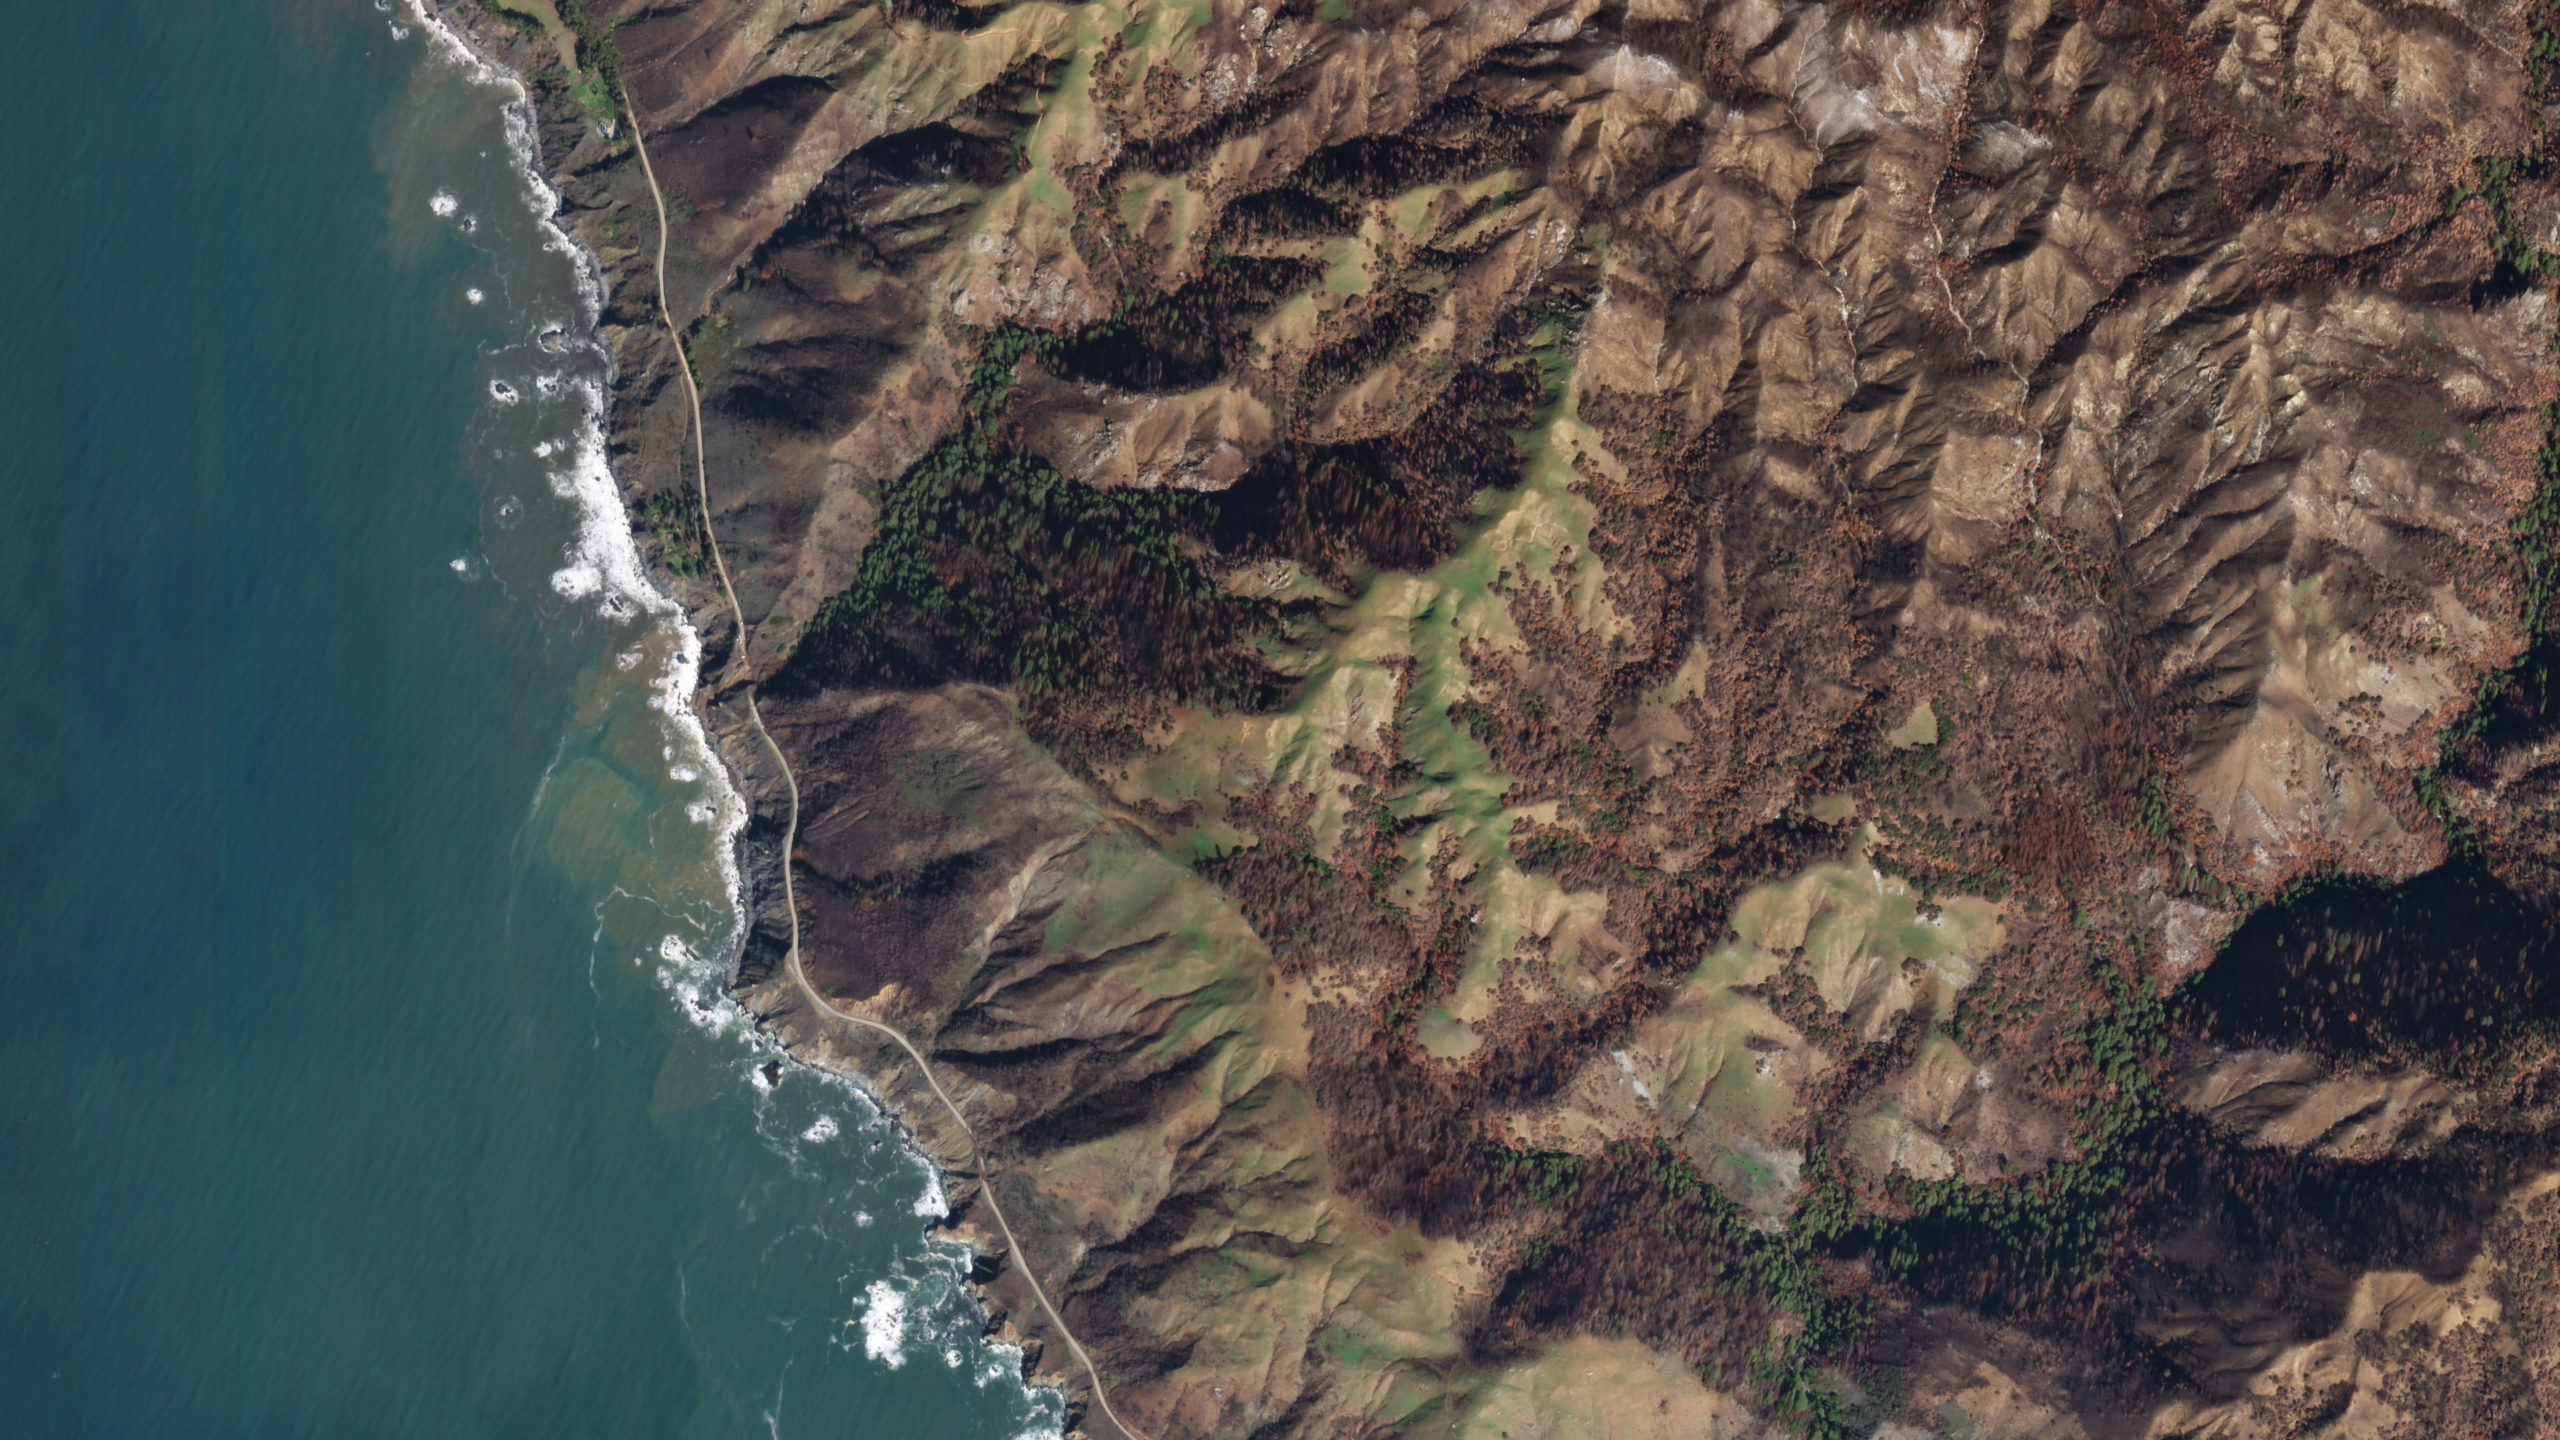
The watershed upstream of the Rat Creek Washout as imaged by Planet Labs. Planet Labs SkySat image, captured on 3 February 2021. Image copyright Planet Labs, used with permission.
.
The enormous area devastated by the 2020 wildfires is very clear in this image. Alongside other catchments, the one upstream of the washout is extensively burnt. It is no surprise that problems are developing in these areas.
According to KSBY, this event was the worst of many problems on State Highway 1:
That wasn’t the only place along the highway that suffered damage. Approximately 60 locations north and south of Rat Creek were affected by debris flows, slides, and flooding. Caltrans says road crews have been working from the north and the south to clear and repair drainage systems and stabilize damaged sections of the road.
The Planet Labs image appears to capture one of these areas, to the south of the washout:-
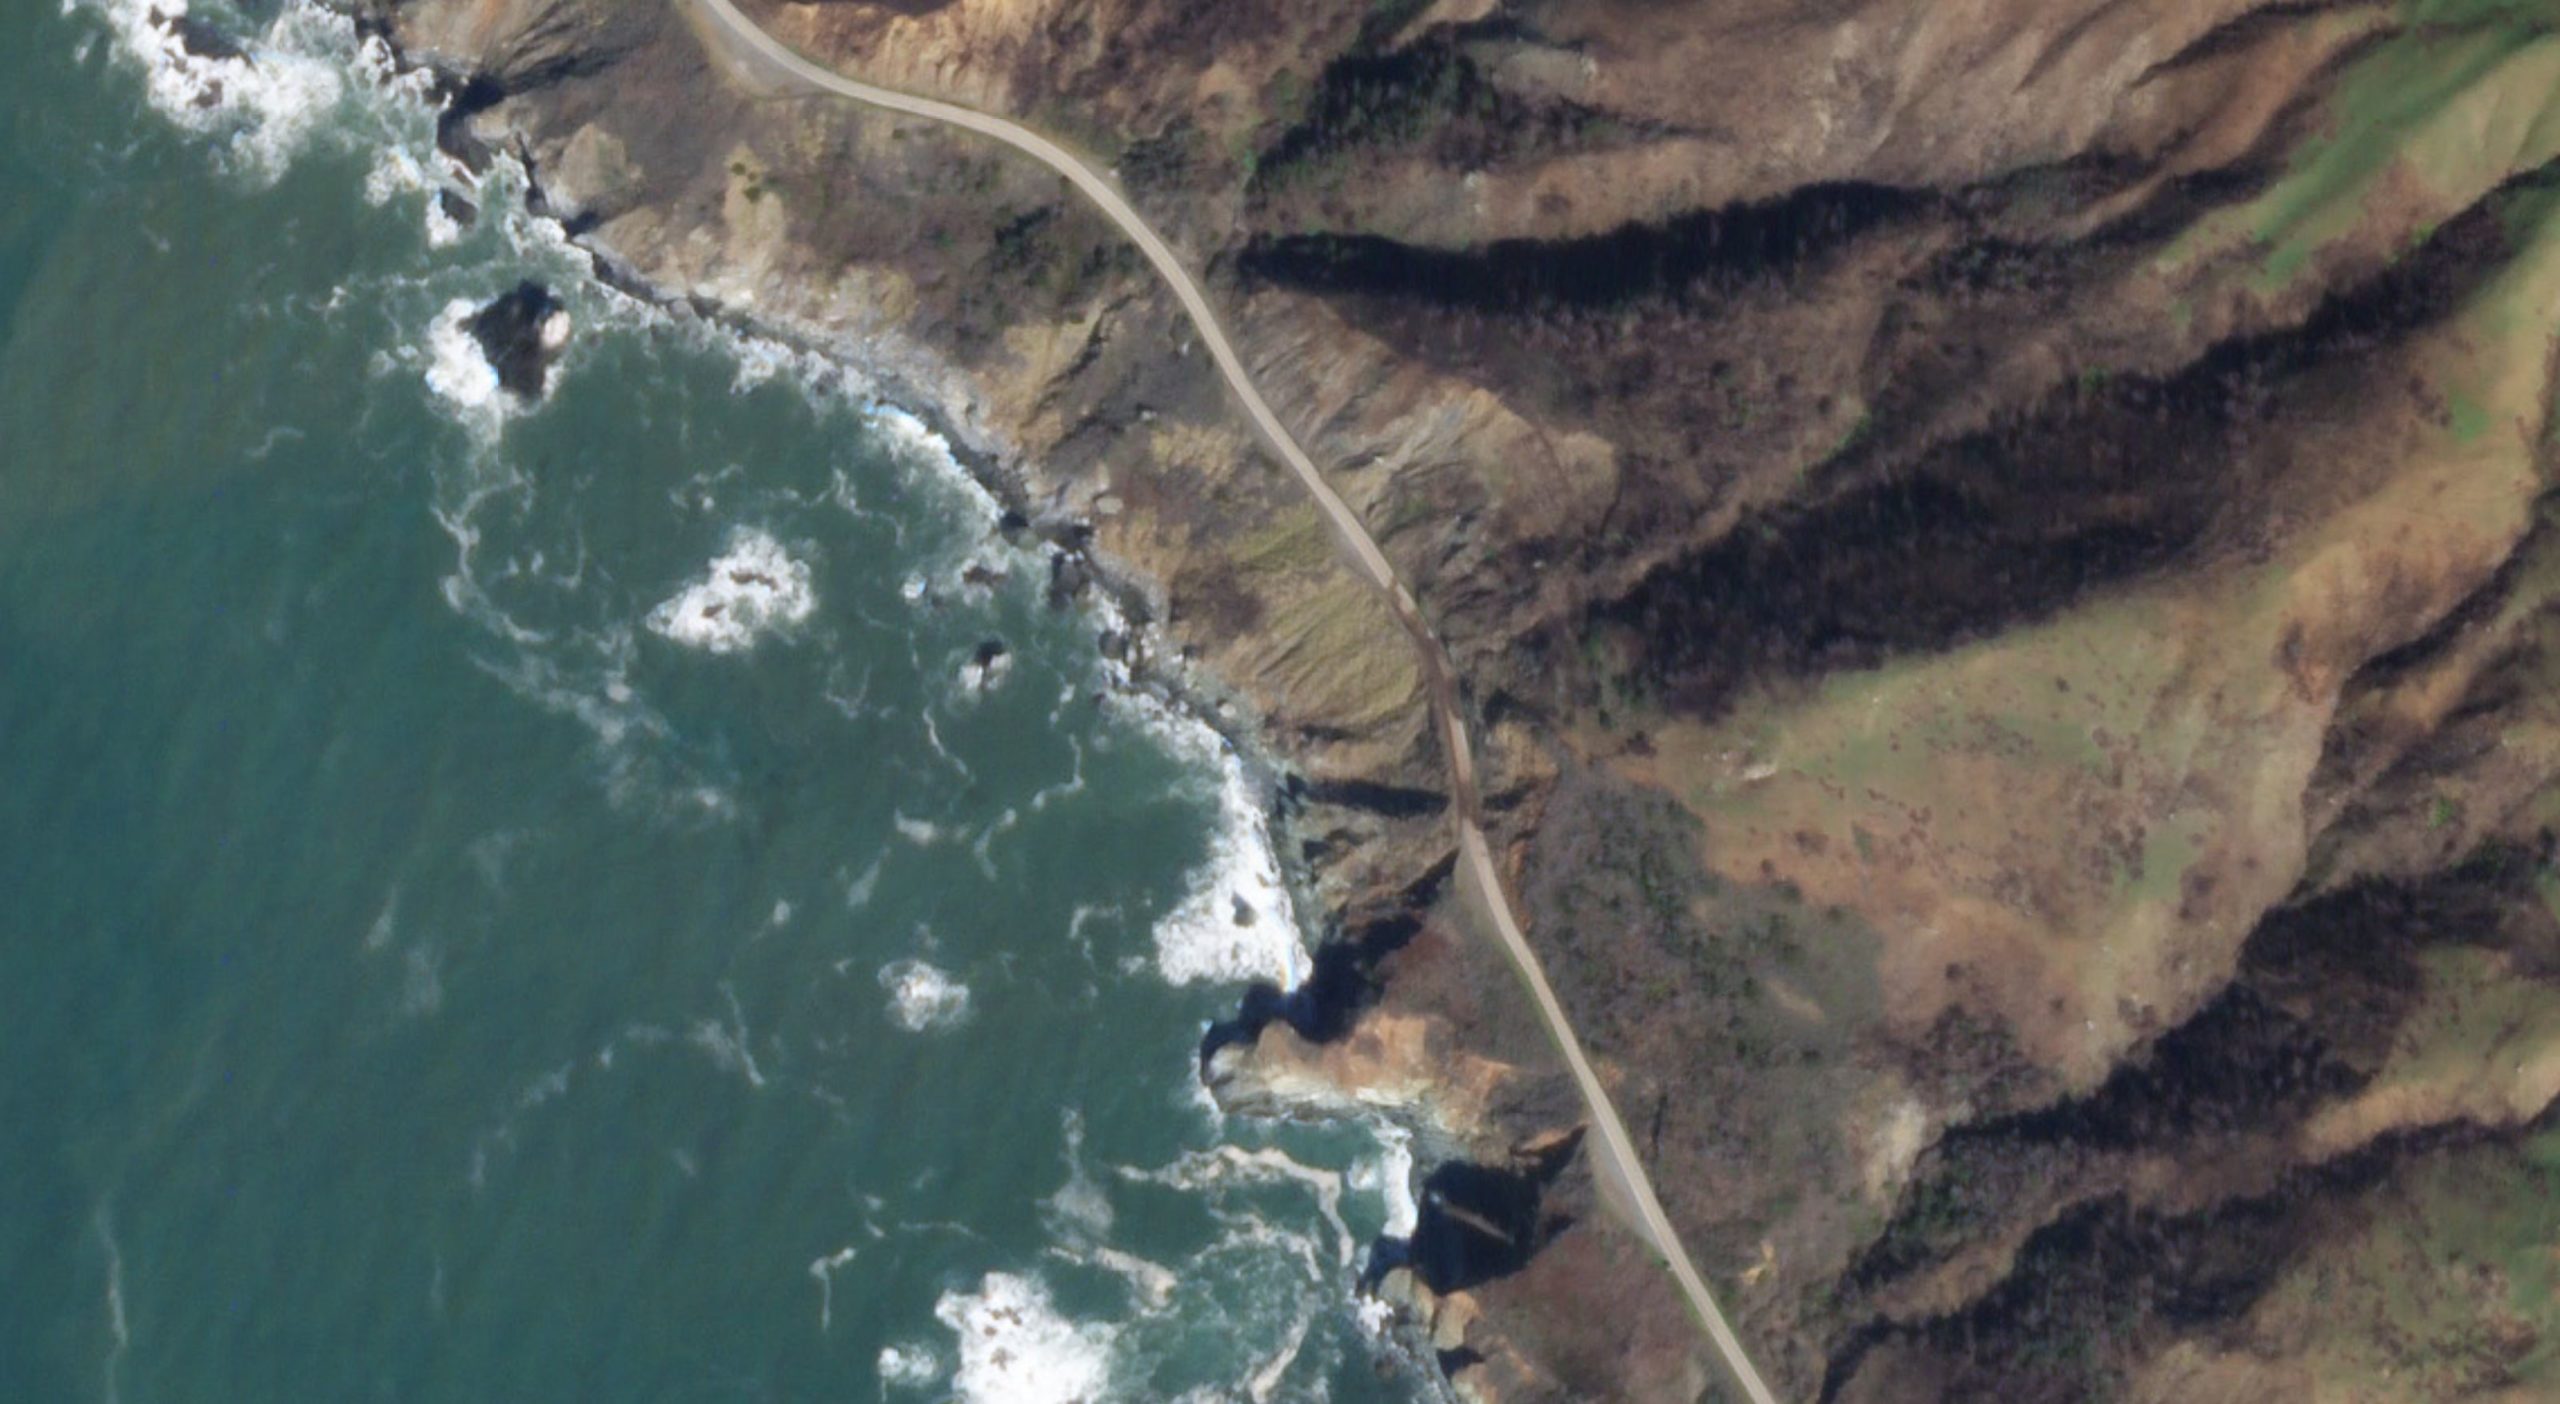
State Highway 1 damage as imaged by Planet Labs. Planet Labs SkySat image, captured on 3 February 2021. Image copyright Planet Labs, used with permission.
.
Reference
Planet Team (2020). Planet Application Program Interface: In Space for Life on Earth. San Francisco, CA. https://www.planet.com/
 Dave Petley is the Vice-Chancellor of the University of Hull in the United Kingdom. His blog provides commentary and analysis of landslide events occurring worldwide, including the landslides themselves, latest research, and conferences and meetings.
Recent Comments