
20 November 2013
Landslides and large dams – the presentation file and full paper from my talk at the Vajont 2013 conference
Posted by Dave Petley
A little over a month ago I gave a talk at the Vajont 2013 conference on the topic of landslides and large dams. At the time I committed to making the Powerpoint file available online, so here it is:
..
The file is located on slideshare – you should be able to download the powerpoint file from there. The piece is also written up in an article for the conference paper – reference below. The paper can be accessed, for free, from the conference website. The other talks and papers can also be accessed from the conference website.
In this work I looked at the Durham Fatal Landslide Database to try to understand fatality-inducing landslides associated with large dams over the last decade. My analysis of the dataset suggested that in total there were exactly 500 deaths in 37 landslide events in the ten years between 2003 and 2012. Surprisingly, with one exception these were not landslides associated with the collapse of reservoir flanks (although interesting there was an event of this type in China earlier this year). Most of the landslides were either failures at the construction sites of large dams or at the sites of workers camps.
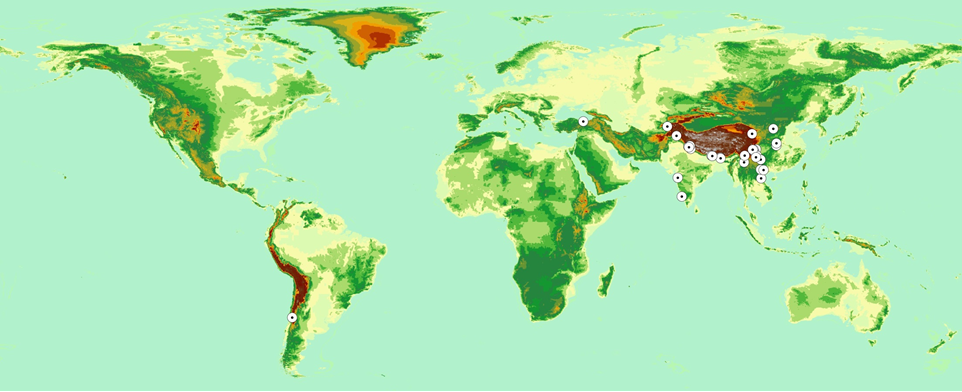
The most interesting aspect of this analysis though is that the geographic distribution of the landslides is surprisingly uneven. This is a map showing the location of each of the landslide events – the background image is a digital elevation model:
..
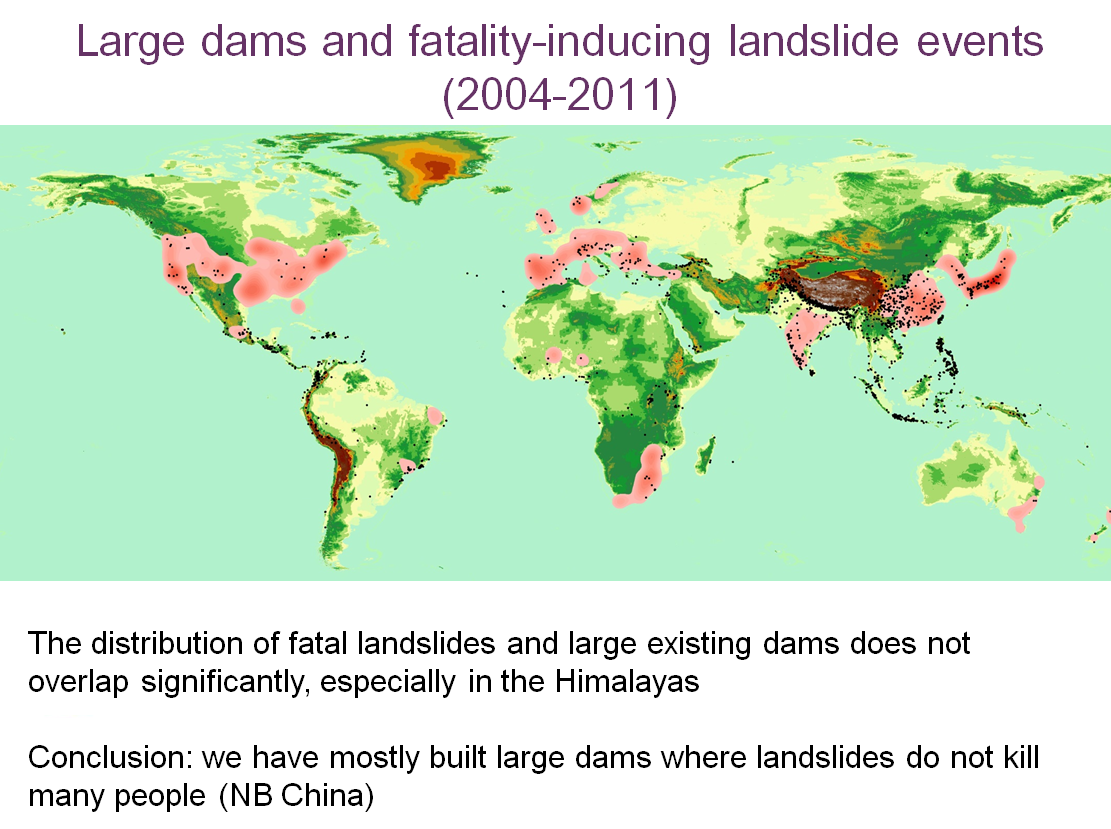
You will see that the landslides are incredibly concentrated in Asia, and in particular in India and China. Indeed, 16 of the landslides occurred in China and nine in India, so this is a problem that is concentrated in these areas. Whilst this level of loss is in itself tragic of course, it is important to understand why this level of loss is occurring. The key slide is I think the one below, which shows two things. The shaded area is a density map of the distribution of large dams around the world, taken from the UN Large Dam Database. The black dots represent the distribution of landslides that have killed people around the worls in the period 2004-2012. The two together suggest that until now, and with the xception of Japan (where construction standards are extremely high), we have tended not to build large dams in places where landslides kill large numbers of people:
..
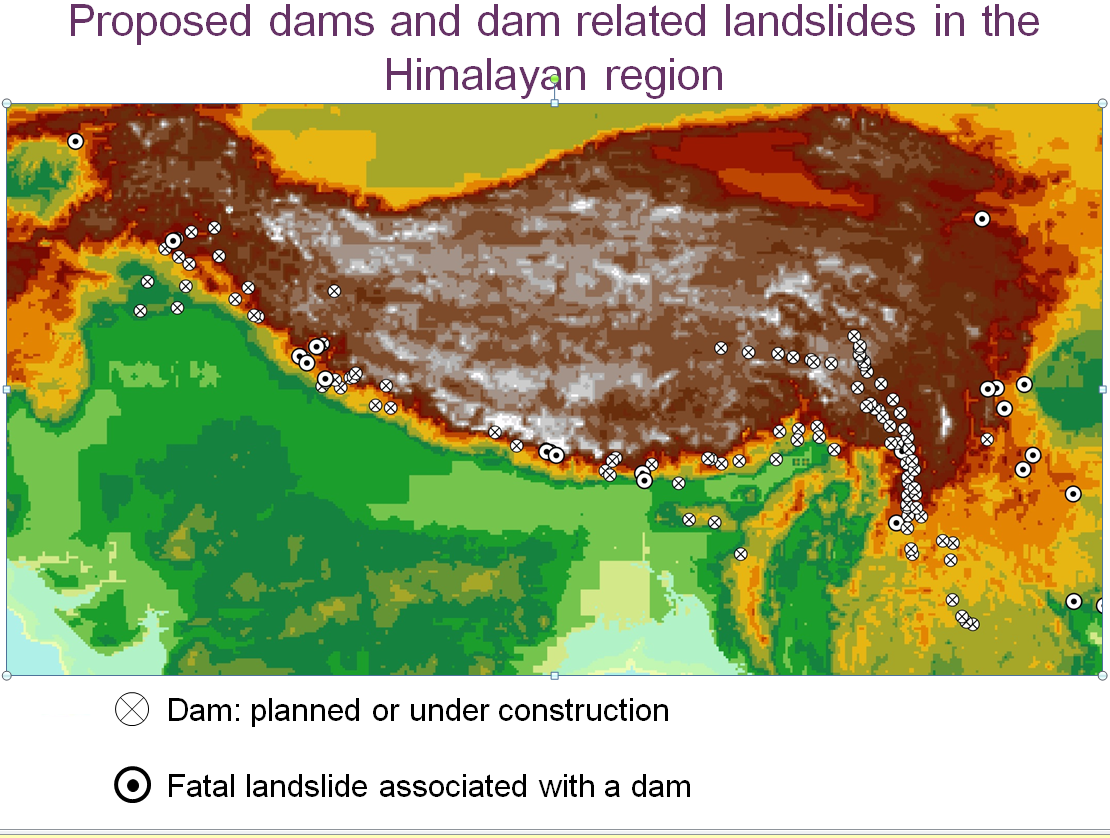
This is now changing as a huge new wave of dams is being constructed in the Himalayas in particular, which as the slide above shows, is very highly landslide-prone. The slide below shows the distribution of planned and under-construction dams, together with the dam-related, fatality-inducing landslide events that have already in this region:
..
My suggestion is that we, as we build dams in areas that are much more geologically-unstable the challenge of landslides becomes much more acute. The data above suggest that the hazards are not being managed adequately. This is a stark warning for the future – with the level of dam buiding in high mountain areas likely to increase in the coming years, as the map above shows, dam-related landslides are likely to become a greater problem. We have not had a repeat of the Vajont event for 50 years; I wonder if we will e able to still say that in 50 years time. There are of course other indications that we are not managing these types of dam-related slopes very well in high mountain areas.
Reference
Petley, D. 2013. Global losses from landslides associated with dams and reservoirs. In: Genevois, R. and Prestininzi, A. (eds) International Conference on Vajont – 1963-2013. Thoughts and analyses after 50 years since the catastrophic landslide, pp 63-72.
 Dave Petley is the Vice-Chancellor of the University of Hull in the United Kingdom. His blog provides commentary and analysis of landslide events occurring worldwide, including the landslides themselves, latest research, and conferences and meetings.