
12 October 2021
A large rock slope collapse from Punta dei Ross, Croda Marcora in the Italian Dolomites
A large rock slope collapse from Punta dei Ross, Croda Marcora in the Italian Dolomites
On 9 October 2021 a large rock slope collapse occurred on the Punta dei Ross, Croda Marcora in the Dolomites of northern Italy. The failure was captured on a series of videos that have been posted online.
Probably the best video of a part of the failure process has been captured by Emanele Compagno and posted to Youtube. The really interesting part of the video starts at the 38 second mark:
.
A very nice compilation of other videos has been created the Vacanze Dolimiti website, and posted to Youtube:
.
The videos appear to show a major collapse that initiates near to the ridge line. As is often the case for large rock slope failures, it occurs in a series of collapses rather than in a single failure event. One of the videos shows the collapse of a pinnacle, but the fresh scar and presence of dust shows that this was not the first failure:-
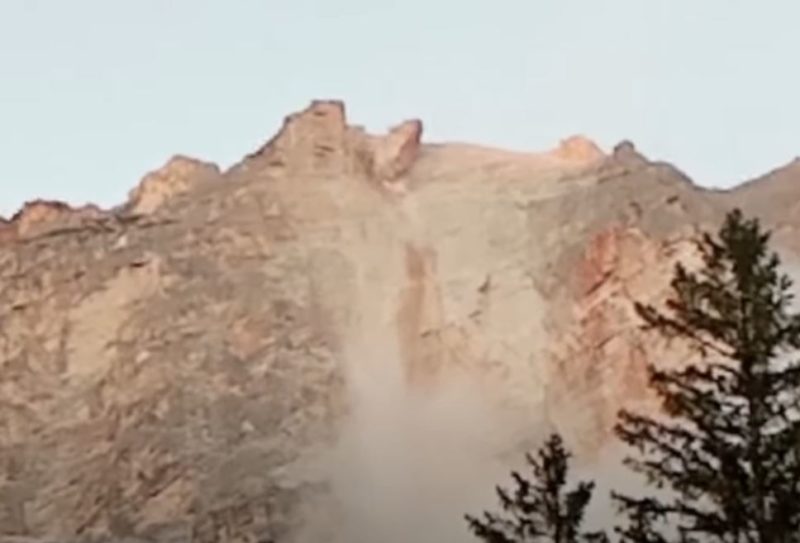
A part of the collapse of the 9 October 2021 Punta dei Ross, Croda Marcora in the Italian Dolomites. Still from a video posted to Youtube.
.
It appears that after collapse the debris has gone through a near freefall stage and then transitioned into a rockslide or a rock avalanche.
Jan Beutel of the University of Innsbruck has tweeted about the event:
Spectacular 50'000m^3 #rockfall just outside Cortina d'Ampezzo at Croda Marcora, San Vito di Cadore on October 9, 2021.https://t.co/wlwIyeSxLh
Local news are doing a great job with coverage of the developments https://t.co/olNtZUzkYN
[1/3]— Jan Beutel (@jan_beutel) October 11, 2021
.
At altitude, refreezing of the #permafrost active layer just started. At #Matterhorn just slightly higher have just past the days with the highest displacement rates. Red in this plot means ~3cm/month in solid bedrock!https://t.co/xzNDiqq0U4 @uniinnsbruck @SLFDavos @ETH_en pic.twitter.com/UpWKA72meH
— Jan Beutel (@jan_beutel) October 11, 2021
.
The timing of the collapse is interesting, occurring as the temperatures are falling after the summer.
11 October 2021
An updated landslide inventory map for Attica Region in Greece
An updated landslide inventory map for Attica Region in Greece
Guest post by Nikolaos Tavoularis, Engineering Geologist at NTUA, Greece
A new web GIS platform has been recently constructed for the Attica region in Greece, whose importance is increasing after the recent mega-fires that happened in north and western Attica county in the the first days of August 2021. This platform is going to be the basis upon which hazard and risk maps will generated for the area based upon dynamic trigger factors such earthquakes and rainfall. Attica region is a territory of 3810 square kilometres, in which almost half of the Greek population and more than 60% of the industrial production in Greece and high value properties and infrastructure is concentrated (Figure 1).
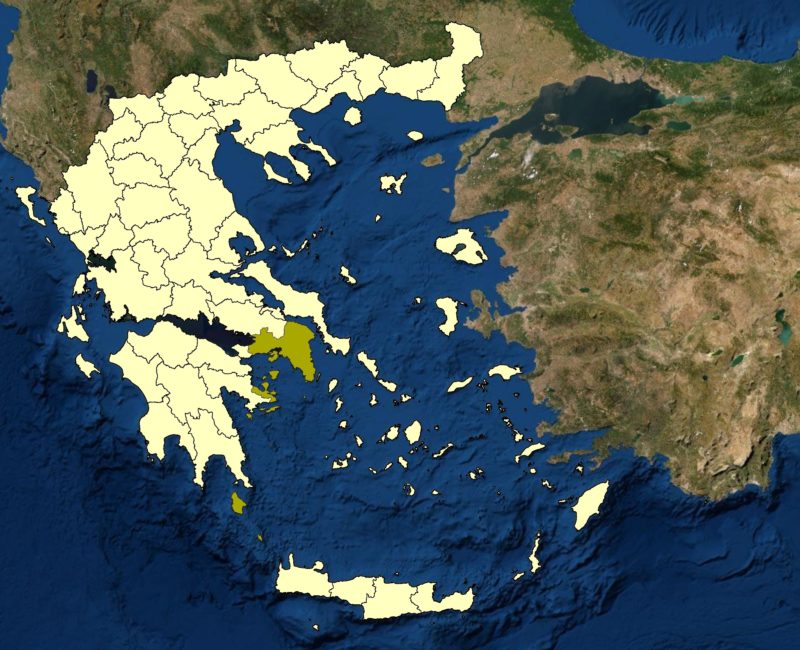
Figure 1: Map showing the location of the Attica region (Green) in Greece (yellow).
.
The cartographic products, as well as the GIS platform, will be used by civil protection agencies, public works authorities, planners, civil engineers, and researchers in landslides for urban planning and designing mitigation measures against potential slope failures caused by fires, floods and earthquakes (Figure 2).
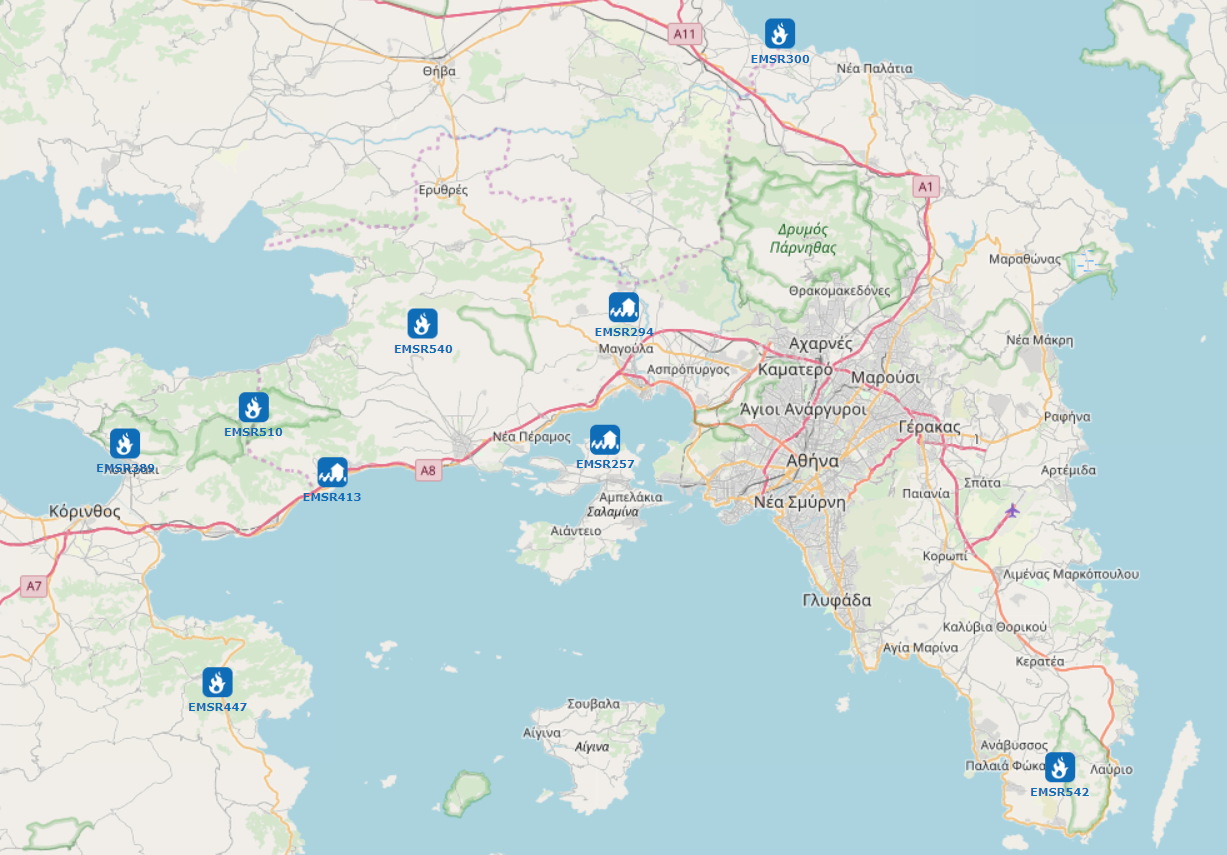
Figure 2. Floods and fires (which can be related to potential slope failures) that have occurred over the last three years in the Attica Region (Copernicus – Emergency Management Service – Mapping, 2021). The figure has been taken from Map of EMS Rapid Mapping Activations | COPERNICUS EMERGENCY MANAGEMENT SERVICE.
.
For the time being, the landslide inventory and the resultant susceptibility map (depicted in a 1:100.000 regional scale in Figure 3) of the Attica Region has been generated. The research project, named DIAS, which was co-financed by Greece and the European Union (European Social Fund – ESF), covers a chronological period from 1961 up to 2020.
The identified slope failures were stored in a GIS database as spatial and tabular data, including information per slope failure such as: (i) geographic details, (ii) lithological composition – active faults, (iii) mass movement date – field survey date, (iv) type of movement, (v) triggering factor, (vi) landslide causes, based on Working Party on World Landslide Inventory (1990) findings.
Given that over the next five to ten years, very important civil engineering projects will be constructed in Attica county, the existence of a regional-scale landslide susceptibility map could be a very useful tool for supporting decisions in order to prevent the location of high-value constructions in unsuitable locations.
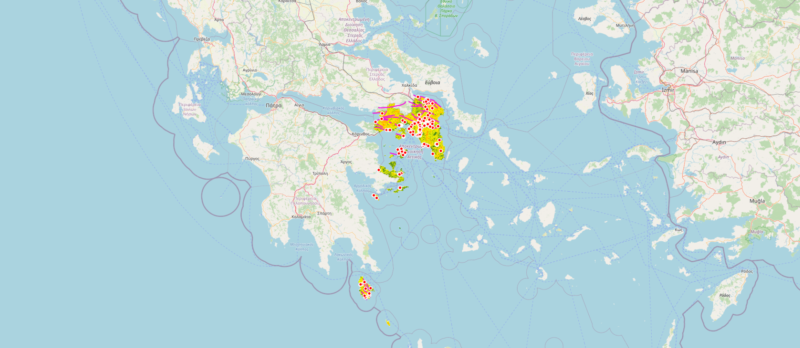
Figure 3. An excerpt from the landslide WebGIS platform for Attica Region, Greece.
.
This work has been undertaken under the auspices of Democritus University of Thrace, Civil Engineering Department and the fruitful co-operation with George Papathanasiou (Associate Professor of Democritus University), Athanasios Ganas (Researcher at National Observatory of Athens, Institute of Geodynamics) and Panagiotis Argyrakis (Researcher from Peloponnese University).
Additionally, characteristic slope failures from this research were presented at the Safe Greece 2020 on-line conference, which took place on 14-16 October 2020 in Athens.
8 October 2021
Multiple landslides in Þingeyjarsveit and in Kinnarfjöll in Iceland
Multiple landslides in Þingeyjarsveit and in Kinnarfjöll in Iceland
In recent days heavy rainfall has triggered multiple landslides in Iceland, at Þingeyjarsveit and in Kinnarfjöll. These are two settlements within 10 km of each other in the northern part of central Iceland. Fortunately there have been no casualties, but some houses needed to be evacuated to manage the risk.
At Þingeyjarsveit, a series of large failures occurred. The best image that I have seem that illustrates these landslides was published on mbl.is:-
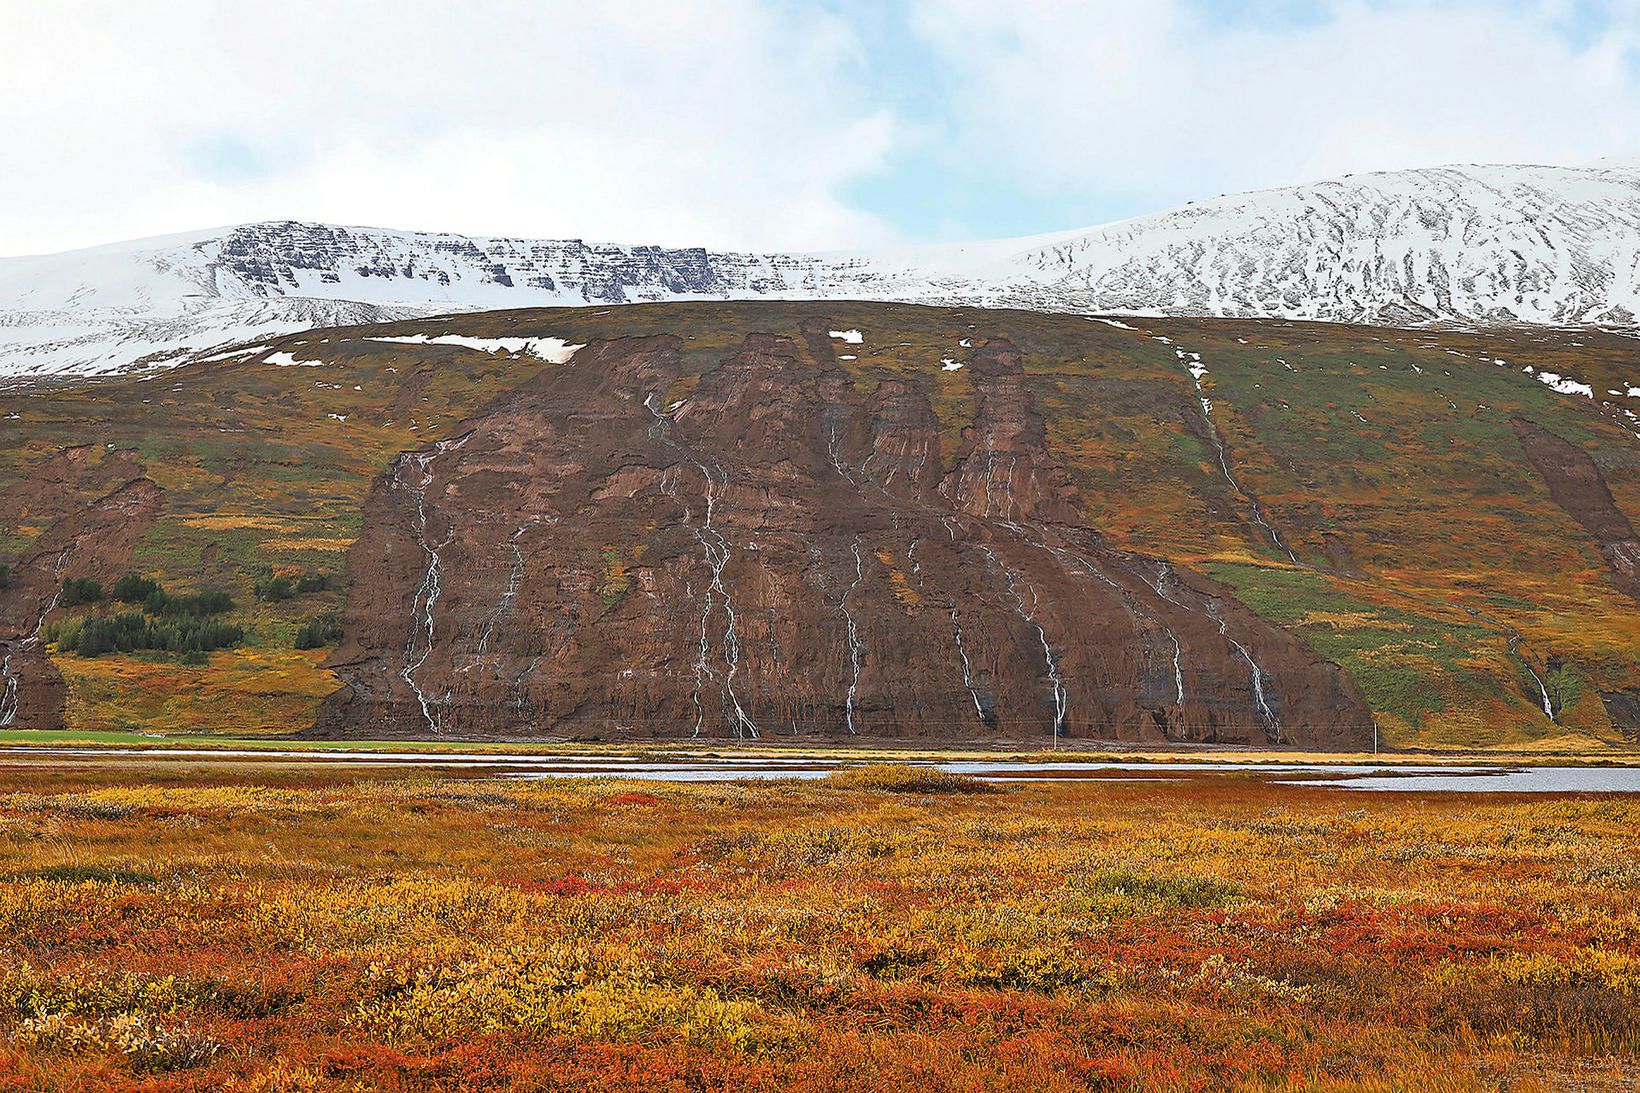
The coalescence of multiple shallow landslides at Þingeyjarsveit in Iceland. Image by mbl.is/Hafþór Hreiðarsson.
.
This is an interesting set of landslides, apparently resulting from multiple shallow slips high on the slope. These have combined to generate a large scale open hillslope flow in which there has been entrainment of material. Such landslides are usually caused by a loss of suction forces and / or high pore water pressures as a result of high intensity rainfall.
Note that this main complex is not the only landslide – there are further slips on each side of the image.
.
This landslide, from the video, is something of a classic:
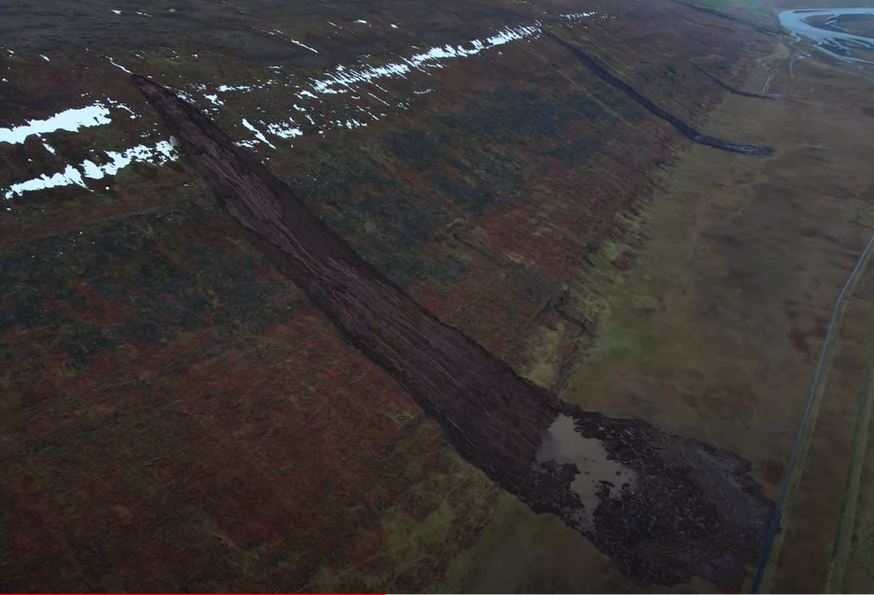
One of the landslides at Þingeyjarsveit in Iceland. Image from a drone video uploaded to Youtube by Íslandsrásin.
.
At Kinnarfjöll there were further multiple landslides. mbl.is has a rather spectacular image of these landslides as well:
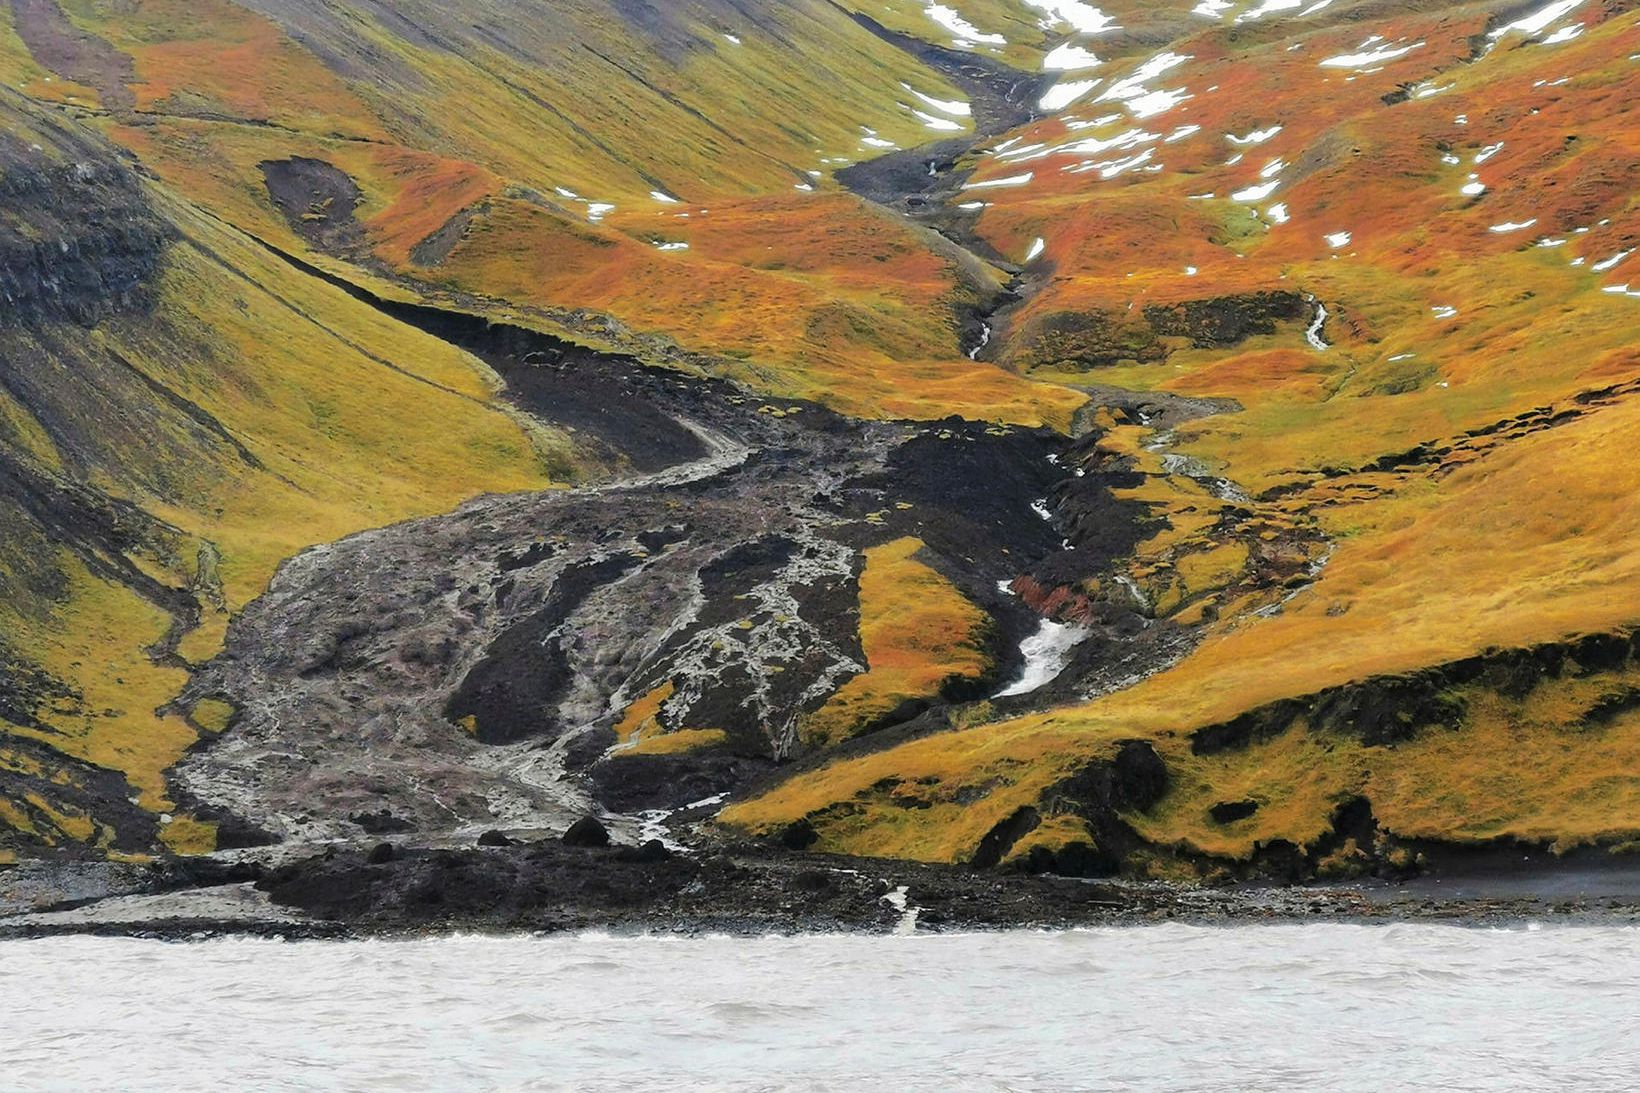
Some of the landslides at Kinnarfjöll in Iceland. Image by Sverrir Yngvi Karlsson via mbl.is.
.
The two main landslides in this image appear to be channelised flows with a great deal of entrainment of material. The lower failure has flowed out of the channel. Note that the soil and debris is very black – this may indicate volcanic materials. There are other, different, landslides present too – for example, there is a shallow failure with a debris trail in the top left of the image and a disrupted translational slide in the middle right.
These landslides are worthy of a detailed investigation.
6 October 2021
Heishui: a rockslide at a tunnel portal in Sichuan Province, China
Heishui: a rockslide at a tunnel portal in Sichuan Province, China
Loyal reader Mark Shore has kindly highlighted an interesting rockslide that was caught on video in Heishui County, in Sichuan Province in China. The landslide apparently occurred on 30 September 2021. The two tweets below capture the event:-
https://twitter.com/timbaland57/status/1443838235327803399
.
https://twitter.com/meteoredit/status/1444006701145993219
.
Whilst the video below captures the aftermath and, at the end, some further landslide activity:
https://www.youtube.com/watch?v=FDTO267hSJo
.
Clearly this type of event is exceptionally dangerous – it is perhaps surprising that there is no apparent landslide mitigation on the slope or around the portal given the obvious potential for rockslides at this site. According to a report in NTDTV.com, in Mandarin, the landslide occurred at 9:20 am at the entrance of the Xi’er Tunnel of National Highway 347 in Heishui County, Aba Prefecture, Sichuan. There were no casualties, but a transformer and a car were damaged.
Some reports suggest that an accident was avoided because a security officer at the site raised the alarm.
Mark has identified the likely location for the landslide, which is at 32.080° N, 103.181° E:-
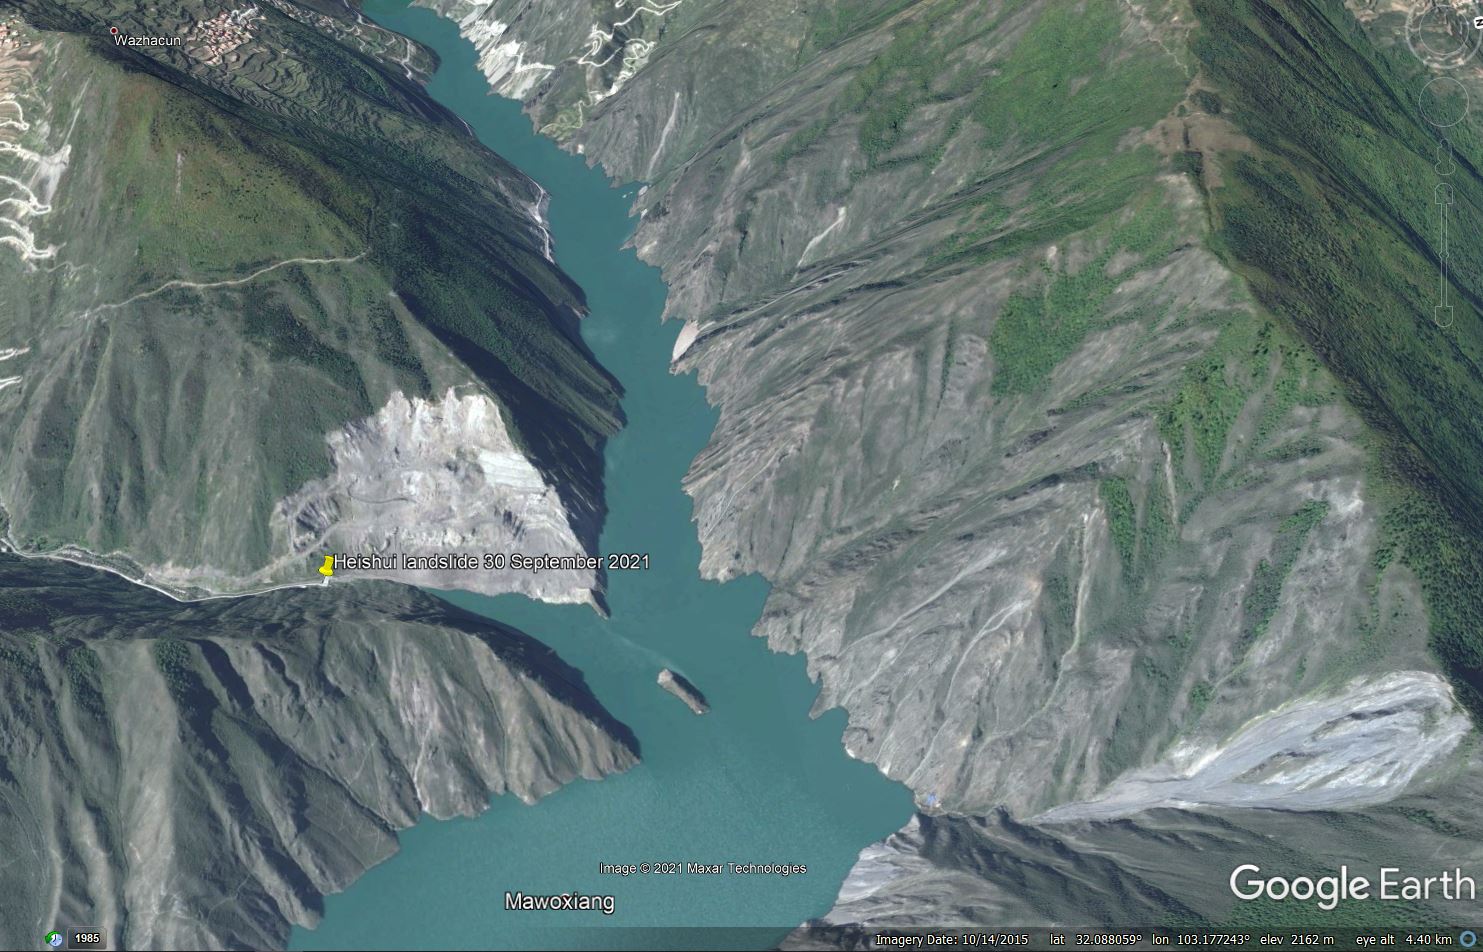
Google Earth image of the location of the 30 September 2021 rockslide at Heishui in Sichuan Province, China.
.
Clearly this is a location with a high incidence of landslides, but it seems like that the slope above the tunnel portal shown in the Google Earth image has been quarried.
5 October 2021
A significant landslide near to the water supply pipeline for Gisborne in New Zealand
A significant landslide near to the water supply pipeline for Gisborne in New Zealand
Loyal reader Dr Murry Cave of Gisborne District Council has kindly highlighted an interesting landslide, close to the water supply pipeline for the city of Gisborne in New Zealand. The image below, provided by Murry, shows the landslide, which occurred on 27-28 September 2021:
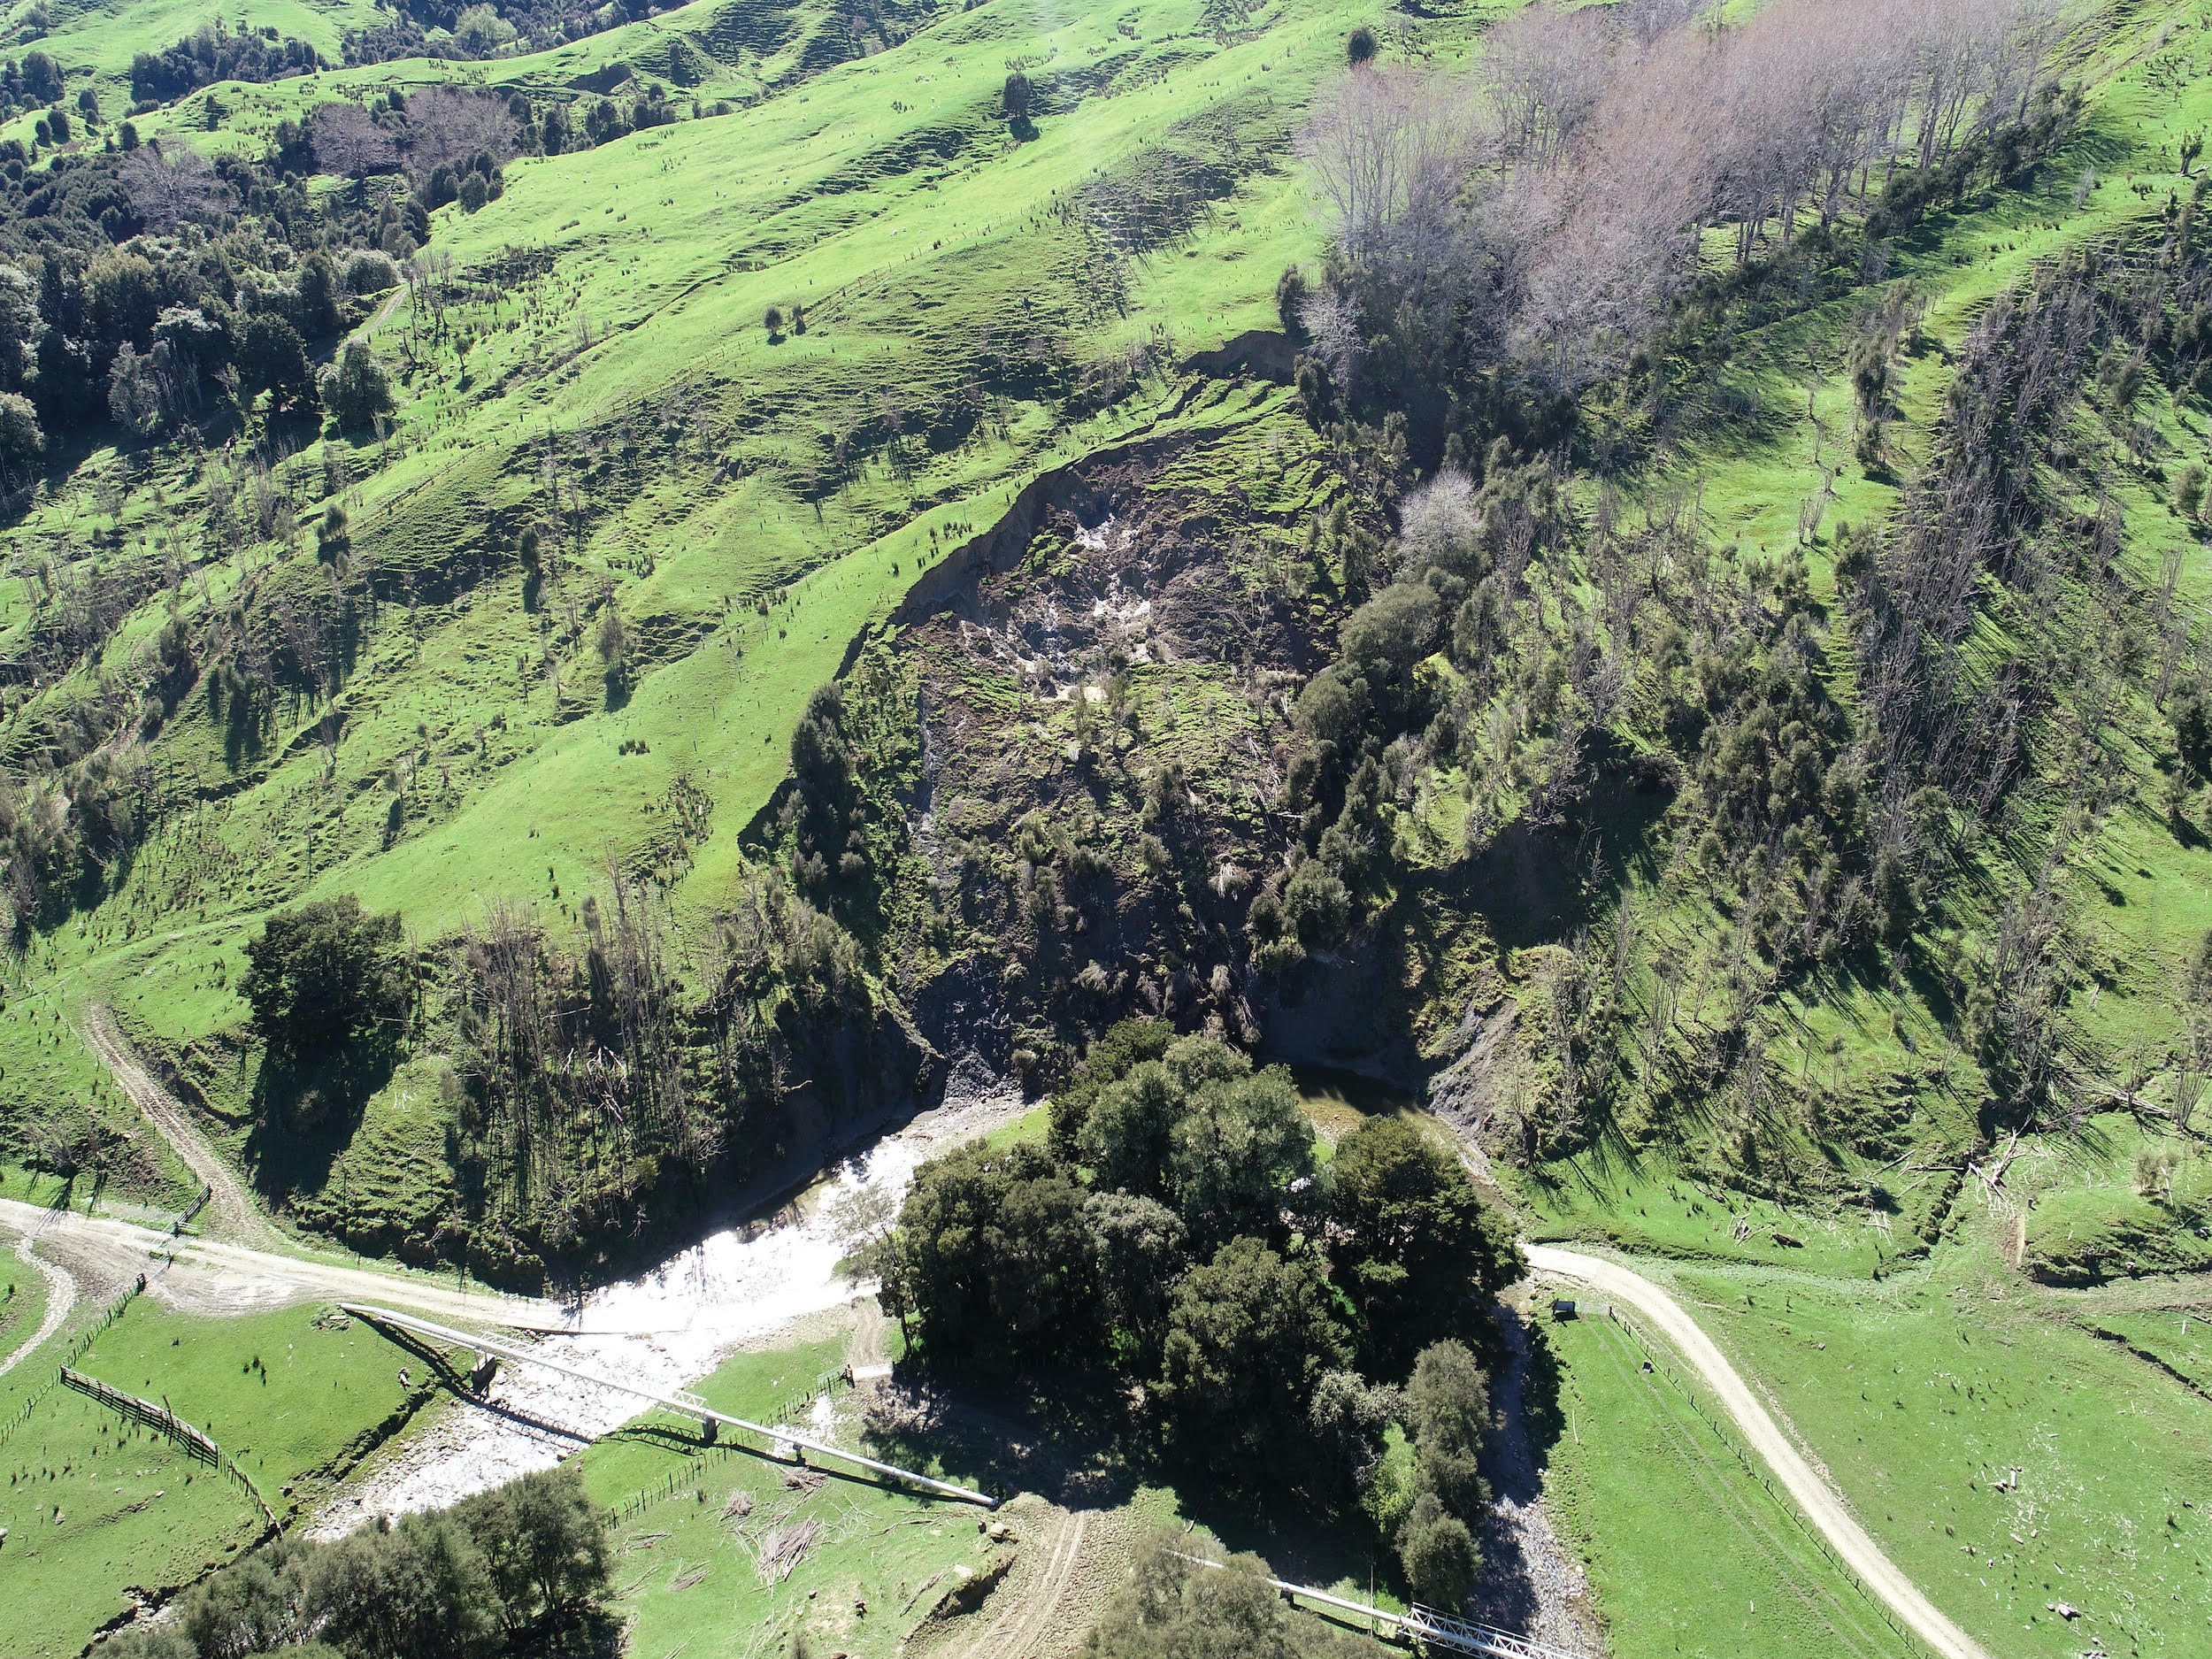
A new landslide near to Gisborne in New Zealand. Image courtesy of Dr Murry Cave.
.
The landslide covers an area of 5,440 square metres. The vertical image below shows its extent and the tension cracking around the rear scarp:-
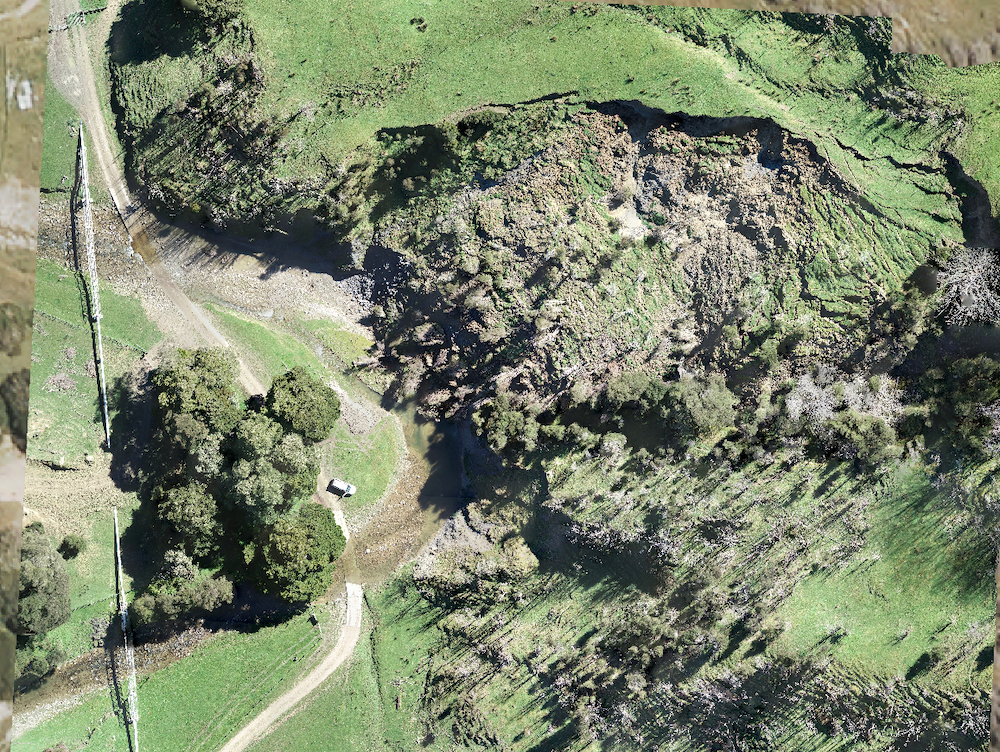
A vertical aerial photograph of the new landslide near to Gisborne in New Zealand. Image courtesy of Dr Murry Cave.
.
The location of this landslide is -38.802, 177.792 if you want to take a look. Note that the slip is on the outside of the bend, suggesting that toe erosion may have played a role in its initiation. The landscape of this area of New Zealand is dominated by natural landslides, so a failure is not unusual or surprising, but clearly in this case it is potentially problematic given the water supply pipe.
Perhaps the most interesting aspect of this landslide is that it has occurred at the toe of a very much larger landslide complex. Murry has kindly provided this annotated image of the site site, with the 27-28 September landslide on the west side:-
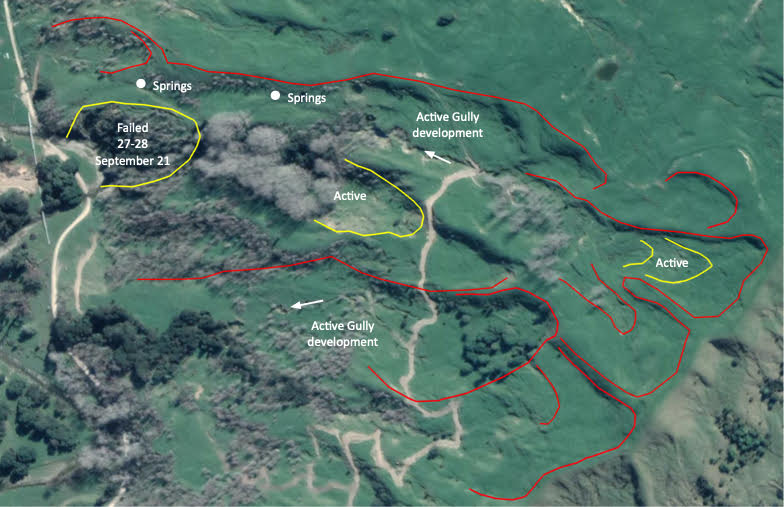
Annotated vertical image of the site of the new landslide near to Gisborne in New Zealand. Image courtesy of Dr Murry Cave.
.
Note that the main landslide complex extends right up to the ridgeline. The risk is that the failure of the toe of this much larger complex will lead to movement on a greater scale, and indeed as the image above highlights, there are signs that parts of the complex have reactivated.
This will now require careful monitoring as a failure on this scale could threaten the pipeline, which can be seen on the west side of the image above. This will require careful monitoring. New Zealand has very extensive experience of dealing with these types of hazards.
New Zealand is now leaving the wetter winter period, so for a few months the risk of a major failure will reduce. However, early in the new year the cyclone season will bring a risk of further heavy rainfall events.
4 October 2021
The seismic signals of the Chamoli landslide and debris flow
The seismic signals of the Chamoli landslide and debris flow
The devastating 7 February 2021 rockslide and debris flow at Chamoli in northern India was well-described in our recent paper (Shugar et al. 2021). Subsequently a number of other papers have been published, with generally similar conclusions about the event, putting to bed the misreporting in the month or so after the disaster. Naturally, more detailed investigations are ongoing.
An important contribution has just been published in the journal Science, (Cook et al. 2021, sadly behind a paywall), which looks at the seismic signals generated by the event. Unsurprisingly, it concludes that the event was detected by the regional seismic network – indeed instruments located up to 100 km from the landslide were able to resolve the event.
Cook et al. (2021) conclude that the seismic data allows three phases of movement to be detected. The first was the initial rockslide, the second was the debris flow and the third was the flood that then travelled downstream. One seismic station was located close to the source of the rockslide, capturing the seismic signal from the disaster well:
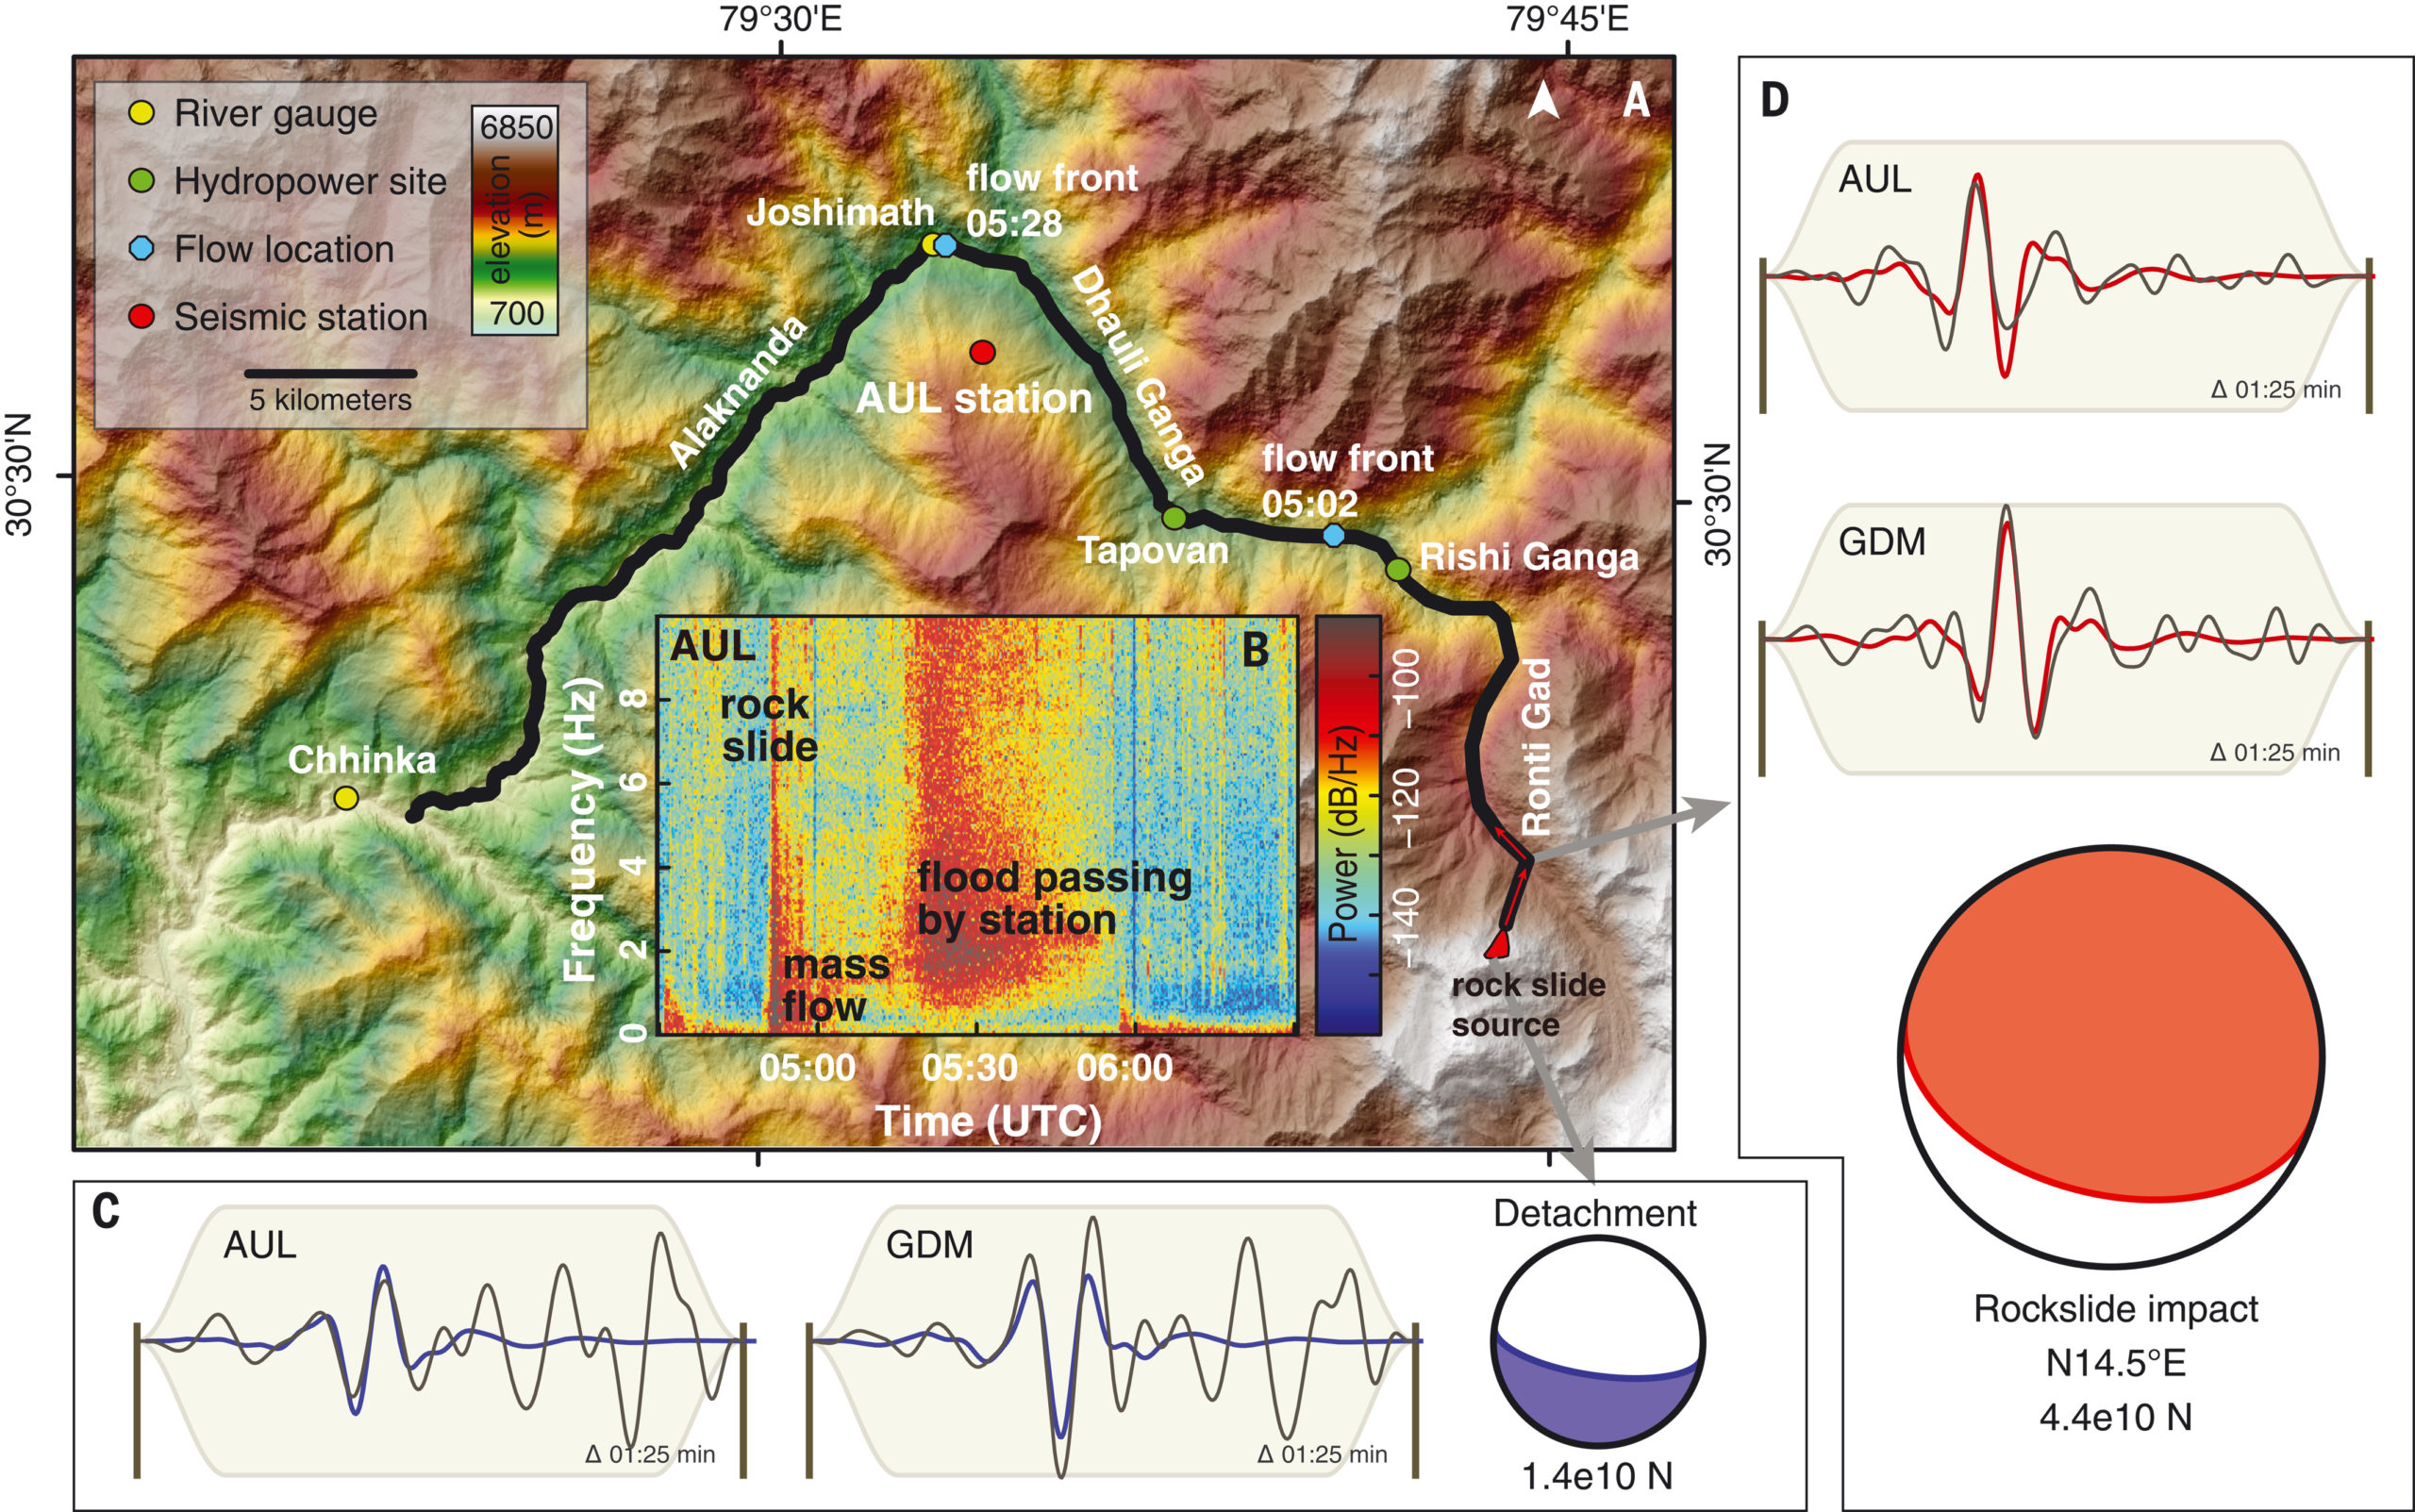
The seismic signal generated by the Chamoli landslide and debris flow, from Cook et al. (2021). (A) Shaded relief map of area affected by the 7 February event, showing key geographic and instrument locations and visual constraints on flow location. (B) Spectrogram at AUL station. (C and D) Lower hemisphere projections of single force focal sphere (detachment force is oriented upward/south, impact force downward/north). Focal sphere areas are proportional to force amplitudes. Waveform fits are shown for two stations at almost perpendicular azimuth. Black represents data displacement, filtered 0.08 to 0.15 Hz), color denotes the corresponding synthetics (note that blue and red synthetics are almost anticorrelated, because the source model is essentially flipped).
,
The seismic data allowed Cook et al. (2021) to analyse the event in more detail than had been possible previously. For example, they time the arrival of the debris flow at the Tapovan hydropower project at 15 minutes after the initial failure. The debris flow component of the reduced in seismic energy as the flow moved downstream. The flow transitioned into a flood when the event entered the Dhauli Ganga valley; thereafter it progressively slowed.
This work is valuable in its own right, but is perhaps most important in terms of signalling the possibility for an early warning system. There were 15 minutes between the initial failure and the location at which most people lost their lives. An automated warning system, based on the seismic signal generated by the initial rockslide, could have made a difference. But Cook et al. (2021) rightly highlight the challenges of making such a system operational:
“In addition to network optimization, automated processing routines must be developed for detection and location of events from a variety of sources and triggers. This will require a larger catalog of seismically recorded events. Ultimately, the ability to rapidly issue effective warnings for catastrophic flow events will depend on a complex array of physical, technological, and social factors, including the detectability of the event, the efficiency of signal transmission and automatic processing, the infrastructure of warning dissemination, and communication and education about warning protocols and responses.”
In essence, such a system will need an appropriate seismic network, reliable automated signal processing, a way to transmit and communicate the warning the those at risk and a population who understand the meaning of the warning, are able to respond in the right manner, and are able to get to safety. In the case of the Chamoli event, if the appropriate seismic network had been in place then all of the this would have needed to happen in 15 minutes. This is not impossible, but the challenges are clear.
On the back of the above study, CSIR National Geophysical Research Institute in India has launched an Environmental Seismology group to work on the development of such warning systems.
.
Reference
Cook, K.l., et al. 2021. Detection and potential early warning of catastrophic flow events with regional seismic networks. Science, 374 (6563), 87-92. DOI: 10.1126/science.abj1227
Shugar, D.h. 2021. A massive rock and ice avalanche caused the 2021 disaster at Chamoli, Indian Himalaya. Science. DOI: 10.1126/science.abh4455
1 October 2021
Using InSAR to create a landslide inventory for the Pacific Northwest
Using InSAR to create a landslide inventory for the Pacific Northwest
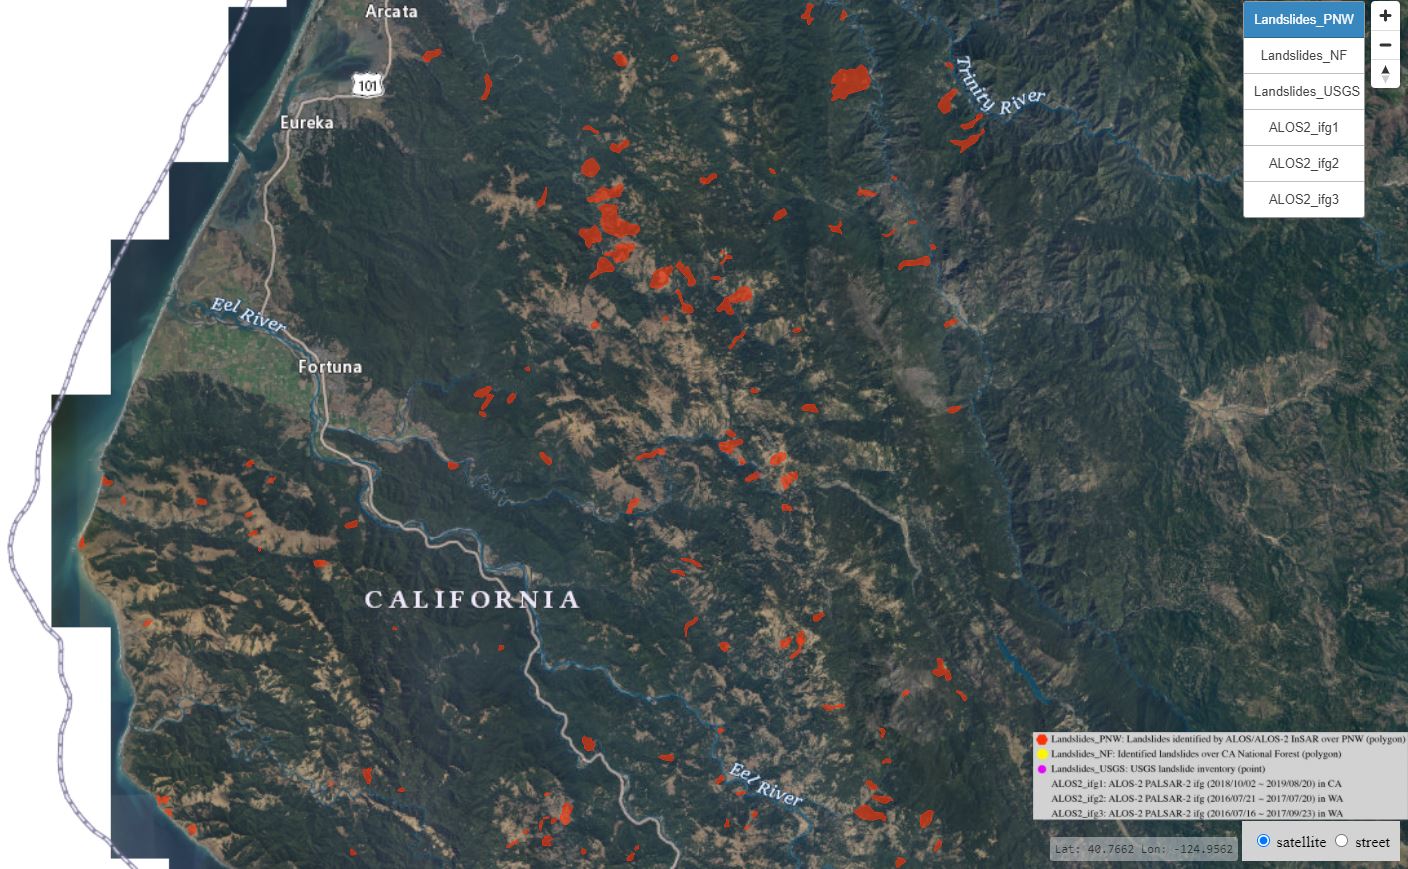
One of the most interesting opportunities presented by the continued rapid development of InSAR as a landslide research tool has been the ability to create inventories of landslides that have not previously been identified. The principle is that InSAR can detect deformation, allowing areas of moving ground to be identified. The step beyond this would be to use it as a tool to try to identify slopes that are progressing towards failure, such as occurred in Chamoli in India earlier this year, but that is some way off as a widely-deployable tool.
A really good demonstration of the potential of InSAR for creating a landslide inventory has recently been published in the journal Landslides (Xu et al. 2021), sadly behind a paywall, with a good write up in phys.org. In this study, InSAR has been used to map slow-moving landslides in the Pacific Northwest of the USA. There are many such landslides in this area, but they can be difficult to detect using conventional tool, often because of forest cover and/or agricultural modification of the terrain.
The authors used radar images from 2007 to 2019. They found 617 active landslides that do not appear in the USGS inventory. The largest is 13 million cubic metres. The landslides were active at different times through the study – for example, 471 showed deformation in the period between 2015 and 2019.
The research team, from Southern Methodist University and the USGS, have provided an online tool to visualise the landslides. The image below shows a part of the inventory using this tool:
.
The creation of the this inventory is very valuable in itself, providing the potential to determine how the landscape will evolve in the coming decades in response to seismic activity, changes in rainfall patterns and wildfires. But the study also demonstrates that InSAR is rapidly becoming an very valuable tool for wide area landslide mapping and monitoring.
.
Reference
Xu, Y., Schulz, W.H., Lu, Z. et al. 2021. Geologic controls of slow-moving landslides near the US West Coast. Landslides (2021). https://doi.org/10.1007/s10346-021-01732-3
10 September 2021
Landslides from the 7 September 2021 M=7.1 Guerrero earthquake in Mexico
Landslides from the 7 September 2021 M=7.1 Guerrero earthquake in Mexico
In the evening of 7 September 2021 (local time) a M=7.1 earthquake struck close to the city of Acapulco in Mexico. This event was shallow, leading to potentially high levels of damage in the worst affected areas. Wikipedia is calling this the 2021 Guerrero earthquake, but time will tell as to whether this is adopted as the formal name for the event.
At least three people were killed and 20 more were injured, a comparatively light toll for an event of this magnitude. Interestingly, one of the major impacts appears to have been landslides, although fortunately there are no known fatalities from these events.
Some images are emerging of landslides triggered by this event. The best set I have found so far is in the Daily Sabah, which has a gallery of images of the impacts of the earthquake, several of which show landslides:-
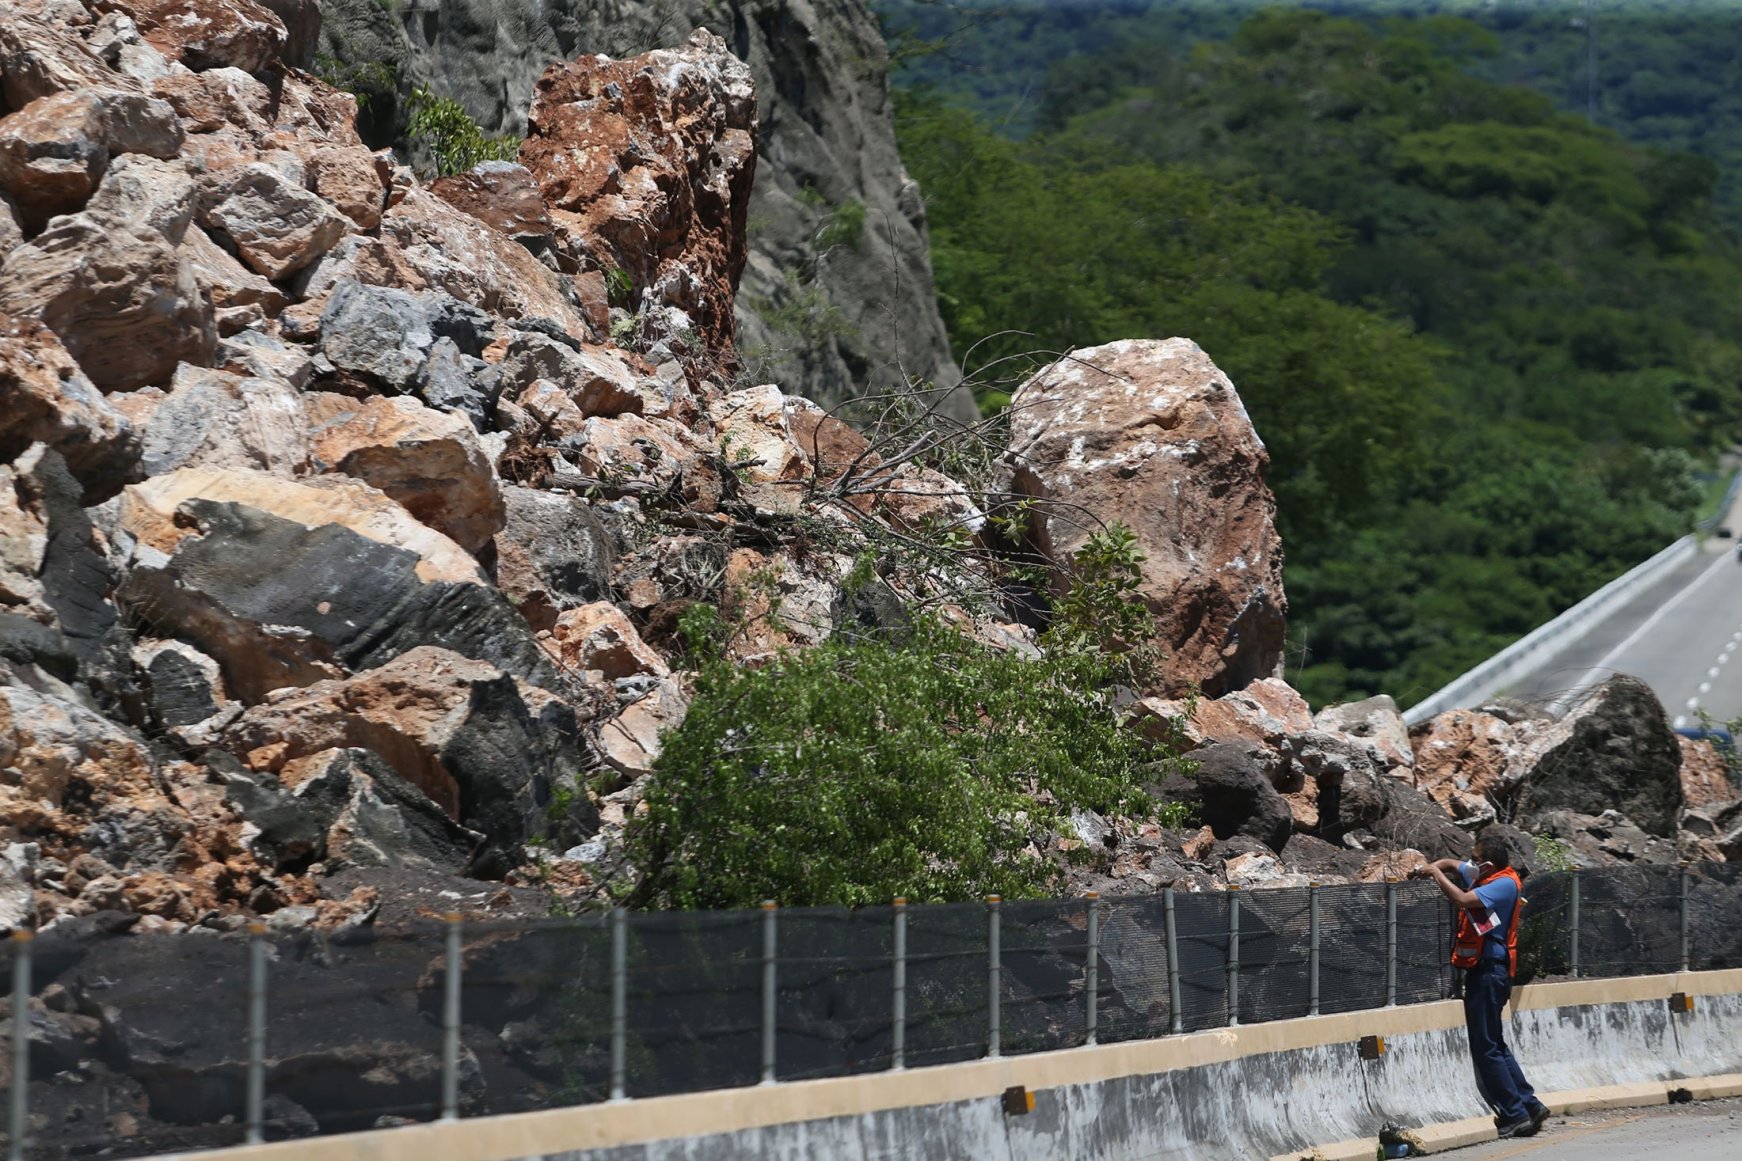
A major rockslide on a highway, triggered by the 7 September 2021 M=7.1 Guerrero earthquake in Mexico. Image by Reuters via the Daily Sabah.
.

A fill slope collapse on a road, triggered by the 7 September 2021 M=7.1 Guerrero earthquake in Mexico. Getty Images via the Daily Sabah.
.

Minor slope collapses in a residential hillside, triggered by the 7 September 2021 M=7.1 Guerrero earthquake in Mexico. Getty Images via the Daily Sabah.
.
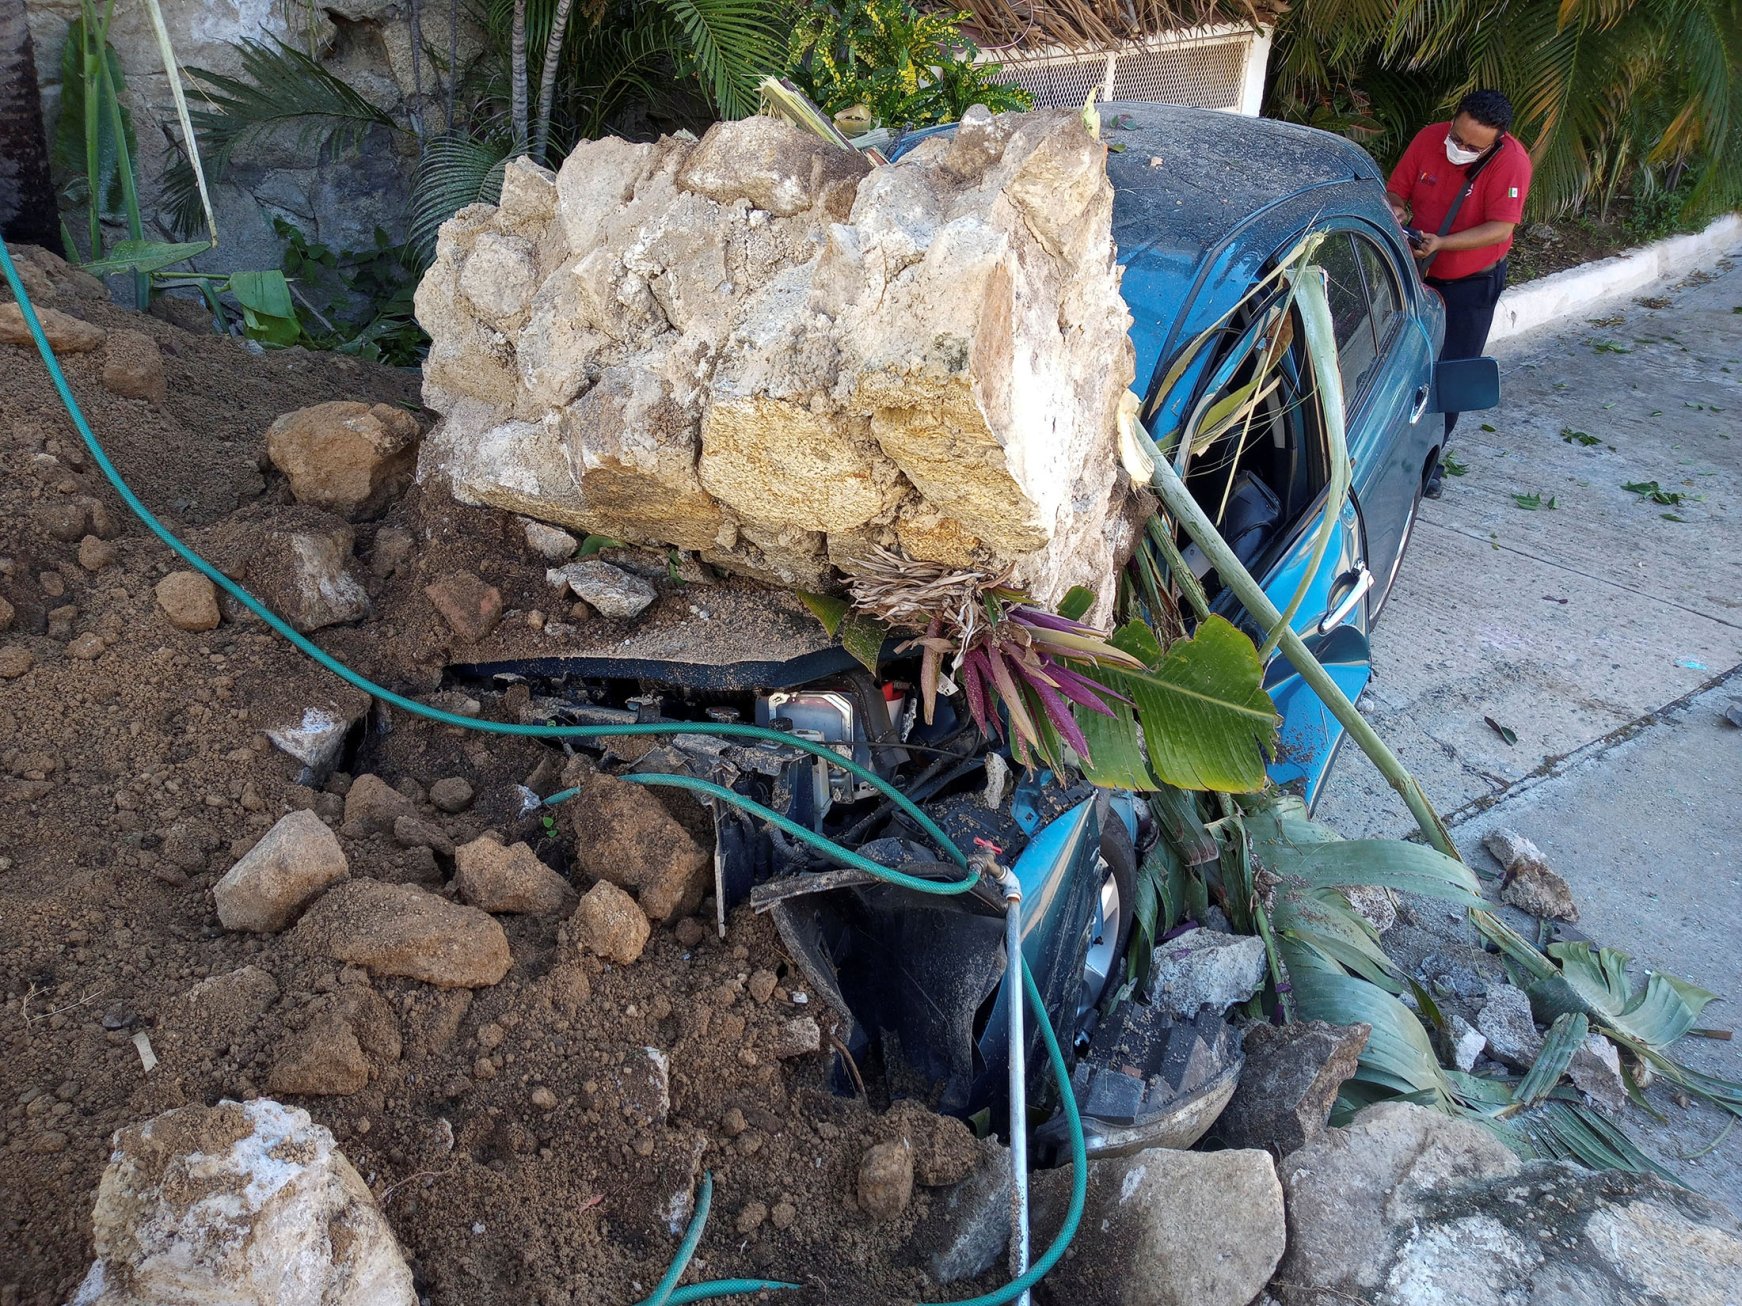
Damage to a car triggered by a slope failure triggered by the 7 September 2021 M=7.1 Guerrero earthquake in Mexico. Image by Reuters via the Daily Sabah.
Given the topography and the scale of the earthquake, it seems likely that larger landslides will have occurred in the more remote mountainous areas of the epicentral zone. As yet I have not seen any images of such events, but it is likely that reconnaissance and fact-finding visits will be organised in the coming days. I would welcome any information that loyal readers can provide.
9 September 2021
Paimio: a very unusual landslide in Finland
Paimio: a very unusual landslide in Finland
Last week a very unusual and interesting landslide occurred close to the town of Paimio in Finland. The image below, published on ts.fi, provides a wonderful overview of the landslide:-
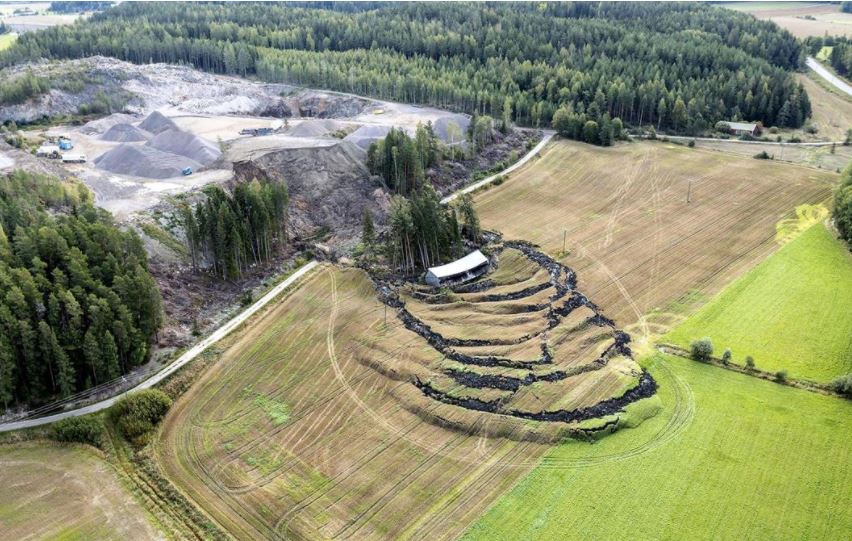
The landslide at Paimio in Finland. Image published by ts.fi.
.
Once again I don’t think I’ve seen one quite like this before. The source area appears to be an aggregate storage area from a nearby quarry. The aggregate pile has has clearly failed – there is a scar and some tension cracks visible. The material in the fields appears to be clay, common in formerly glaciated areas. The failure of the aggregate pile has propagated through the clay substrate over a distance of perhaps 100 metres, forming a set of compressive ridges. This is unusual.
It is interesting to ponder what might have happened here. My working hypothesis is that this might be a bearing capacity failure in the clay below the aggregate pile – essentially the clay did not have the shear strength to withstand the stresses imposed by the heap. Its failure caused the pile to collapse.
The nearest comparative event I can remember of the Hatfield Colliery failure close to my now home in Sheffield, in England. In this case colliery spoil was piled on gravels that subsequently failed. However, in the case of the landslide at Paimio the failure has propagated a relatively longer distance from the source, presumable reflecting the properties of the clay.
Fortunately no-one was killed or injured in the landslide at Paimio, and only one building was damaged.
The location of the landslide is, I believe, 60.434, 22.610. There is a Google Earth image of the site from 2018:-
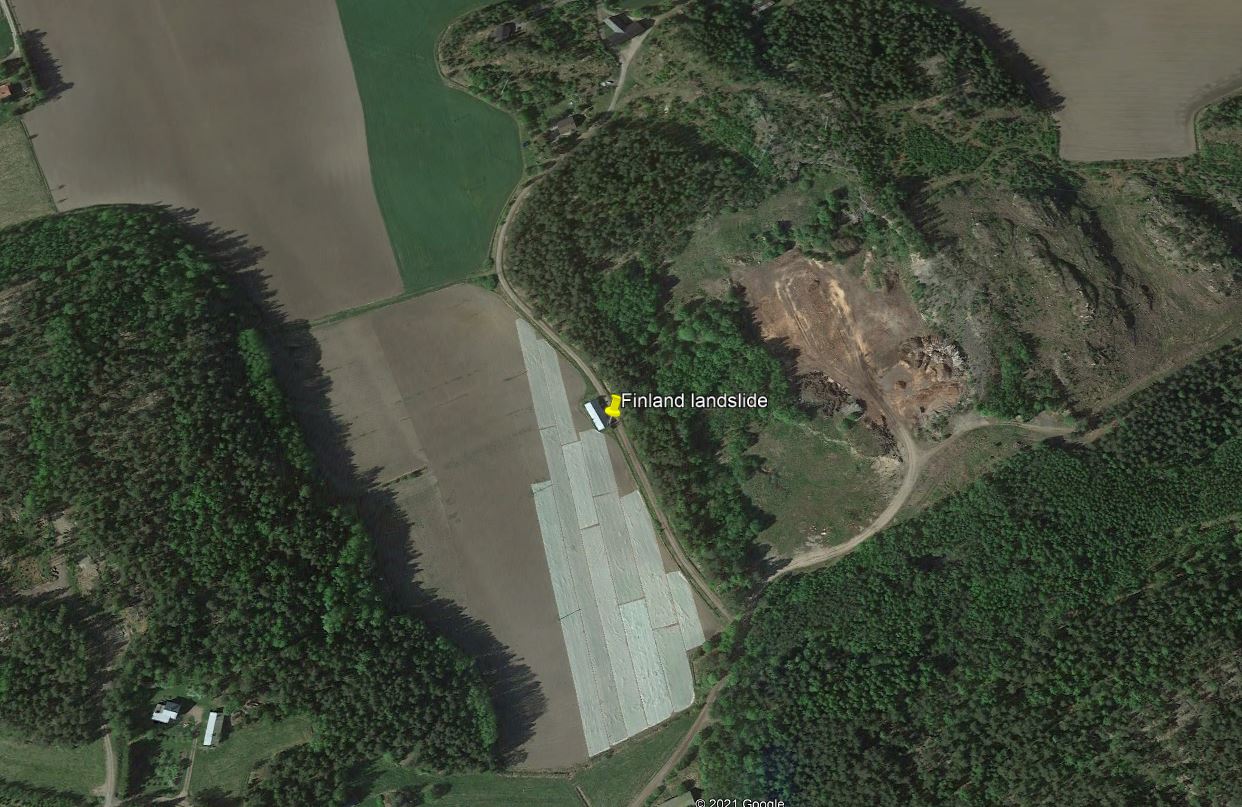
Google Earth image of the site of the landslide at Paimio in Finland.
.
Interestingly this image does not show the large pile of aggregate that was involved in the failure, so this might be a comparatively recent addition.
.
Acknowledgement
Many thanks to loyal reader Tomi for highlighting this one to me.
8 September 2021
The Pretty Rocks landslide in Denali National Park in Alaska
The Pretty Rocks landslide in Denali National Park in Alaska
Last year I posted about landslides in Denali National Park in Alaska, including a very interesting case study, the Pretty Rocks Landslide. This failure, located at 63.537, -149.815 if you wish to take a look, is heavily disrupting the single road through the national park. Time magazine has an online article about this landslide that is worth a look. Sitting behind that is considerable more detail on the Denali National Park website, including a set of images of the landslide:
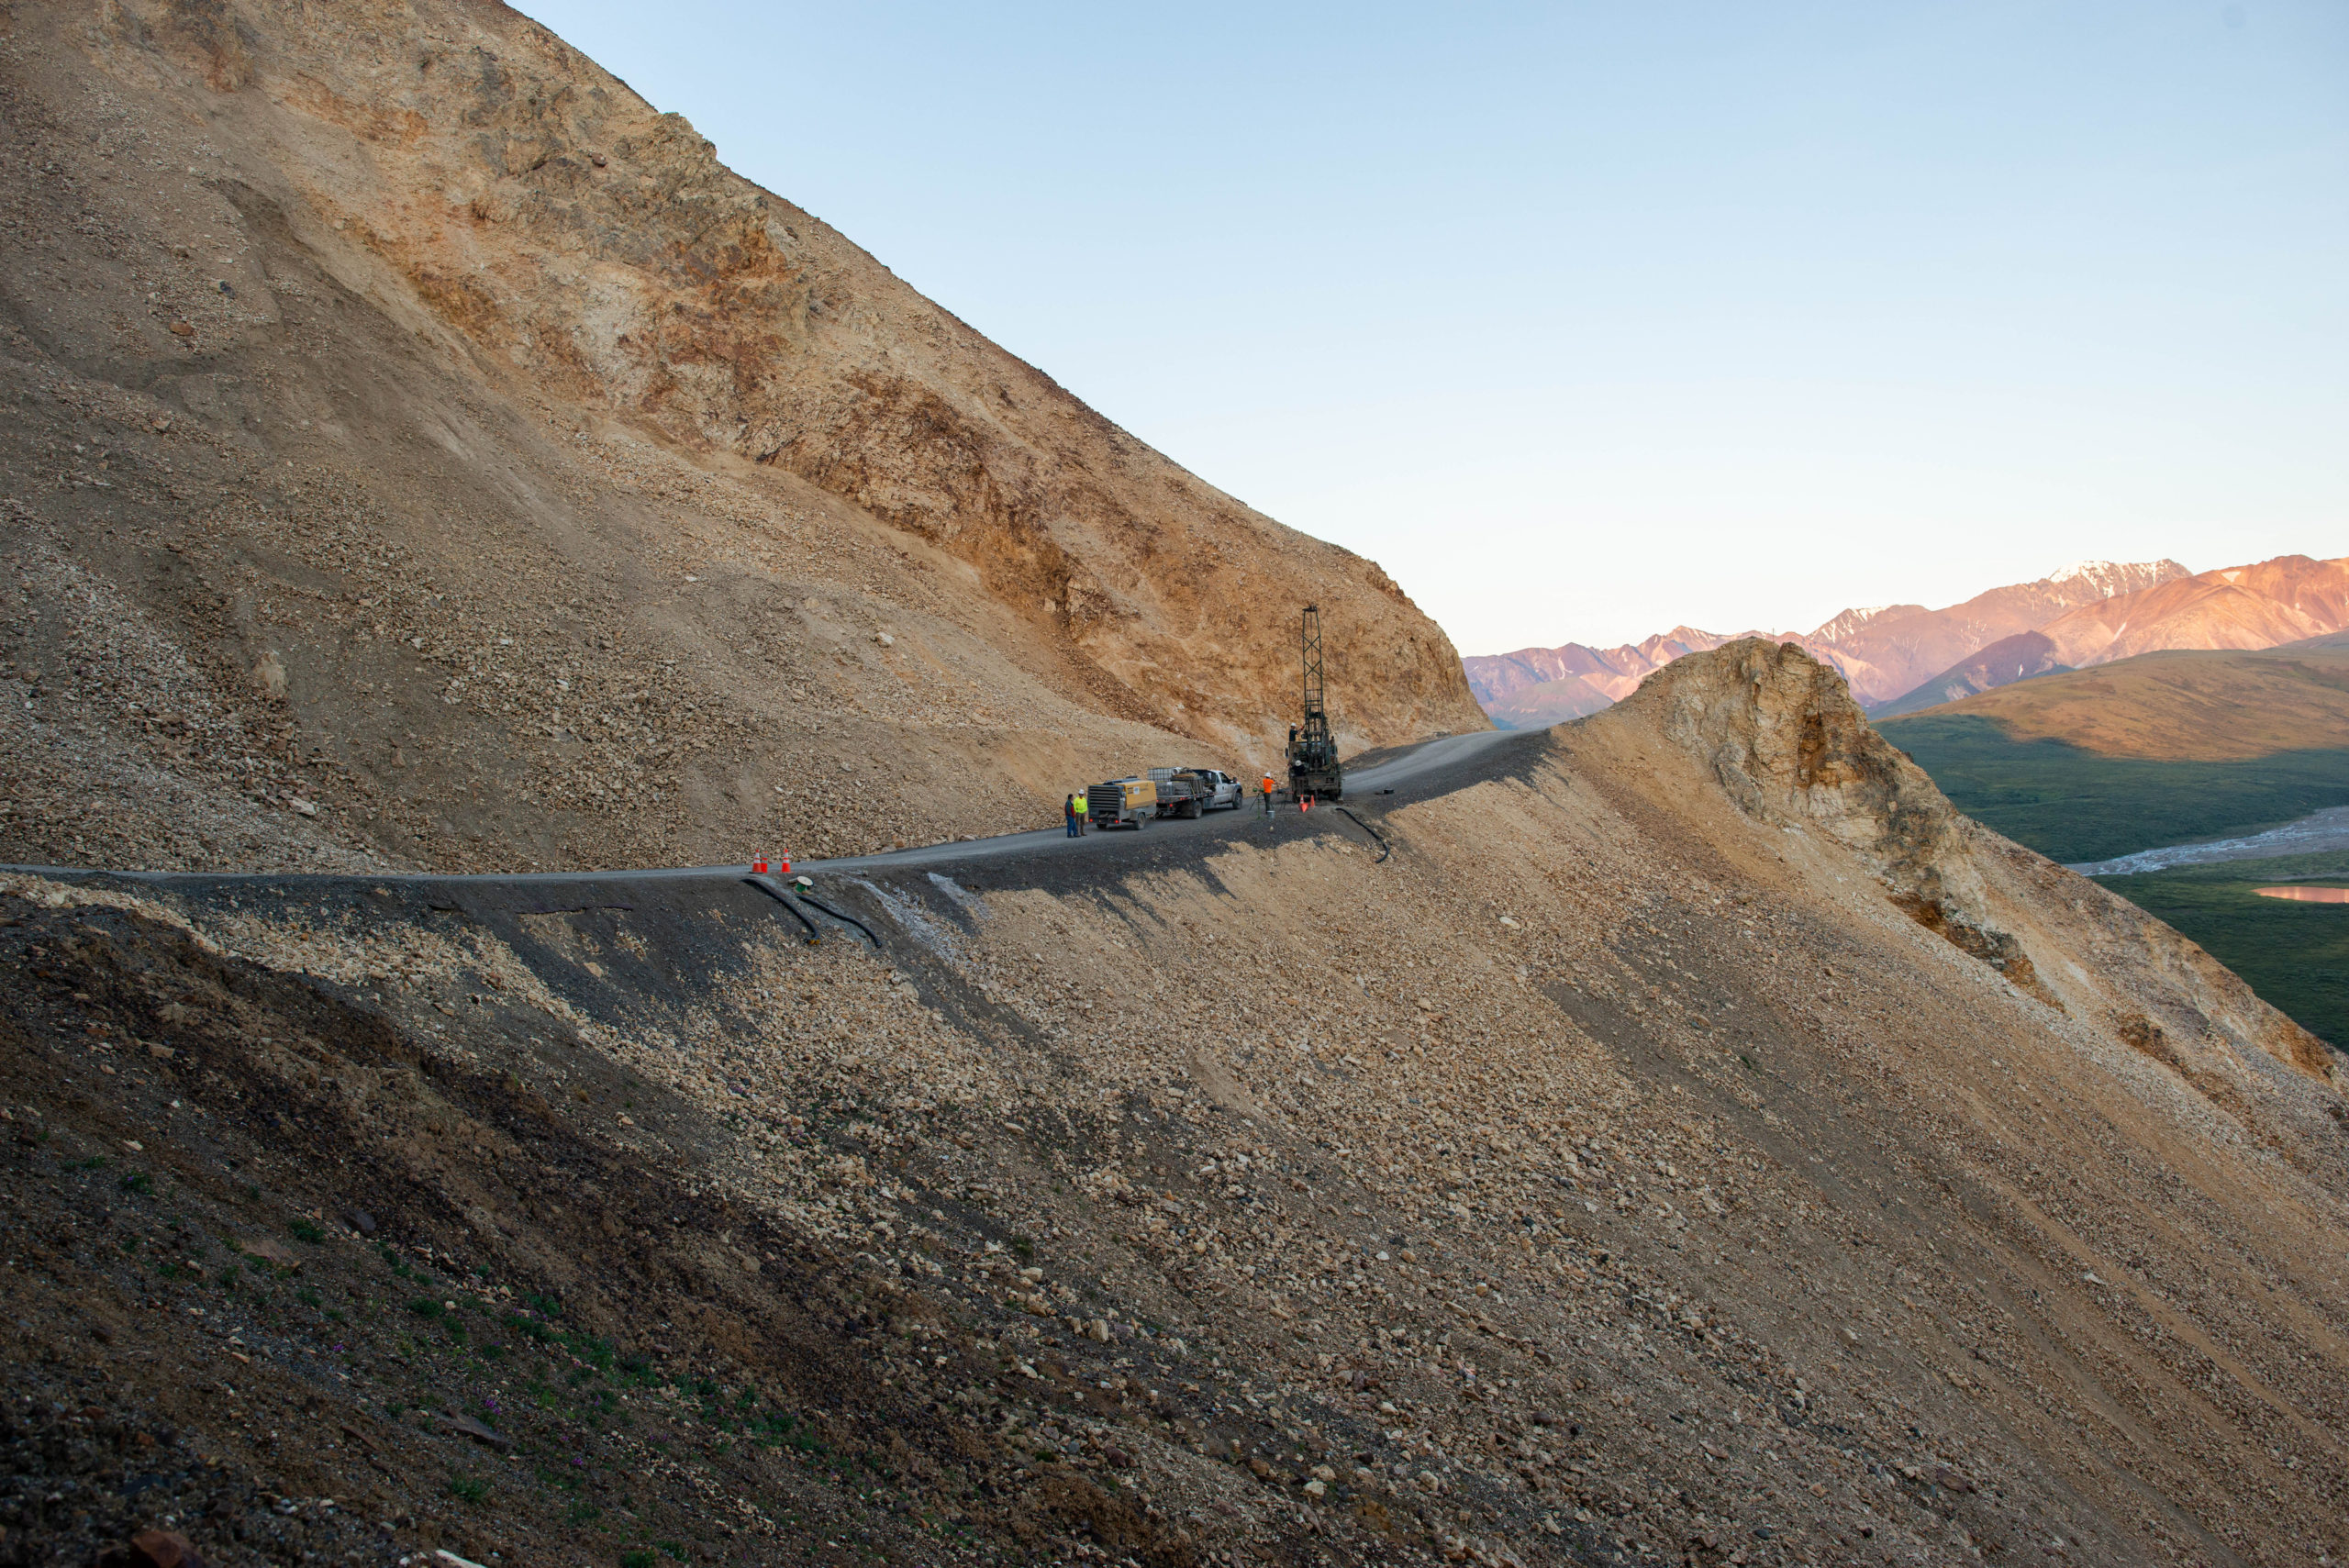
The Pretty Rocks landslide in Denali National Park. Image courtesy of Denali National Park.
.
The Denali National Park article notes that technically this is a rock glacier, and that it is moving quite rapidly. The rate of movement of the landslide has increased in recent years in response to the warming climate, with highttps://www.nps.gov/dena/learn/nature/pretty-rocks.htmh rates being noted in particular in periods of summer rainfall. The website describes the change in pattern of movement of the landslide:-
The landslide at Pretty Rocks has been active since at least the 1960s, but has evolved from a manageable maintenance concern into a much more extensive maintenance challenge. Before 2014, the landslide only caused small cracks in the road surface and required maintenance every 2-3 years.
Between 2016 and 2017, the full width of a 100-yard (90-m) section of road slumped up to 0.2” (0.5 cm) per day, steepening the road gradient and limiting sight lines for drivers approaching the sharp turn. but not warranting long-term closures.
However, by 2018 the slumping increased to almost half an inch per day, and then to three and a half inches per day by August 2020. Early August rains in 2021 appear to have triggered the rate to increase significantly, with much of the landslide currently moving downhill at over ten inches per day.
NPS road crews maintained a safe drivable surface for most of the summer of 2021 by importing as much as 100 dump-truck loads of gravel per week to fill the slump. On August 24, park managers recognized that this solution was no longer tenable or safe and enacted a road closure to the east of Pretty Rocks. As the area becomes more unstable, traditional road maintenance methods have become inadequate. The park’s ability to adapt to future conditions will require transitioning to more expensive and novel construction methods to maintain road-based access.
Denali National Park has produced a wonderful time lapse video of the landslide movement that is incredibly instructive:
Time lapse video of the Pretty Rocks landslide, produced by Denali National Park.
.
Note the continuous movement of the slide, wbich extends right to the toe of the slope. The dumping of gravel to maintain the road is clearly evident, as is the pitfall of this approach. The gravel is steadily loading the head of the landslide, increasing the driving force. Resistance is not increasing at the same rate, so the tipping is likely to be making the problems with the slope slightly worse.
The National Park are right to cease this approach. Unfortunately, as the National Park notes, alternative ways to maintain the road are likely to be costly and difficult.
 Dave Petley is the Vice-Chancellor of the University of Hull in the United Kingdom. His blog provides commentary and analysis of landslide events occurring worldwide, including the landslides themselves, latest research, and conferences and meetings.
Recent Comments