
14 July 2023
The Medieval 23 cubic kilometre Sabche rockslide in Annapurna, Nepal
The Medieval 23 cubic kilometre Sabche rockslide in Annapurna, Nepal
A paper (Lavé et al. 2023) was published in the journal Nature last week that, perhaps surprisingly, garnered comparatively little attention. It describes an enormous landslide that occurred from the Annapurna mountain range in Nepal, effecively decaptitating one of the largest peaks. The authors estimate that the landslide had a volume of about 23 cubic kilometres.
That a very large mass movement occurred in the Annapurna area is not new. The city of Pokhara, the second largest in Nepal, is built on a series of enormous terraces that had previously been identified as being the aftermath of one or more catastrophic debris flows (see for example Fort 2010). These had been dated to about 500 years BP, but the origin of this landslide sequence was less clear.
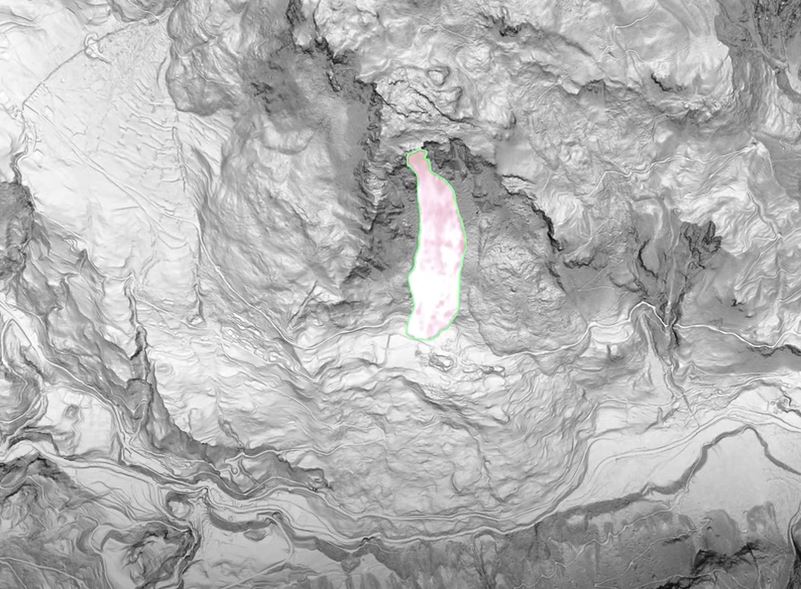
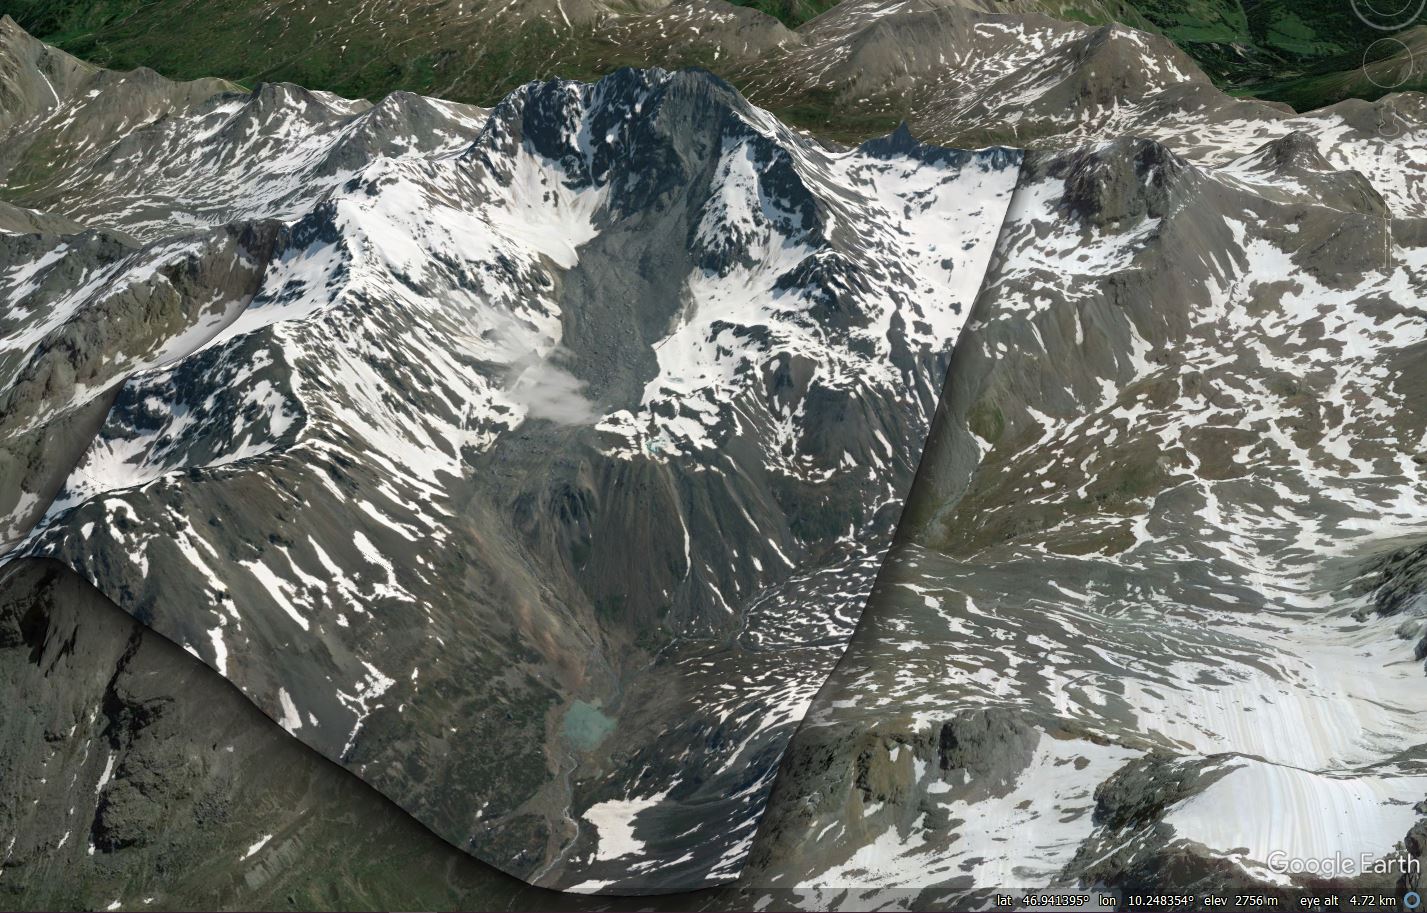
Lavé et al. (2023) have examined the geology the area, concluding that the source was an enormous rock avalanche, which they are terming the Sabche rockslide, originating from the Annapurna Massif. They have dated this to about the year 1200. The Google Earth image below shows the source zone:-
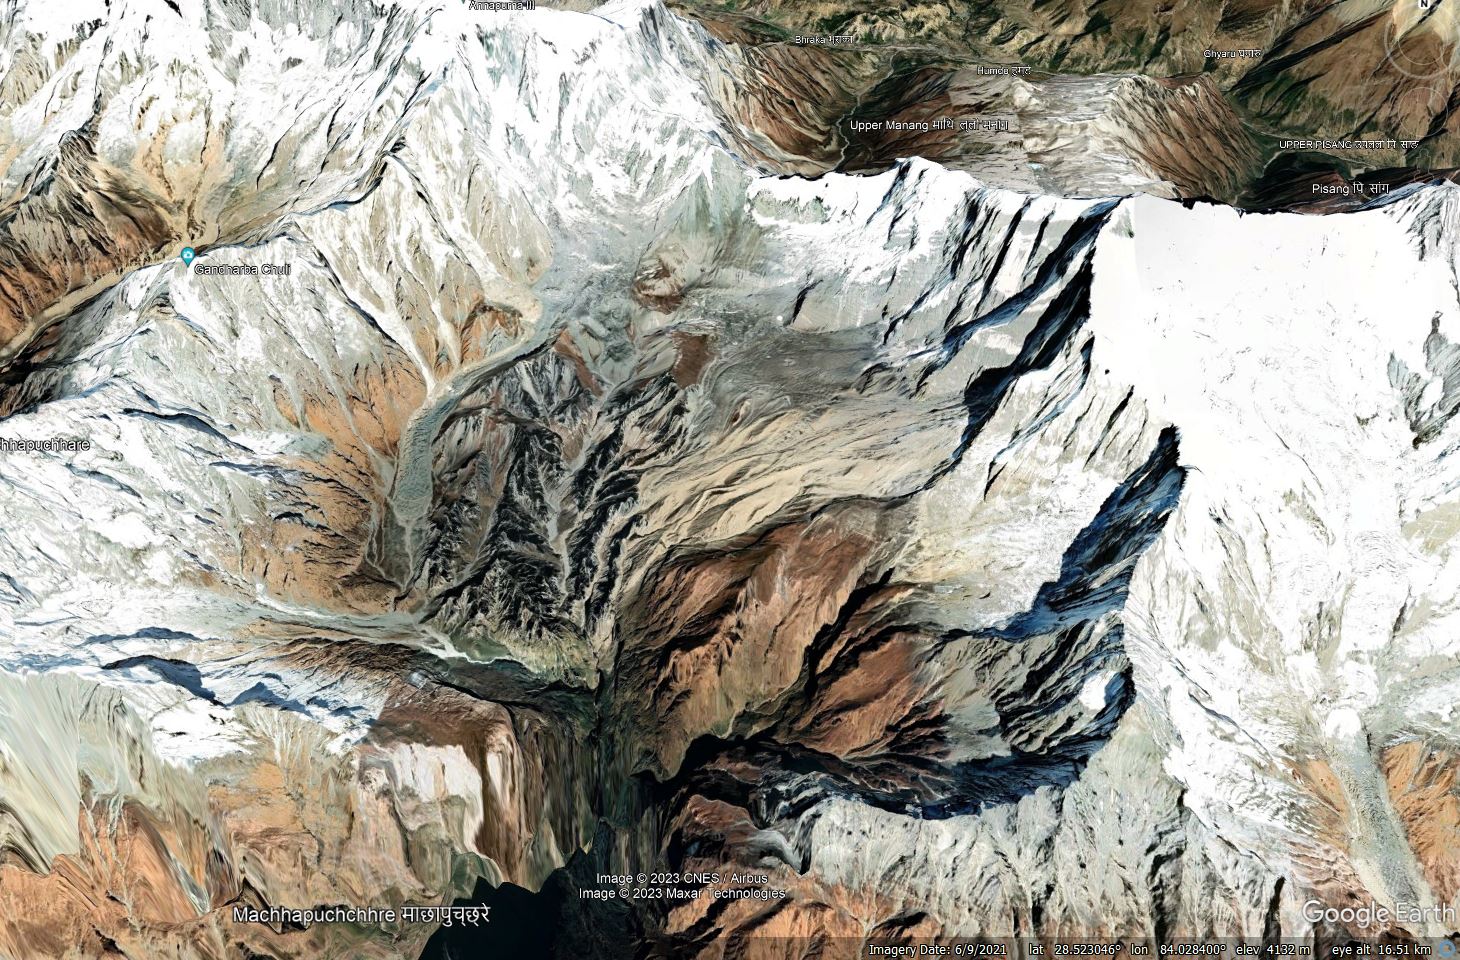
Google Earth image of the source zone of the Sabche rockslide from the Annapurna massif in Nepal.
.
The sediments in the central part of this bowl are predominantly limestone brecchias, which are considered by the authors to be the remnants of the rock avalanche. Note also the much more recent deposit from the huge, but very much smaller, Seti Valley rock avalanche in May 2012, which a group of us pieced together on this blog.
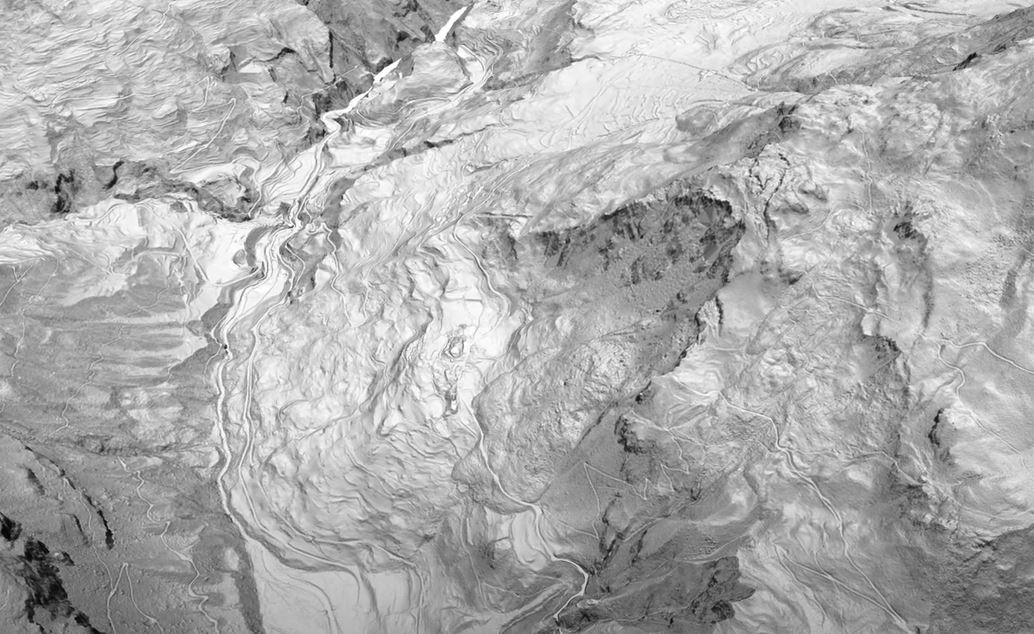
The authors have attempted to reconstruct the original topography, and thus the approximate scale of the Sabche rockslide, in this diagram from the paper:-
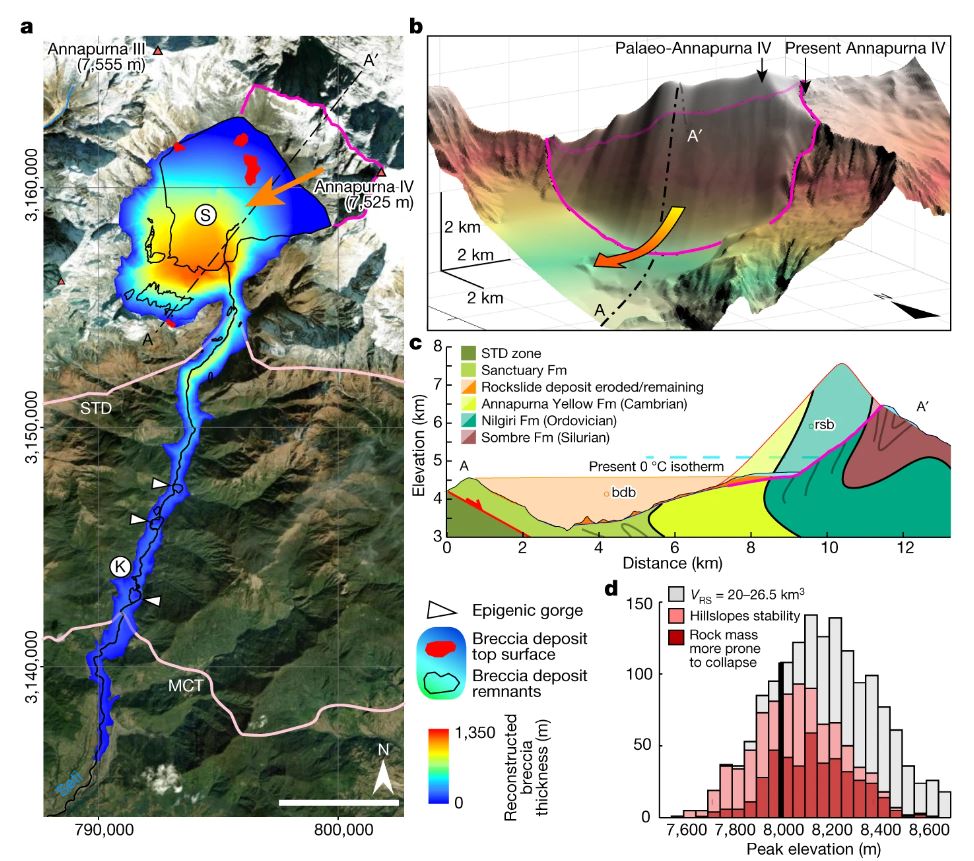
A reconstruction of the Sabche rockslide from Nepal, from Lavé et al. (2023).
.
In the diagram to the left, the rear scarp of the landslide is outlined in purple, whilst the thickness of the brecchia is in the blue-red colour-scale. The extent of the runout of the landslide is shown. Lavé et al. (2023) postulate that in the century after the landslide, an enormous amount of sediment remobilisation occurred, moving the brecchia from its initial position downstream to create the enormous terraces in the Pokhara area. It is fascinating that this appears to have occurred very rapidly after the landslide – the mechanisms for this are unclear to me.
Finally, it is interesting to speculate on the trigger for the landslide. One possibility is an earthquake, but there is no recorded event in the Himalayas for this time. Thus, it is unlikely to have been a large seismic event, but one cannot discount a more localised, shallow crustal earthquake. Another possibility is climatic forcing – the Sabche rockslide occurred in the Medieval Climate Anomaly, when temperatures are thought to have been higher in the Himalayas. However, some megalandslides occur through progressive failure, requiring no external trigger. This may be the case here.
Overall, this is a fascinating paper that should spur further research into this landslide, and into the possibility of similar events elsewhere in the Himalayas. The great challenge now will be to undertake further work within the source zone of the Sabche rockslide – this is an area that is extremely difficult to access, so it will be quite an adventure.
.
References
Fort, M. 2010. The Pokhara Valley: A Product of a Natural Catastrophe. In: Migon, P., Geomorphological Landscapes of the World. Springer. pp 265-274.
Lavé, J., Guérin, C., Valla, P.G. et al. 2023. Medieval demise of a Himalayan giant summit induced by mega-landslide. Nature 619, 94–101 (2023). https://doi.org/10.1038/s41586-023-06040-5
11 July 2023
The Rolling Hills Estates landslide in California
The Rolling Hills Estates landslide in California
It has been a busy few days in the landslide world, with major events being reported in various locations. The most serious is likely to be the extreme rainfall event that has hit Himachal Pradesh and Uttarakhand in northern India, but the true picture there remains somewhat unclear. There has also been extreme rainfall, with resultant landslides, in China, Japan, the USA, Turkey, Pakistan and elsewhere. The northern hemisphere summer rainy season is only just getting going, so there is likely to be a lot more to come.
Meanwhile, in California a major landslide impacted (the ironically-named) Rolling Hills Estates, in Los Angeles County, located on the northern side of the Palos Verdes Peninsula. The landslide started to move rapidly on 8 July 2023, and reports indicate that movement is continuing. Reports indicate that 12 houses have been damaged or destroyed on Peartree Lane. The location of the landslide is approximately [33.7637, -118.3888].
John Kay has posted a drone video of the site to Youtube, which is worth viewing:-
.
This is a still from that video:-
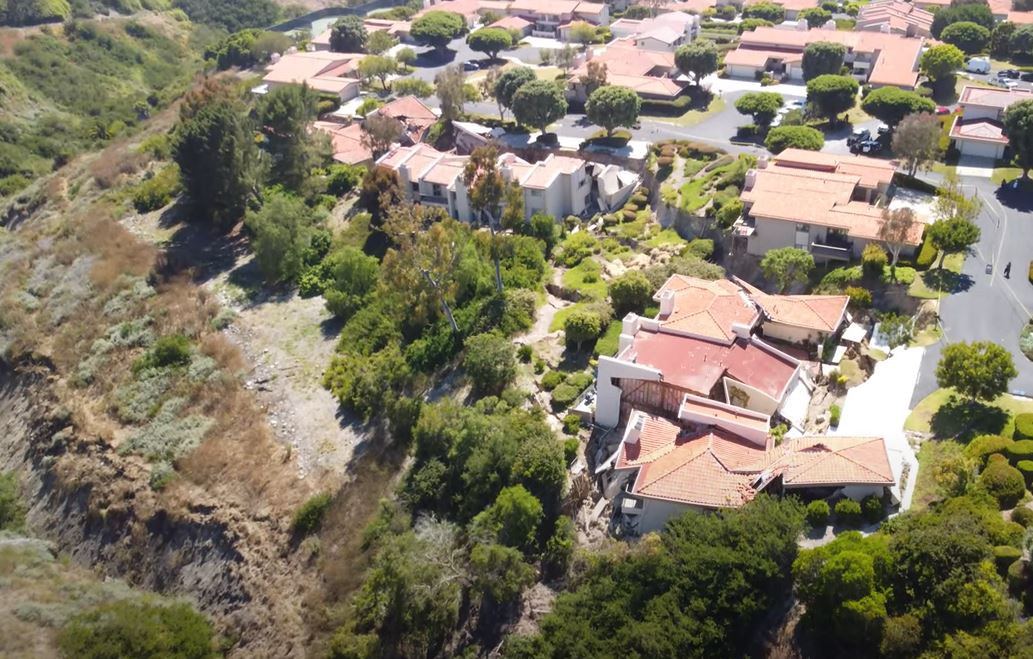
The 8 July 2023 landslide at Rolling Hills Estates. Still from a drone video posted to Youtube by John Kay.
.
Whilst this is a view from a different angle:-
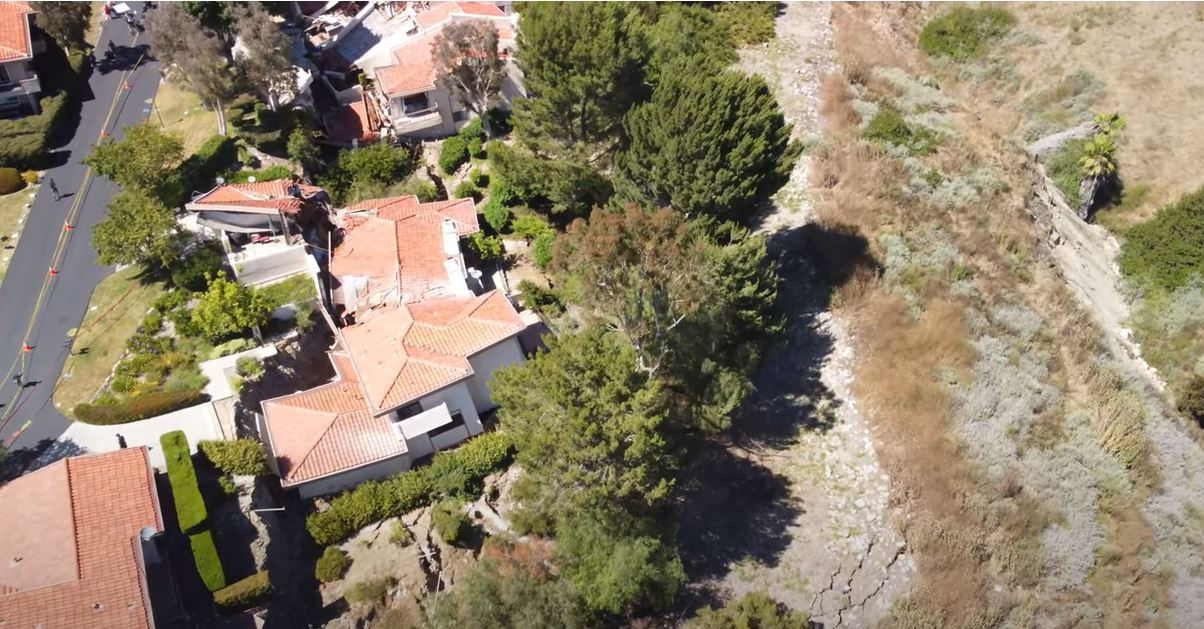
An alternative view of the 8 July 2023 landslide at Rolling Hills Estates. Still from a drone video posted to Youtube by John Kay.
.
On first inspection this appears to be a slump, possibly driven by toe erosion in the canyon?
Loyal reader Funkenbeachin has kindly put together an animation of the site using the 1 m DEM, which might support the above interpretation:-
.
This video also shows very clearly that this area of California is no stranger to landslides, including the Portuguese Bend landslide.
This event will of course be a devastating blow to the owners of the properties affected, all of whom have been evacuated. The images above suggest that at least some of these houses will not be habitable.
.
Acknowledgement
Many thanks to various people who contacted me about this event.
6 July 2023
Naucalpan: a large garbage dump landslide in Mexico
Naucalpan: a large garbage dump landslide in Mexico
On 4 July 2023 a large garbage dump landslide occurred in Naucalpan in Mexico, burying four people. Three of them were rescued, but at the time of writing one remains missing.
News reports indicate that about 7,000 cubic metres of waste failed in the landslide, which was reportedly caught on a CCTV video that has been posted to Twitter:-
Tragedia en el basurero de Santiago Tepatlaxco en #Naucalpan: Víctimas atrapadas bajo toneladas de basura https://t.co/8zCz7CJtxo
pic.twitter.com/sZ4aRq9H2o— SéUno Noticias (@seunonoticias) July 5, 2023
.
That this video is the event at Naucalpan is currently unverified, but it appears to match to the images posted online.
There are some images of the aftermath online, the best of which has been posted to https://lopezdoriga.com/:-
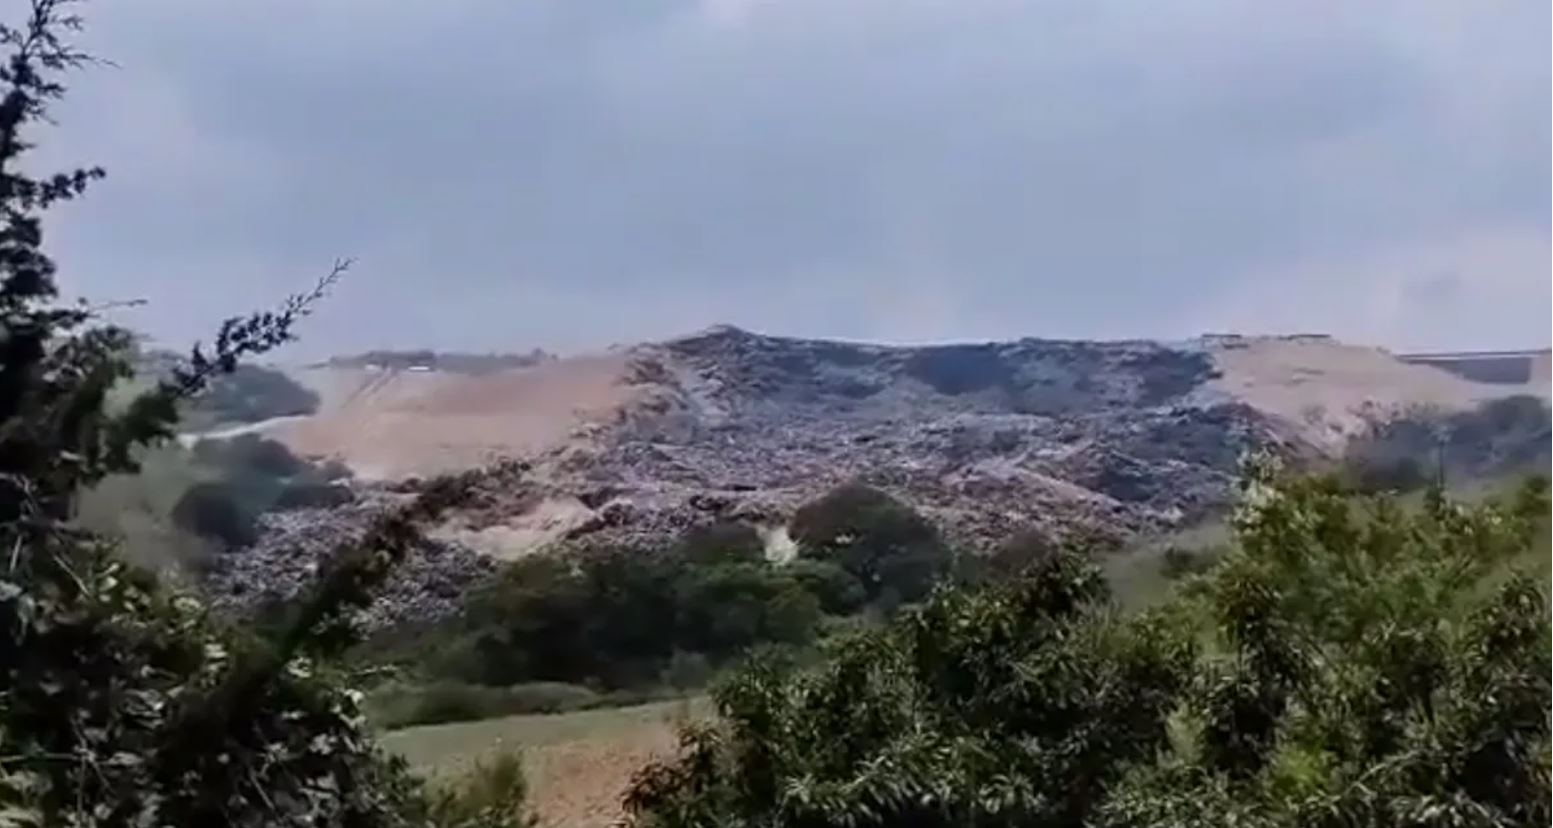
The aftermath of the 4 July 2023 garbage dump landslide in Naucalpan, Mexico. Image from https://lopezdoriga.com/.
.
This is a screenshot from a video of the aftermath that was posted to Twitter:-
Reportan un incidente en la zona ejidal de Puente de Piedra, en la comunidad de Santiago Tepatlaxco, Naucalpan.
Se registró una explosión y un deslizamiento en un tiraderohttps://t.co/fCWkiPKqPm
— Joaquín López-Dóriga (@lopezdoriga) July 4, 2023
.
The cause of the garbage landslide at Naucalpan is unclear, but reports have indicated that the site was poorly regulated at best.
Over the years I have highlighted a number of garbage landslides. They are particularly awful events for both the victims and the rescuers, and they cause enormous amounts of environmental damage.
4 July 2023
The triggering of slope failure – the Qingliucun landslide
The triggering of slope failure – the Qingliucun landslide
On 4 December 2020 a major landslide occurred in the the vicinity of Qingliucun in Sichuan Province, China. Fortunately no-one was killed in the landslide, but it destroyed several houses and briefly blocked the Mengtun River.
This landslide is described in a new paper in the journal Landslides (Xue et al. 2023). This is an image, from the paper, of the aftermath of the landslide:-
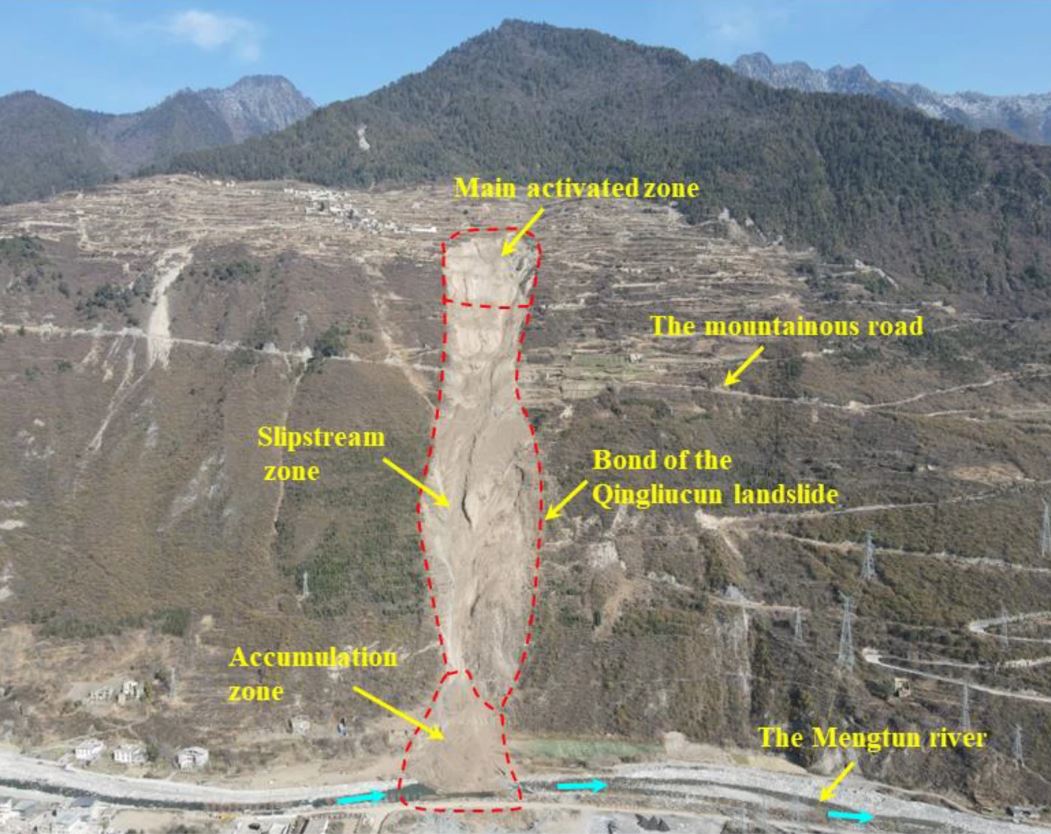
The aftermath of the 4 December 2020 Qingliucun landslide in China. Image from Xue et al. (2023).
.
As the image above shows, this landslide involved an initial activation high on the slope that turned into a debris avalanche with a large amount of entrainment. The estimated volume of the initial failure is 24.8 × 10⁴ cubic metres, with a maximum length of 145 m and a maximum width of 225 m. The landslide had a maximum depth of 18 m. The runout distance was about 1,100 m. The materials involved are clay-rich soils.
Deformation of the slope was detected prior to failure, with movement starting months before the landslide.
What I find really interesting about this landslide is an InSAR analysis of movement of the slope by Xue et al. (2023), based on five monitoring points, plotted along with the measured rainfall:-
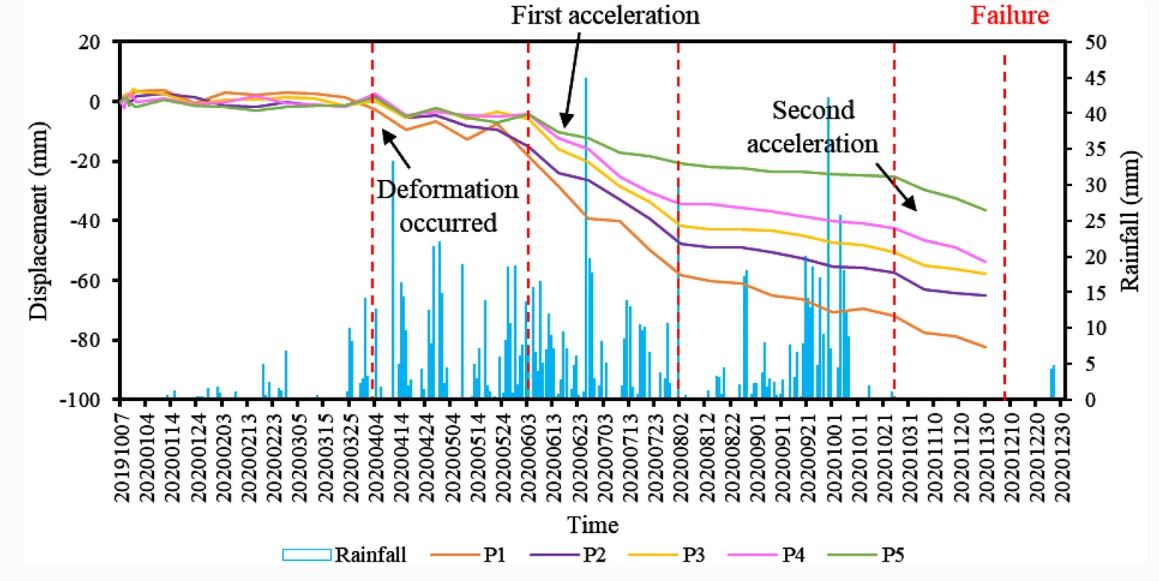
Movement of the 4 December 2020 Qingliucun landslide in China. Image from Xue et al. (2023).
.
The graph shows the initiation of measured movement in April 2020. In the spring and summer rainy season, the precipitation inputs were large. The landslide responded most notably in the period from June to August 2020, with up to 60 mm of movement being observed. The period through August was less rainy, and the landslide slowed down. There was a second period of precipitation through September and early October, but the landslide appears to have barely responded, with slow rates of creep being noted.
Interestingly, this creep continued after the rainfall ceased around 8 October. There was scarcely any further precipitation input from this point onwards. The second phase of acceleration started in late October 2020, and the Qingliucun landslide failed in early December.
It is intriguing to work out what happened in this period. One possibility was that pore water pressures were still rising more than a month after the end of the rainfall. This is credible, but seems unlikely given the rapid response to rainfall earlier in the movement history. Perhaps more likely is that the deformation by this point was being driven by internal changes in the stress state – the landslide had reached the critical strain, and was now so weak that fail was an inevitable, time dependent, process.
The mechanisms occurring in slopes during these final phases prior to failure remain poorly constrained, but they are fascinating. If I was in a position to lead a research programme (which my day job precludes) then this would be my focus.
.
Reference
Xue, D., Dai, C., Wu, Y. et al. 2023. A catastrophic rainfall-induced high landslide, occurred on December 4, 2020, in the Qingliucun mountainous area of Southwest China. Landslides (2023). https://doi.org/10.1007/s10346-023-02111-w
30 June 2023
Lidar data of the Brienz-Brinzauls landslide site
Lidar data of the Brienz-Brinzauls landslide site
The large (1.2 million cubic metre) landslide at Brienz-Brinzauls in Switzerland on 15 June 2023 has attracted a great deal of attention. The event was both spectacular and large, narrowly missing the village. There is a very nice presentation (in German) about the landslide on the http://www.albula-alvra.ch/ website – it is worth a look for the images if nothing else. It includes this post event Lidar image:
A post-failure Lidar image of the aftermath of the 15 June 2023 landslide at Brienz-Brinzauls in Switzerland. Image from a presentation posted to the website of Albula/Alvra.
.
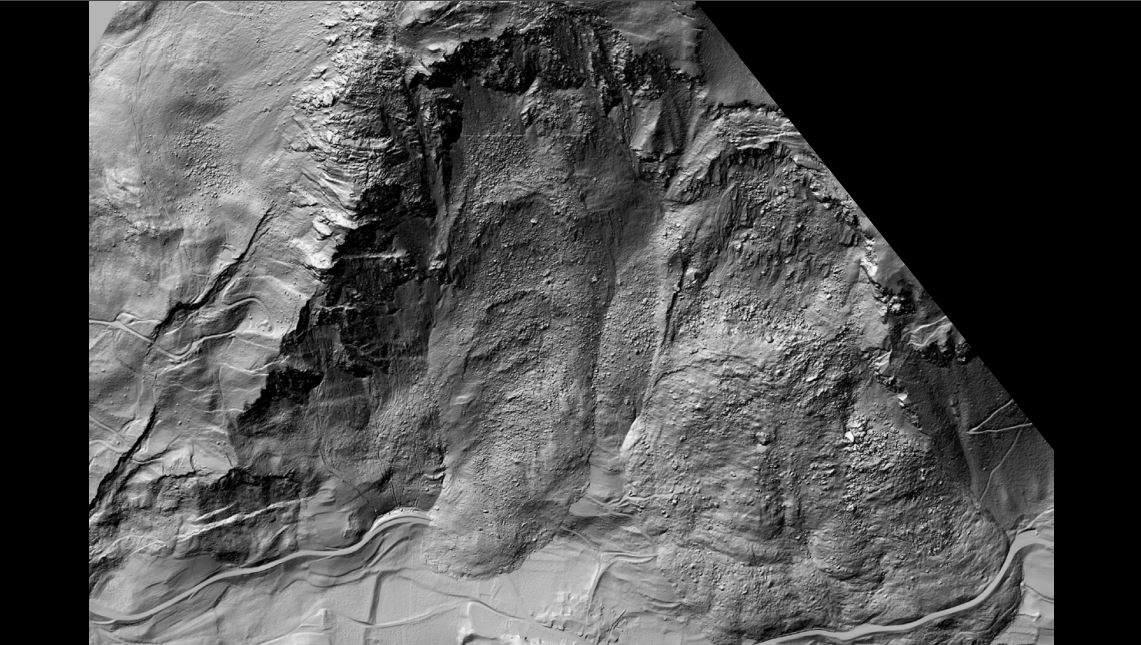
Loyal reader Funkenbeachin has once again collated lidar and satellite data for the area, and has posted a film to Youtube to display it. This was an epic effort – creating the underlying dataset required extensive work, but the outcome is remarkle:-
.
Note that this video uses data collected before 15 January 2023, so that the recent landslide is not captured. Ken has marked the approximate outline of the landslide on the imagery. But look at what the Lidar image shows:-
A pre-failure Lidar image of the aftermath of the 15 June 2023 landslide at Brienz-Brinzauls in Switzerland. The recent landslide is shown on the image. Still from a video posted to Youtube by Funkenbeachin.
.
That the events this month were part of a much larger landslide complex is not new, but the scale is breathtaking. The image above shows an ancient mega-landslide, with the most recent event being a much smaller failure from the rear scarp of the previous slide. The ancient landslide was sufficiently large to have reached the other side of the valley. To the east of the 15 June 2023 event is the deposit of another large landslide, also from the rear scarp of the mega-landslide. This appears to have been larger than the 15 June 2023 event.
And upslope of the rear scarp is an area of active deformation that is huge – this is the deep-seated gravitational deformation that has been described previously. Immediately above the rear scarp are a series of tension features, but the zone of deformation extends much further upslope:
A pre-failure Lidar image of the aftermath of the 15 June 2023 landslide at Brienz-Brinzauls in Switzerland. Still from a video posted to Youtube by Funkenbeachin.
.
These types of very complex landslide systems are very common in high mountain areas, but this is a beautiful example.
29 June 2023
The 27 June 2023 landslide at Miansi, Sichuan Province, China
The 27 June 2023 landslide at Miansi, Sichuan Province, China
The monsoon in Asia is now developing quickly, with heavy rainfall triggering landslides in both East and South Asia. The most intense rainfall usually occurs later in the summer, so the current phase is likely to be just the opening act. The developing El Nino conditions and the extreme heat being recorded in many places make the monsoon quite unpredictable.
In China, some areas are already being affected by heavy rainfall. Notably, an extreme rainfall event impacted Miansi and Weizhou townships in Wenchuan county of Sicuhan Province on 27 June 2023. This has been reported by AP and a few other agencies, but it is less easy to find information in the Chinese media except for a brief report on Xinhua Society. It appears that the landslides killed at least seven people.
The best report that I can find is in Mandarin in thepaper.cn. This includes a series of images of what appears to have been a very large debris flow:-
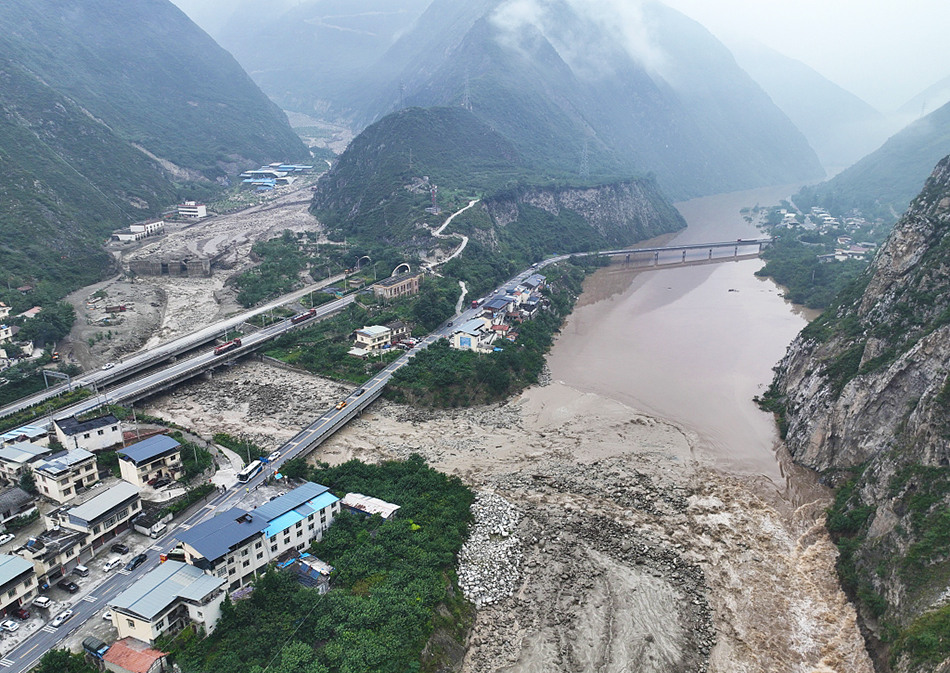
The aftermath of the 27 June 2023 debris flow at Miansi and Weizhou townships in Wenchuan county. Image from thepaper.cn.
.
The landslide appears to have been sufficiently large to be valley-blocking in the first instance, although the dam has now breached.
The article includes another image, providing detail further up the main channel, in which structural damage is clear:-
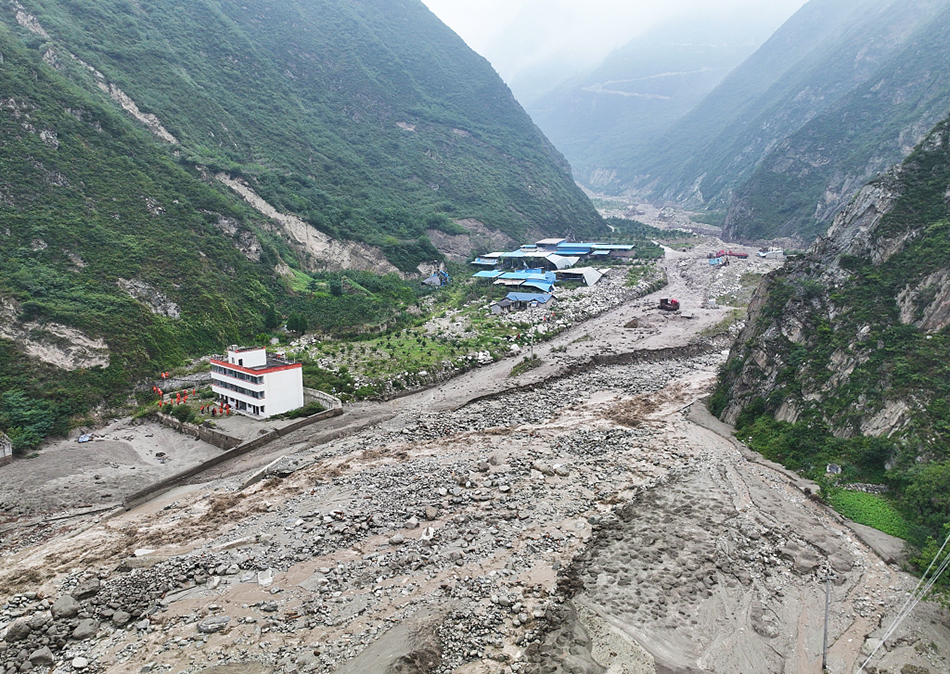
The aftermath of the 27 June 2023 debris flow at Miansi and Weizhou townships in Wenchuan county. Image from thepaper.cn.
.
I believe that the location of the place shown in the images above is [31.408, 103.529]. Google Earth imagery suggests that this is an area with many landslides prior to this heavy rainfall. Many of those area likely to have been associated with the 2008 Wenchuan Earthquake – this area was heavily impacted by landslides in that event. It is remarkable that elevated levels of landslide events continue to occur, 15 years after the earthquake.
28 June 2023
Planet satellite image of the 11 June 2023 Flüchthorn rock avalanche
Planet satellite image of the 11 June 2023 Flüchthorn rock avalanche
Once again my friends at Planet have captured a remarkable satellite image of a landslide. They have imaged, using their high resolution SkySat instrument, the 11 June 2023 Flüchthorn rock avalanche. This is the image:-
Planet SkySat image of the 11 June 2023 Flüchthorn rock avalanche in Austria. Image, captured on 18 June 2023, copyright Planet, used with permission.
.
The image above has not been orthorectified (i.e. it is shown from the perspective of the instrument). This is corrected in the version of the image below:
Orthorectified Planet SkySat image of the 11 June 2023 Flüchthorn rock avalanche in Austria. Image, captured on 18 June 2023, copyright Planet, used with permission.
.
I have also imported the image into Google Earth, and have draped it onto the topography:-
Orthorectified Planet SkySat image of the 11 June 2023 Flüchthorn rock avalanche in Austria, draped onto Google Earth topography. Image, captured on 18 June 2023, copyright Planet, used with permission.
The image captures very beautifully the steep source zone of the landslide and the very bouldery upper portion of the deposit. The transition into a debris flow, probably because of the entrainment of ice and saturated sediment as it crossed the upper plateau, can be seen. Almost no deposition has occurred as the landslide descended the steep lower slope. The landslide has scoured the sediments at the foot of the steep lower slope but has then started to deposit material, allowing a small lake to form. The width of the flow dramatically reduces from this point onwards.
It is extremely fortunate that no-one was in the path of this dramatic landslide.
It is also worth noting that the failure also caused a small landslide on the other side of the Flüchthorn:-
Orthorectified Planet SkySat image of the other face of the Flüchthorn, draped onto Google Earth topography, showing another small landslide. Image, captured on 18 June 2023, copyright Planet, used with permission.
.
Acknowledgement and reference
Planet Team (2023). Planet Application Program Interface: In Space for Life on Earth. San Francisco, CA. https://www.planet.com/
26 June 2023
The 27 December 1898 Sasso Rosso landslide in Switzerland
The 27 December 1898 Sasso Rosso landslide in Switzerland
In the aftermath of the Brienz-Brinzauls landslide in Switzerland, I have been looking at other notable events in that country. An open access paper (Condera et al. 2018) in an edited volume on Natural Hazards briefly describe the 27 December 1898 Sasso Rossa landslide in Switzerland near to the village of Airolo in Ticino. This was a 500,000 cubic metre landslide that killed three people as well as destroying a hotel and 11 houses. The human losses were reduced by a successful evacuation of the school and parts of the village ahead of the main failure.
Condera et al. (2018) included this image of the aftermath of the landslide, annotated to show the outlines of the scar and deposit:-
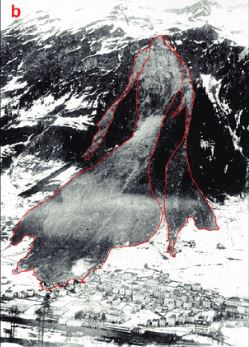
The aftermath of the 27 December 1898 Sasso Rosso landslide at Airolo. Image from Condera et al. (2018).
.
The site is located at [46.540, 8.605]. The landslide scar and deposit are very clearly visible on Google Earth imagery (I have tried to get a view close to that above):-
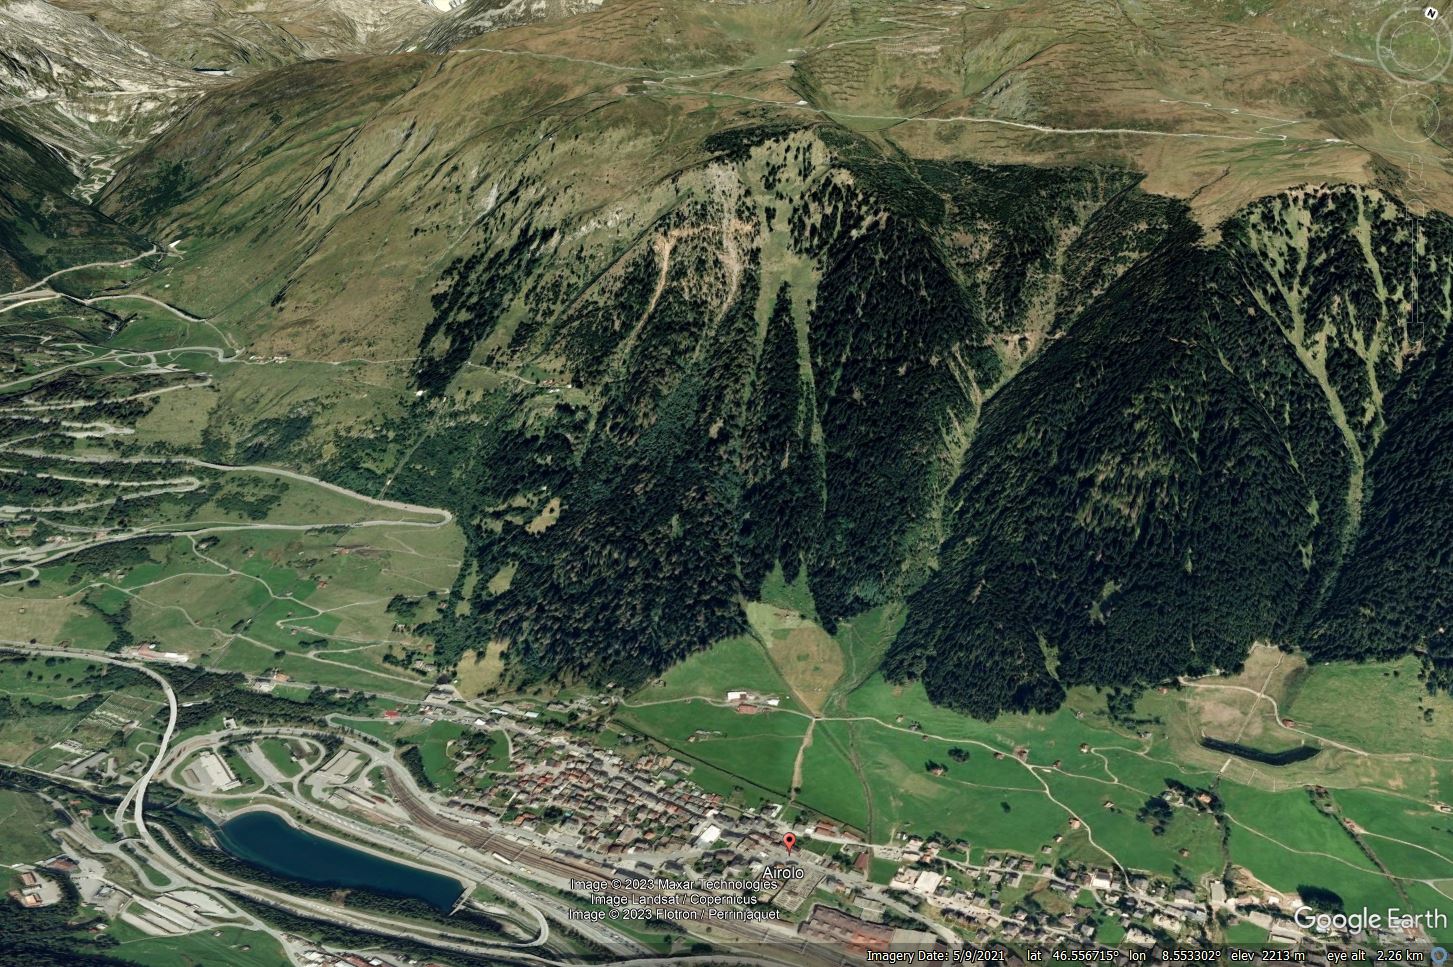
Google Earth image of the site of the 27 December 1898 Sasso Rosso landslide at Airolo.
.
There are also some postcards showing the aftermath of the landslide, such as this one, which is on sale on the Hip Postcard site:-
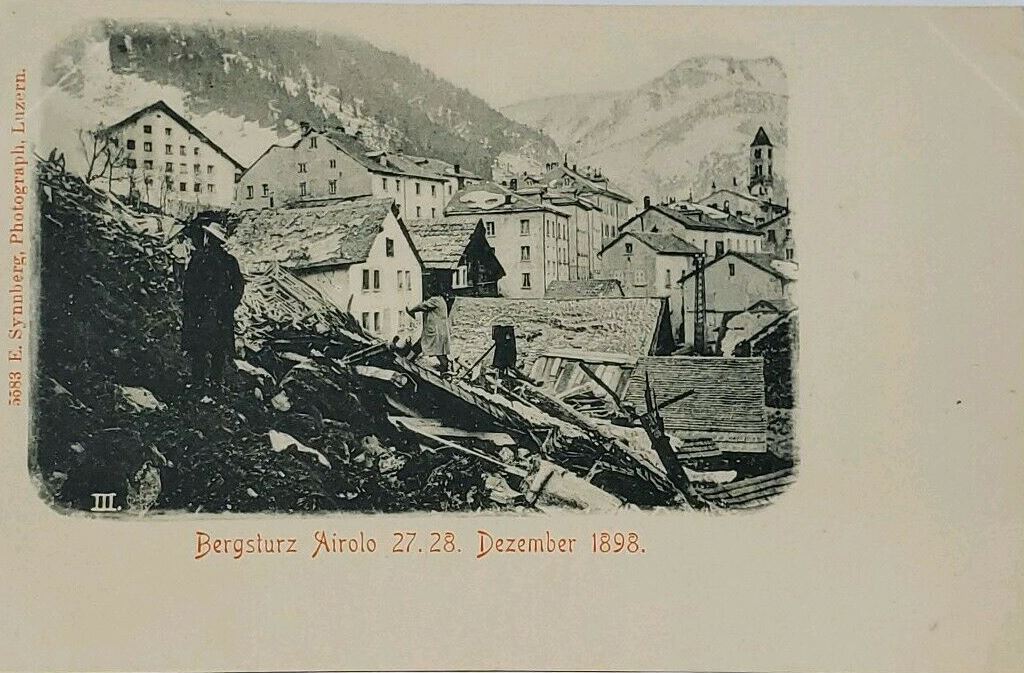
Contemporary postcard showing the aftermath of the 27 December 1898 Sasso Rosso landslide at Airolo. The item is available for sale on the Hip Postcard site.
.
As with Brienz-Brinzauls, the Sasso Rosso landslide came remarkably close to causing much higher levels of damage.
.
Reference
Conedera, M., Bozzini, C., Ryter, U., Bertschinger, T., and Krebs, P. 2018. Using the Monoplotting Technique for Documenting and Analyzing Natural Hazard Events. In: Antunes do Carmo, J.S. Natural Hazards. IntechOpen. Doi: 10.5772/intechopen.77321.
23 June 2023
A new landslide susceptibility map for Central Asia
A new landslide susceptibility map for Central Asia
From the perspective of landslides, Central Asia is a fascinating area of the world. The combination of areas of steep topography and high elevations; frequent, intense earthquakes; and areas of high, seasonal rainfall mean that landslides are frequent. In parts of Central Asia the population has high levels of vulnerability too. However, this is not an area that is intensely covered by western media, and the amount of research that has been undertaken here is also low, meaning that global awareness of landslides in this region is lower than is the case elsewhere.
But, what cannot be denied is there are some spectacular landslides in Central Asia. For example, back in 2020 I described the Imom rockslide; there are many more events of this type.
In this context, it is very welcome to see the publication in Natural Hazards and Earth System Sciences of a new article (Rosi et al. 2023) that provides a new landslide susceptibility map for Central Asia. This is a really good piece of work drawing upon multiple strands of evidence, and correlating the outcome with a database of recorded landslides. This is the resultant map:-
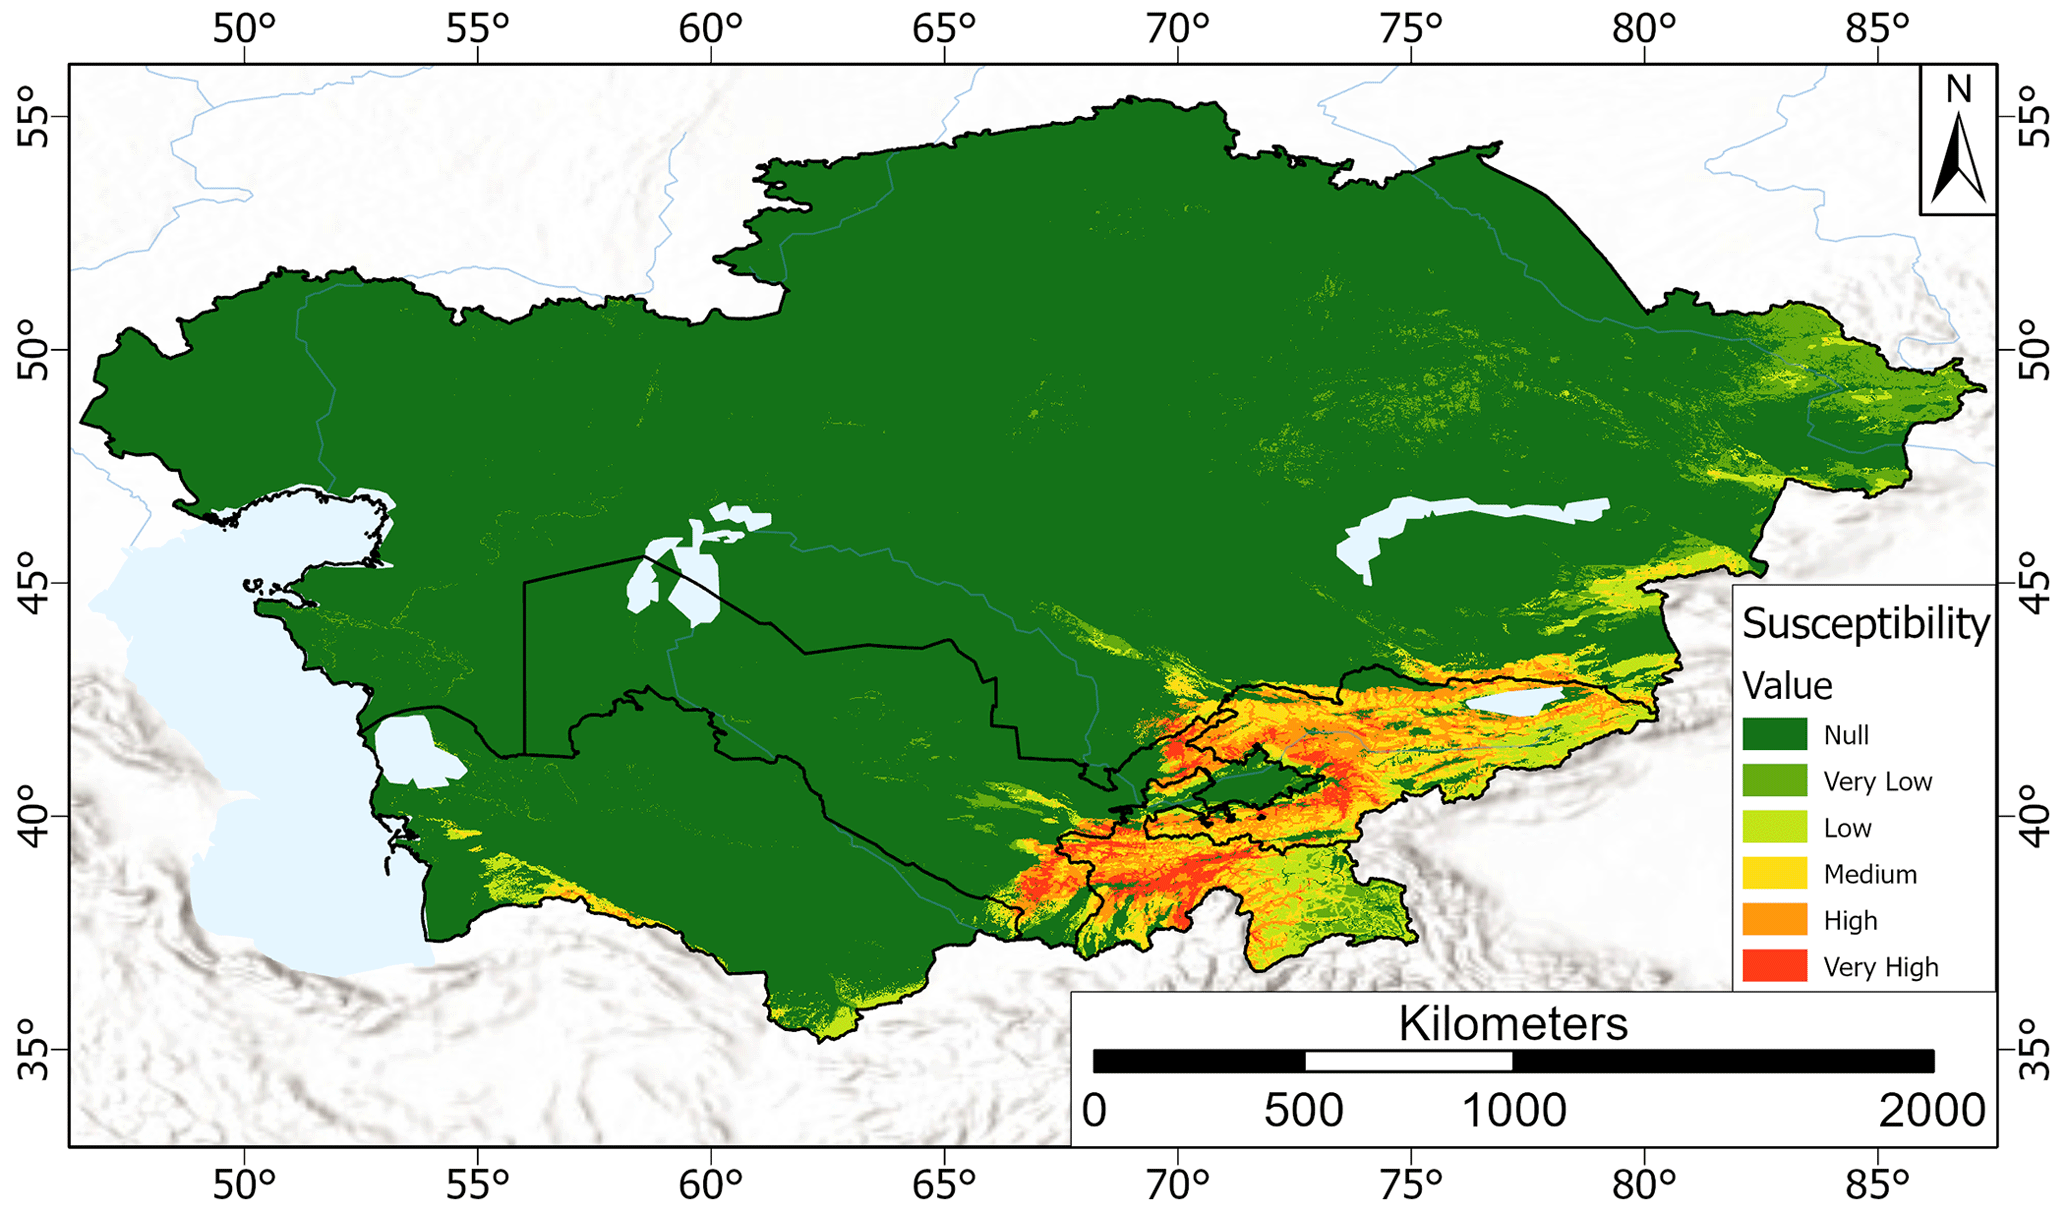
The landslide susceptibility map of Rosi et al. (2023) for Central Asia. The source of the base map is Esri, USGS, NOAA.
.
As the map shows, the southeast corner of the map is most heavily affected by landslides. Rosi et al. (2023) provides a higher resolution map of this area – the black dots are mapped landslides:-
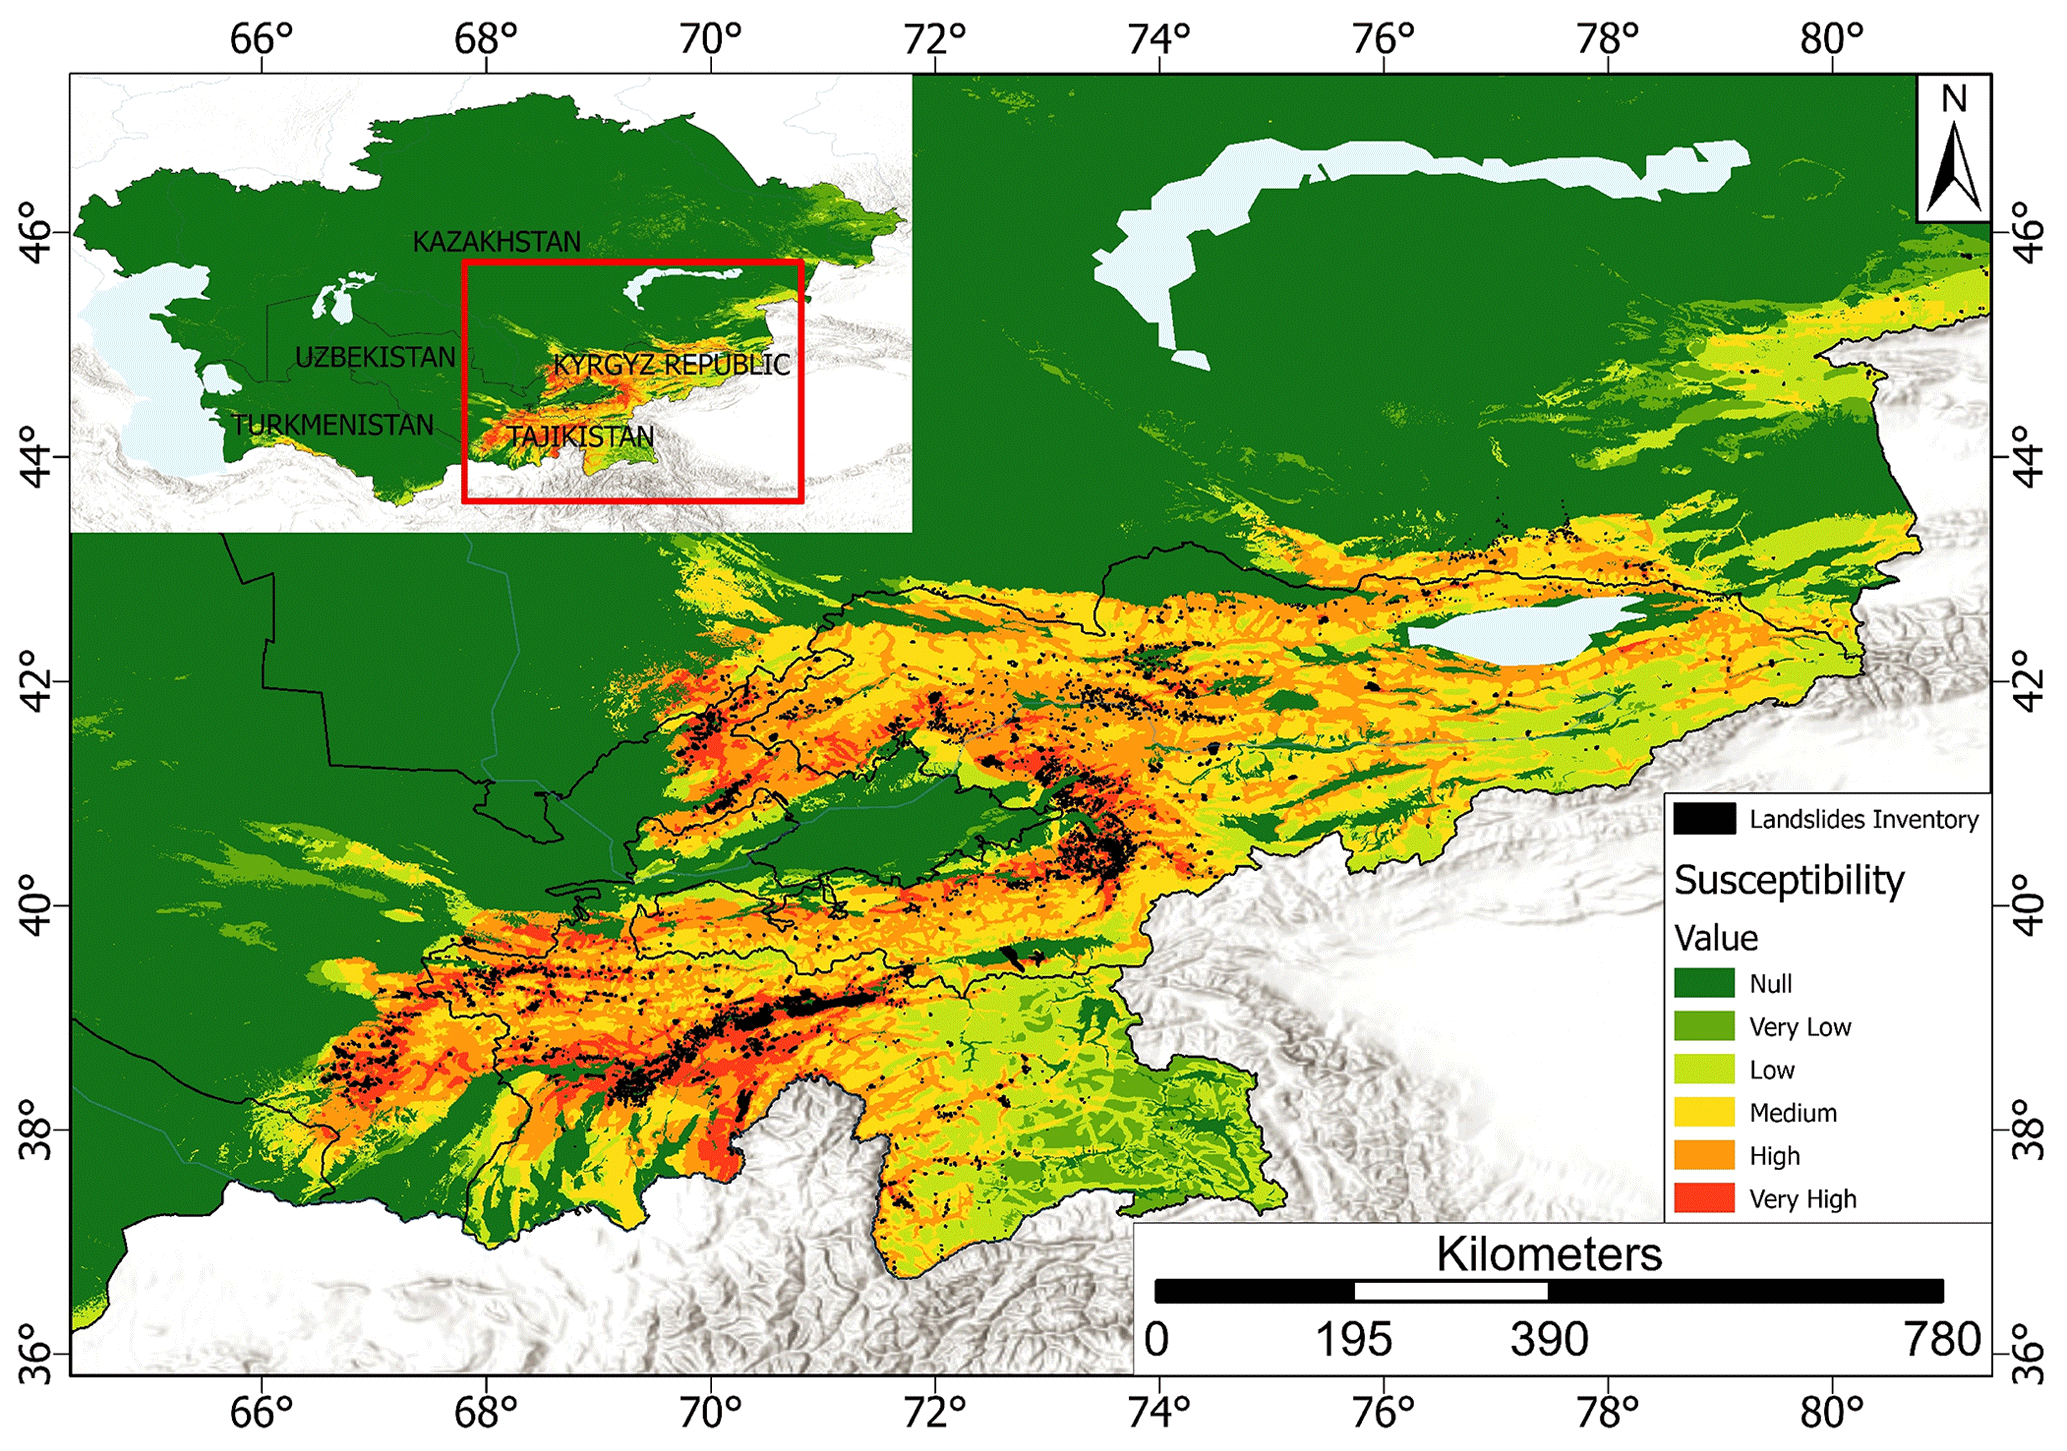
The landslide susceptibility map of Rosi et al. (2023) for a part of Central Asia. The source of the base map is Esri, USGS, NOAA.
.
The map was developed as part of a World Bank funded project. The information it contains should be useful for land use planning and for disaster prevention.
.
Reference
Rosi, A., Frodella, W., Nocentini, N., Caleca, F., Havenith, H. B., Strom, A., Saidov, M., Bimurzaev, G. A., and Tofani, V. 2023. Comprehensive landslide susceptibility map of Central Asia. Natural Hazards and Earth System Sciences, 23, 2229–2250, https://doi.org/10.5194/nhess-23-2229-2023.
21 June 2023
Summary of the 15 June 2023 Brienz/Brinzauls rockslide collapse in the Swiss Alps
Summary of the 15 June 2023 Brienz/Brinzauls rockslide collapse in the Swiss Alps
Guest post by:
Simon Loew, ETH Zurich, Department of Earth Sciences, 8092 Zuerich, Switzerland
Andreas Huwiler, Amt für Wald und Naturgefahren, Kanton Graubünden, Chur.
Stefan Schneider, CSD ENGINEERS Ltd., Thusis.
Andri Largiader, Amt für Wald und Naturgefahren, Kanton Graubünden, Chur.
Christoph Nänni, Tiefbauamt, Chur
Daniel Figi, Reto Thöny, BTG AG, Sargans
Michael Josuran, CSD ENGINEERS Ltd., Thusis.
The village of Brienz/Binzauls in the Swiss Alps [46.6688, 9.5953] was evacuated between 9 and 12 May 2023, which triggered world-wide attention in most news channels, and broad interest in the landslide causing this evacuation. The village of Brienz/Brinzauls is situated on an old deep-seated mountain slope deformation extending from Piz Linard (2,767 m asl) to the Albula river (900 m asl), and which is tectonically located in an Alpine stack of nappes and imbricates from the North Penninic and Austroalpine domain (Figure 1).
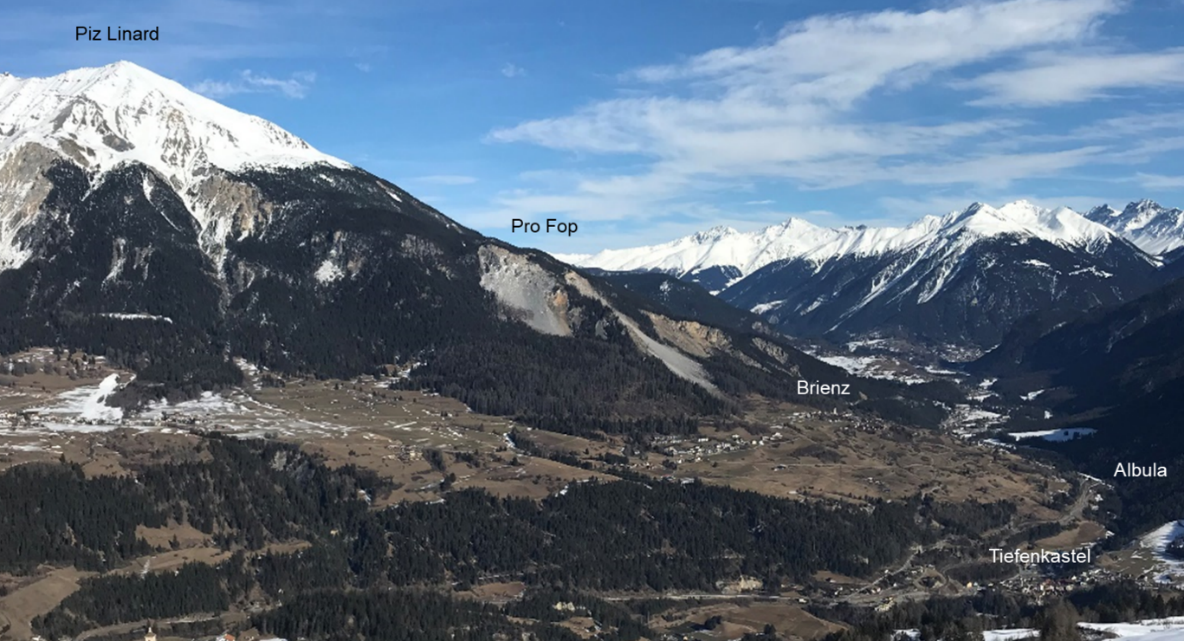
Figure 1: View of the Brienz deep-seated mountain slope deformations and active landslide complex (looking east) between Piz Linard and Albula River. The “Insel” compartment is located below Pro Fop.
.
The currently active compartments (moving at rates larger than 0.1 m/year) of this landslide complex have a total volume of about 170 million m3. Detailed mapping of morpho-tectonic surface structures and 15 double and triple tube cored boreholes reveal a complex structure and multistage landslide history since at least the last 13,000 years, forming a series of stacked compound rock slides, debris slides and earth flows. Since summer 2022 the most rapid compartment was identified in a steep convergent slope directly above the village of Brienz, extending between an elevation of of 1,400 masl and 1,700 masl. This compartment, termed “Insel” (Island), is composed in the upper reaches of dip-slope dolomites (Vallatscha Fm.), and in the toe region of rauhwackes, dolostones (Raibler Fm.) and interbedded marly schists (Allgäu Fm.) dipping with low angles into the slope. This compartment is interpreted as a compound suspended rock slide, with a volume of about 2 million cubic metres and a depth of about 50 m (Figure 2).
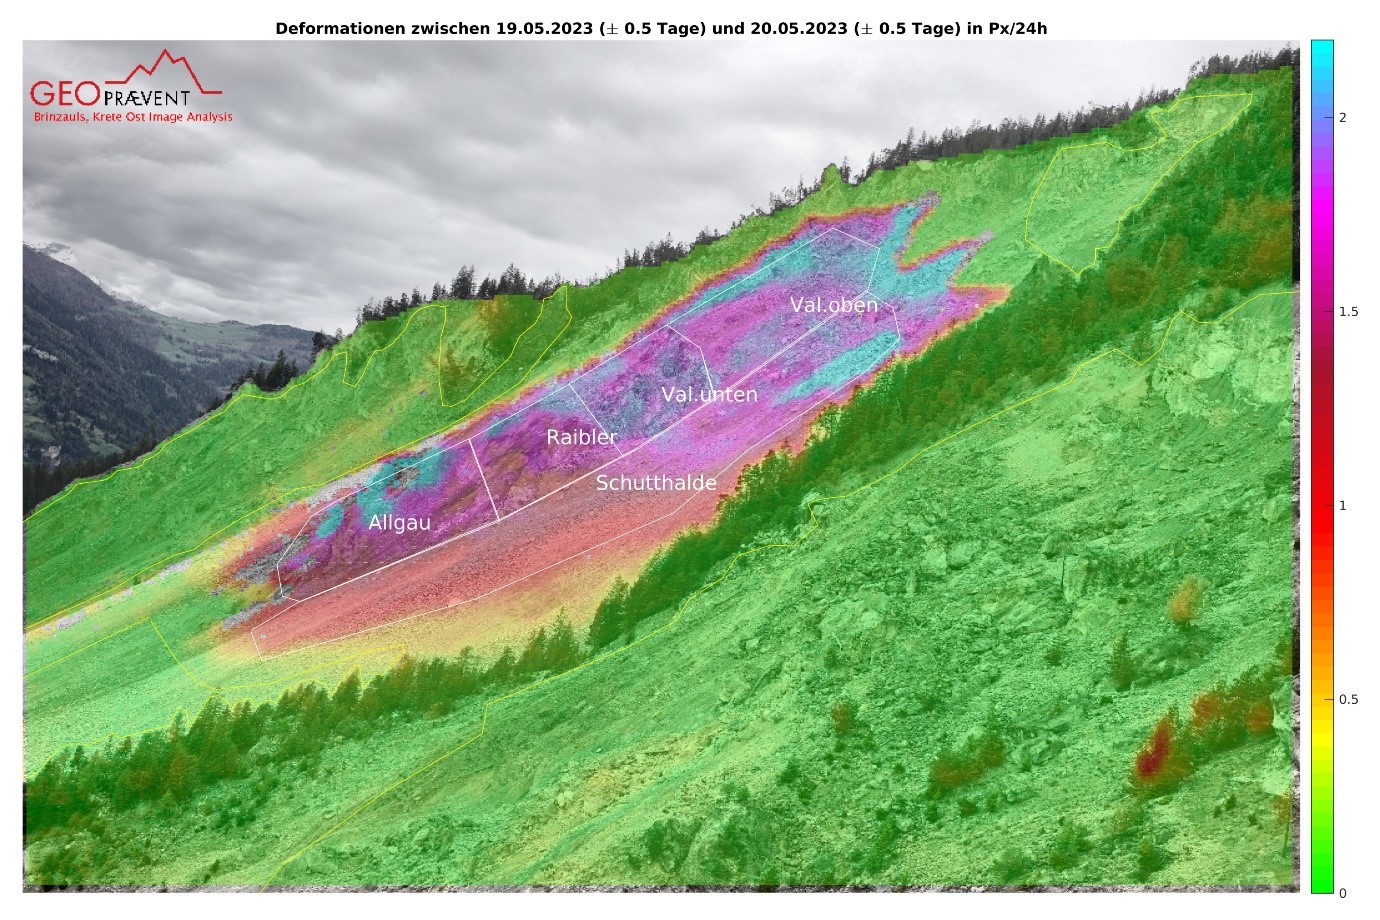
Figure 2: Digital Image correlation from time-lapse camera East looking towards West into “Insel” compartment, composed of Vallatscha dolomites, Raibler dolomites and rauhwackes, and Allgäu schists. Red line marks preliminary schematic interpretation of rupture surface and displacement vector dip angles. Displacement rates in pixel per day between 19 May and 20 May 2023.
.
In September 2022 the key scenarios for the “Insel” compartment had been identified as (i) accelerated sliding with increased rock fall activity (60%), (ii) transformation into a moderately rapid debris slide (30%), and (iii) transformation into a very rapid rock avalanche (10%). A very comprehensive monitoring and early warning system has been in place since 2011, and today includes 1) one Synthetic Aperture Georadar, 2) one Doppler radar, 3) one Robotic Total Station, 4) two Time-Lapse Cameras (TLC) with automated Digital Image Correlation (DIC) processing, 5) several Webcams, 6) two Seismic Stations from SED, 7) several Climate Stations, 8) fourteen permanent GNSS Stations, 9) periodic LiDAR, optical drone/helicopter flights and GNSS measurements. A final detailed protocol for early warning data interpretation and alarm threshold values was established in March 2023.
Acceleration of the “Insel” compartment was observed since 2018. Figure 3 shows the displacements along line-of-sight (LOS) and 24h-averaged velocities in the period between October 2022 and May 2023. Since March it could be observed that the entire compartment moved more or less coherently as an internally strongly damaged block, and the dip angles suggesting that the basal rupture plane had been fully developed.
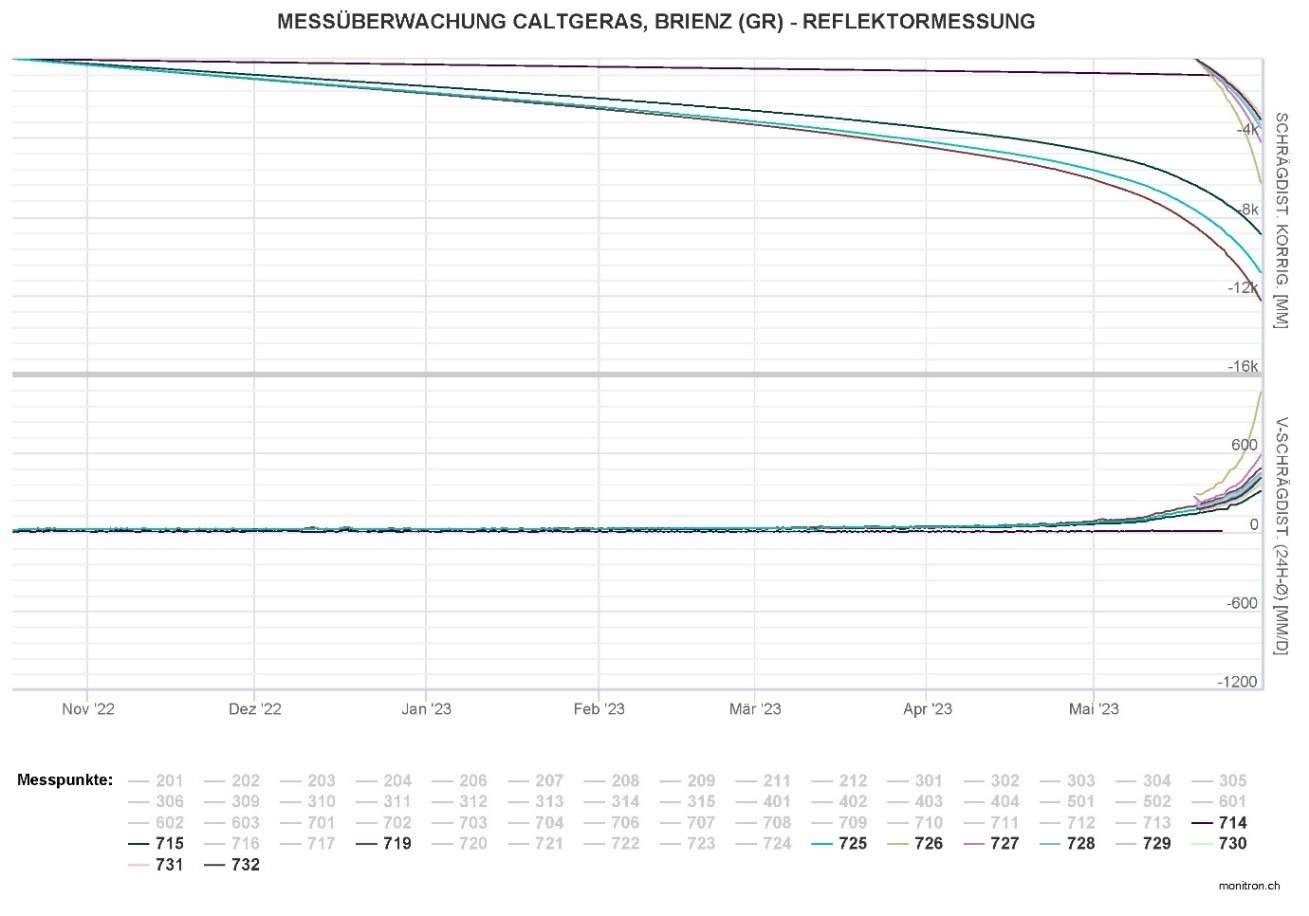
Figure 3: TPS 24-h velocities and displacements along LOS between October 2022 and May 2023
.
As shown in Figure 3 these velocities have been very high (compared to other brittle rockslides) since the beginning of May (>100 mm per day) reaching cumulative displacements since October of 8-12 m. During the same period the footprint of the active “Insel” compartment, as recorded by the ground based synthetic aperture radar, was growing in WE direction and towards South (Figure 4 and 5). However, it remains unclear if this growth reflects displacements of adjacent colluvial deposits or a deepening and widening of the bedrock rupture surface.
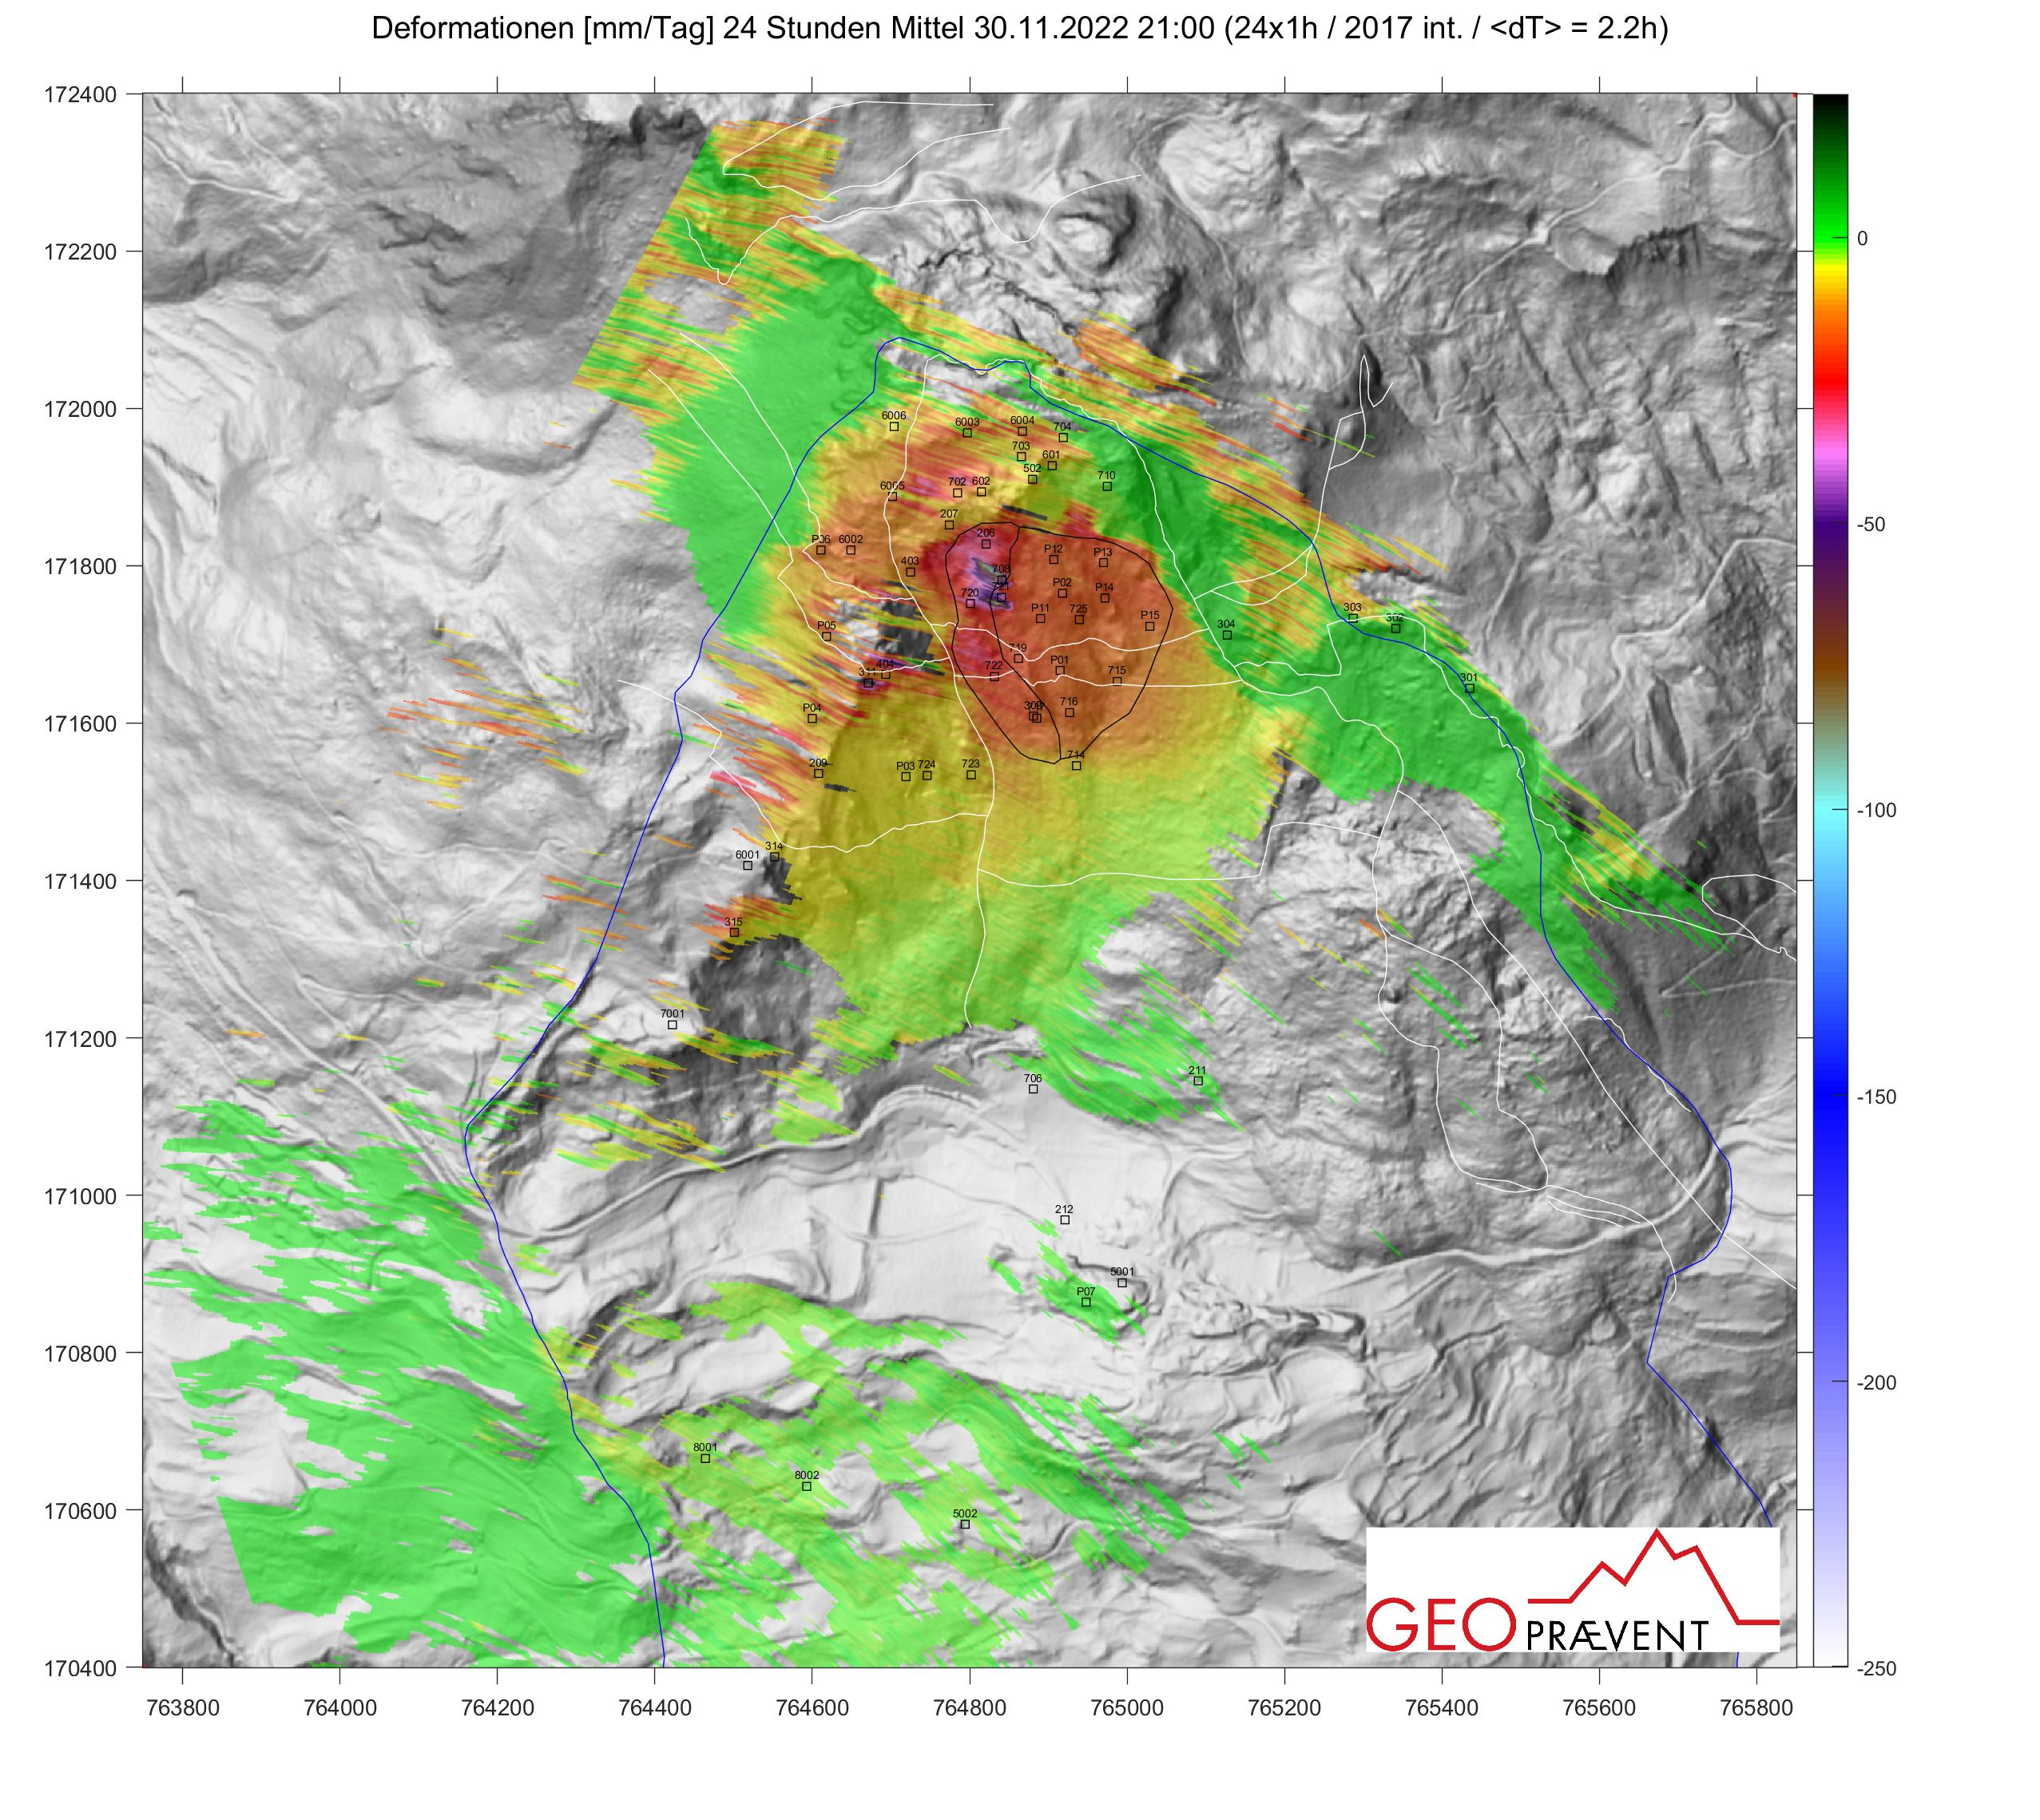
Figure 4: Map view of LOS Displacements on November 30, 2022 from Georadar 24h-AIM Interpretation
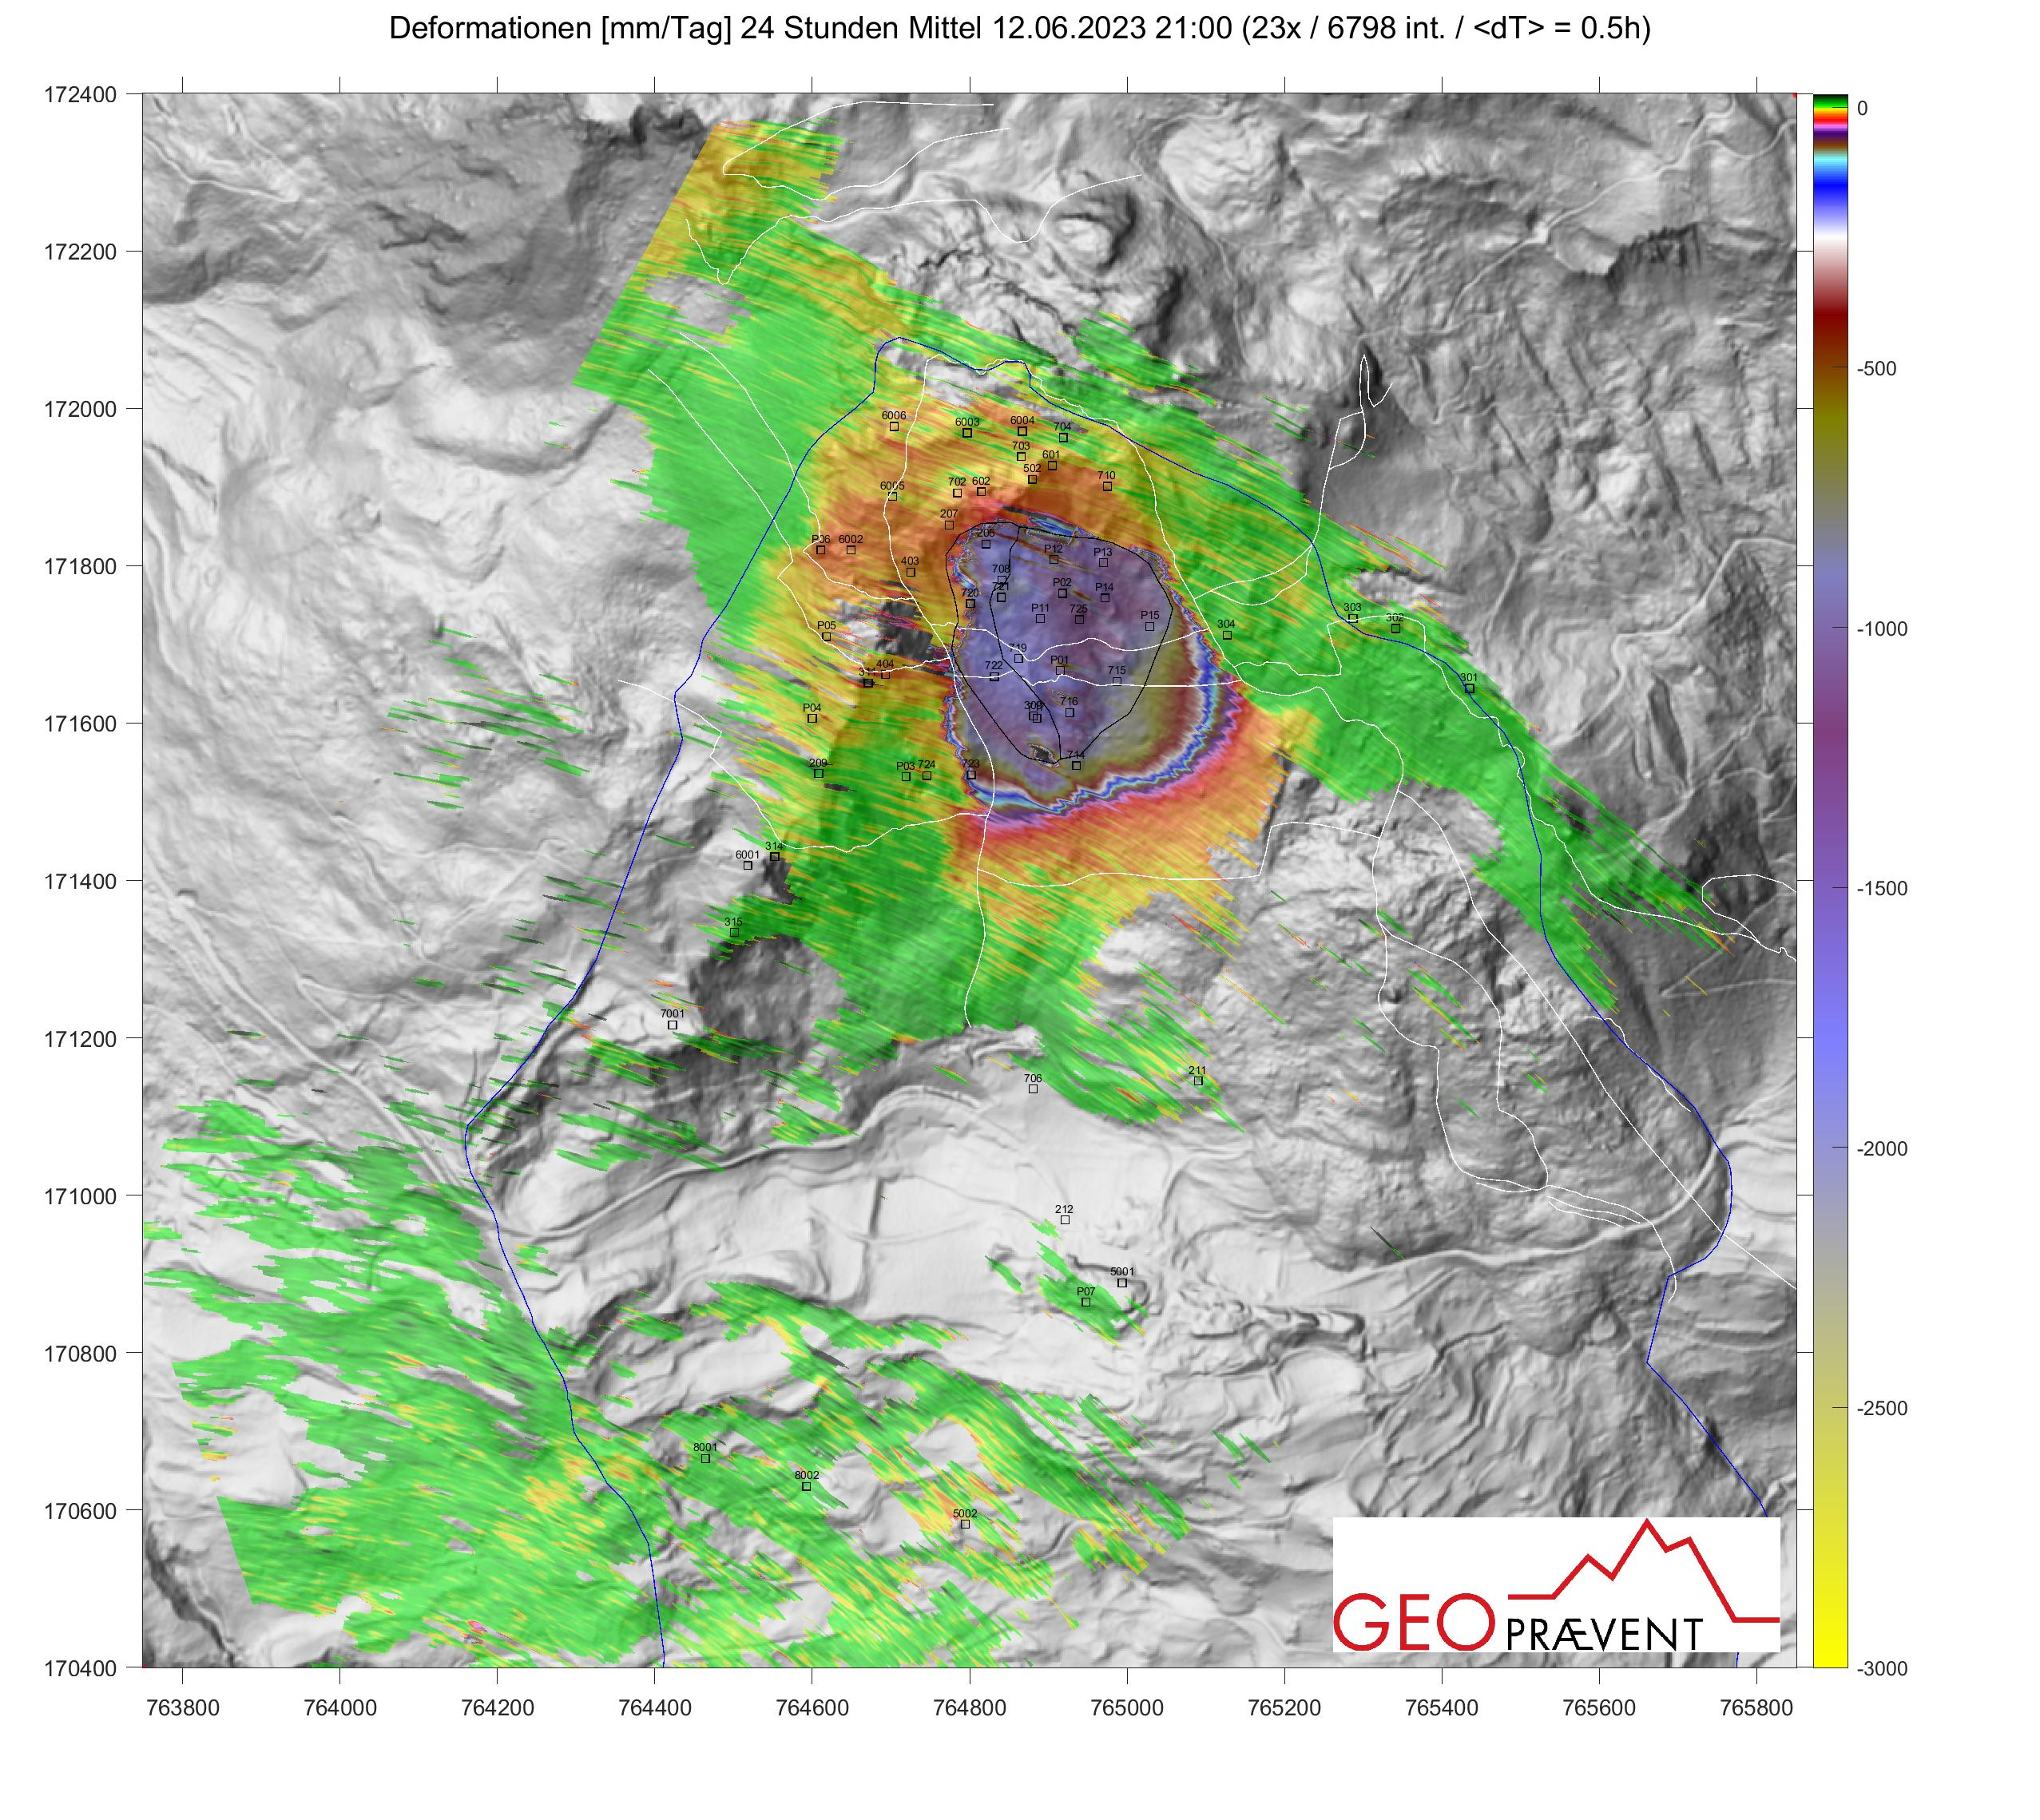
Figure 5: Map view of LOS displacements on June 12, 2023 from Georadar 24h-AIM interpretation.
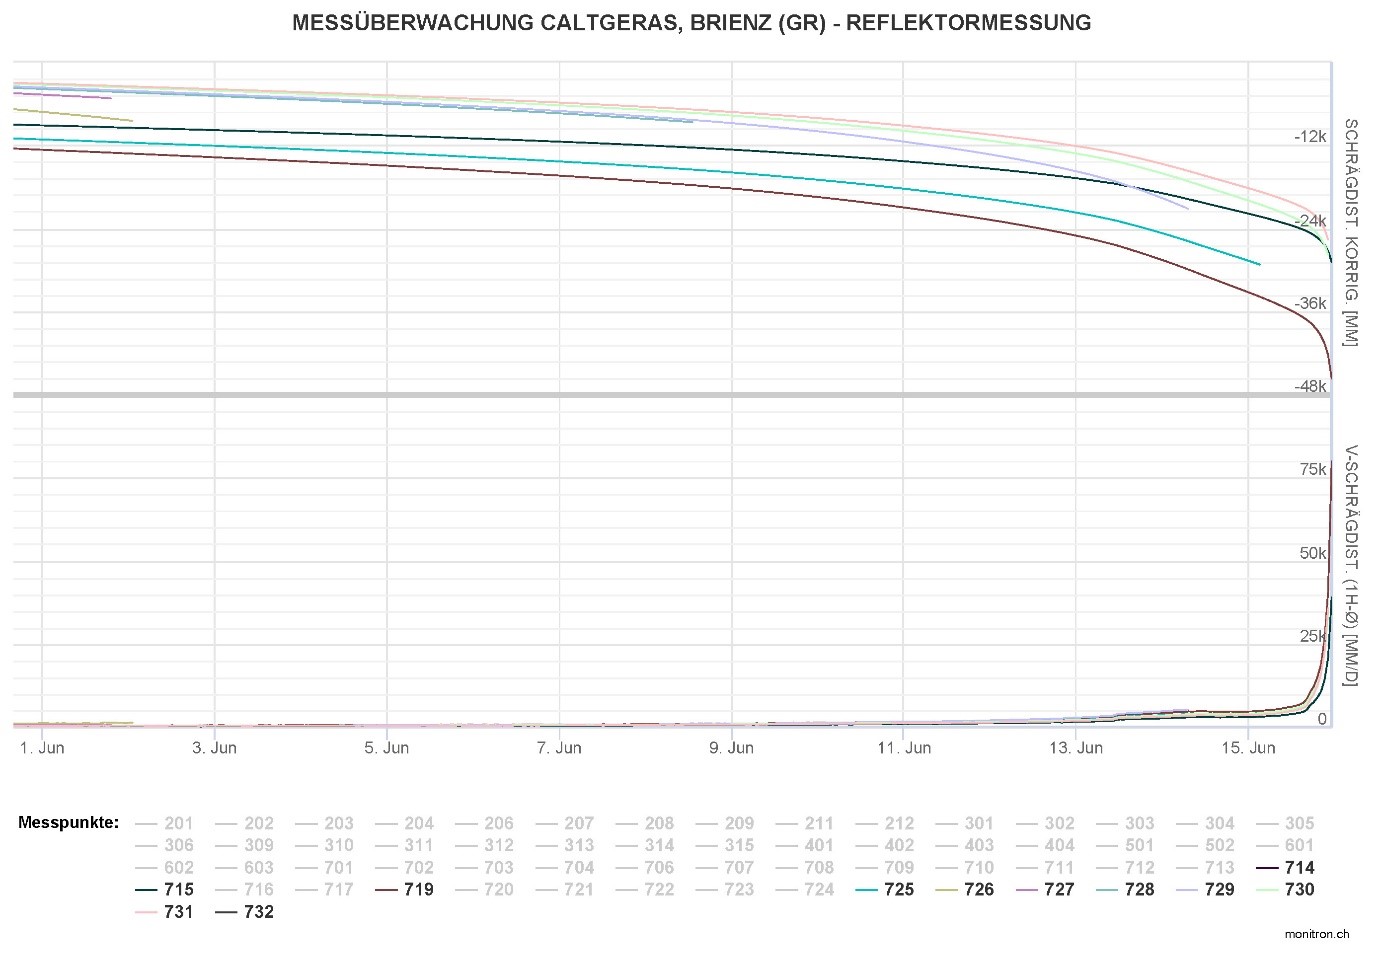
Figure 6: TPS 1h-velocities and displacements along LOS in June 2023.
.
At least since May 2023 the landslide velocity and acceleration could not be reliably modeled with the classical Voight’s model (or an inverse velocity plot). All predictions of future velocities and time to failure had to be continuously revised because the “Insel” compartment velocity did not evolve as predicted by this model and the velocity exponent alpha of Voight’s law changed continuously. This was attributed to the complex nature of the suspended rockslide, composed of materials with strongly diverse mechanical properties and structure. It is currently hypothesized that the compartment dynamics since March 2023 was driven by a superposition of rate-strengthening plastic sliding along cataclastic breccia forming the basal sliding plane in the Allgäu schists, and progressive strength degradation of the Vallatscha dolomites of the compound slide mass. The water table is expected to lie below the basal rupture plane; no water seepages and no significant reactions to rainfall events could be observed. On the other hand, secondary slope failures (mainly from the head scarp and toe) and high-frequency rock fall events correlated with significant short-term variations in compartment velocity, suggesting a high sensitivity of slide velocity to minor changes in force balances.
In June accelerations further increased leading to velocities of up to 80 m/day before the compartment collapsed on 15 June 2023 (Figure 6). In the three days before the failure the head scarp progressively exposed at the bottom a fresh and several meter high sliding surface across the entire width of the “Insel” compartment. On 15 June, at 3.37 pm local time, a substantial part of the buldging toe in the Allgäu Fm. collapsed. Starting around 10 pm, nearly permanent rock fall, sliding and rolling activity created permanent noise audable across the entire valley, interrupted by a massive noise around 23.30 pm, which sounded like an “airplane crash”. This activity continued until about 5 am in the morning of June 16, 2023.
The last hourly TPS recordings were made at 11 pm and most TPS reflectors were destroyed between 23.35 pm (landslide head) and 23.38 pm (landslide toe). Georadar data (GeoPraevent, courtesy Johannes Gassner) suggest a final massive acceleration starting at 23:28 with decorrelations occurring between 23:36 and 23:39 pm. After 23:41 pm the Georadar displacements started to stabilize again. This observation is supported by seismic data (Swiss Seismological Survey, courtesy Donat Fäh) and Doppler radar data (GeoPraevent, courtesy Susanne Wahlen) suggesting that the “Insel” compound rockslide collapsed at 11.36 pm local time. This collapse must have triggered one or several immediate very rapid and large rockfall events, which nearly reached the northern village boundary. Subsequent mobilization of debris, possibly as debris slides and secondary rock falls, lasted several hours.
The estimated volume of displaced mass amounts to 1.2 million cubic metres, the vertical elevation change in the main depletion area below the head scarp amounts to 50 m, and the thickness of deposits reach up to 25 m (SLF, courtesy Yves Bühler). Only about 80% of the “Insel” compartment collapsed and the remaining sector in the east moves today with velocities of up to 100 mm/day. Figure 7 shows the view from the TLC Est on June 16, 2023. Figure 8 and 9 show details of the depletion and accumulation areas, correspondingly; the front of the relatively fine-grained deposits nearly reached the village (35 m distance to the school building). Detailed investigations of the “Insel” compartment pre-failure kinematics and dynamics, the post-failure sequences of events, and the remaining hazards and risks are underway.
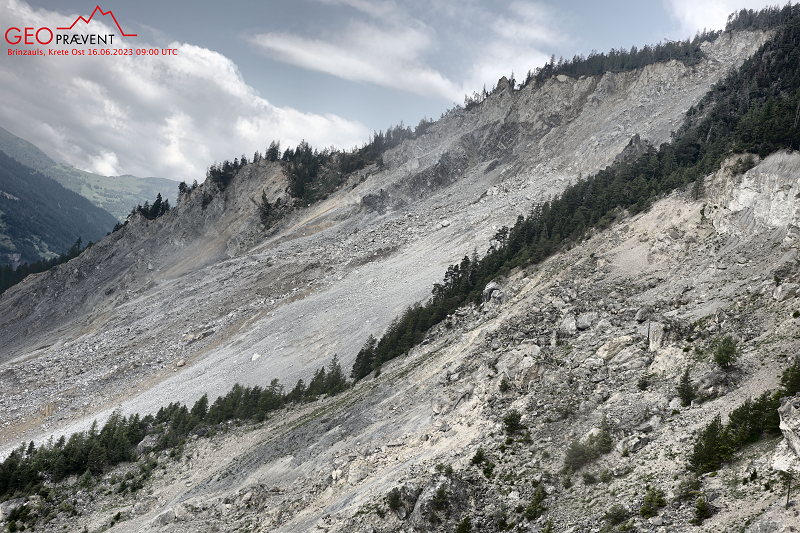
Figure 7: View of the “Insel” compartment depletion area after the collapse (TLC East from 16 June 2023, 11.00 local time).
.
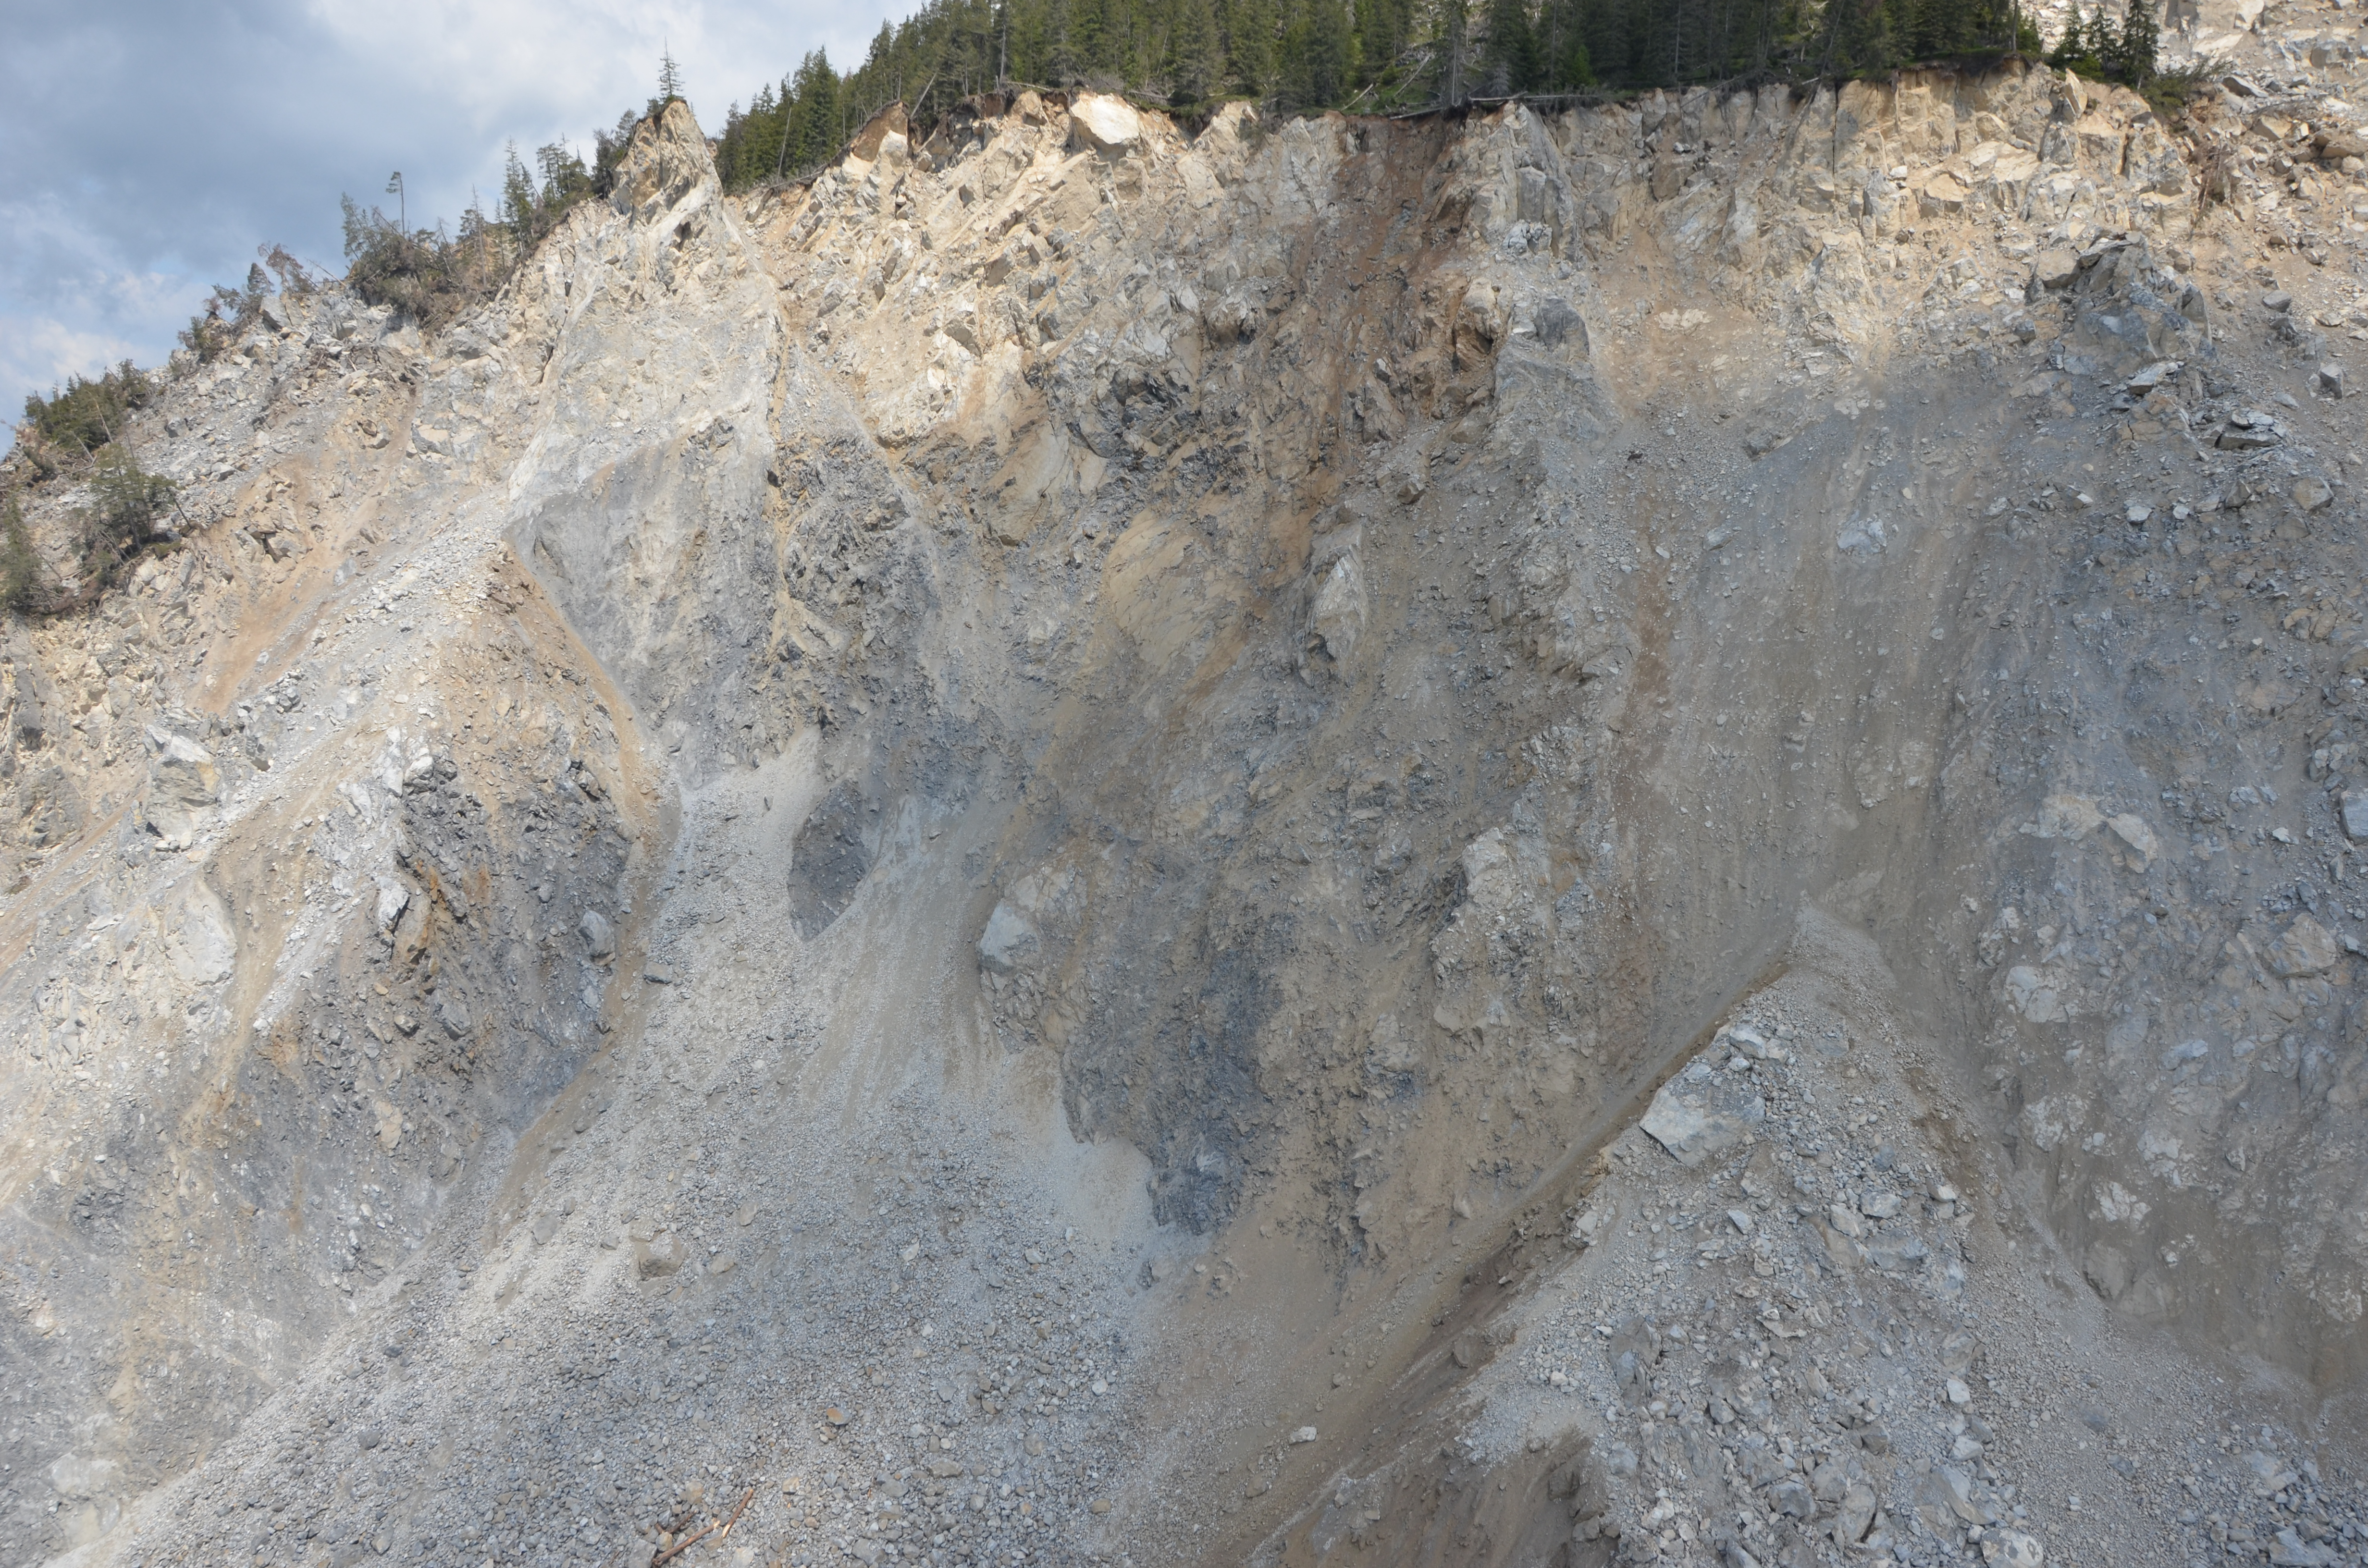
Figure 8: View of the head scarp after slope collapse on June 16, 2023
.
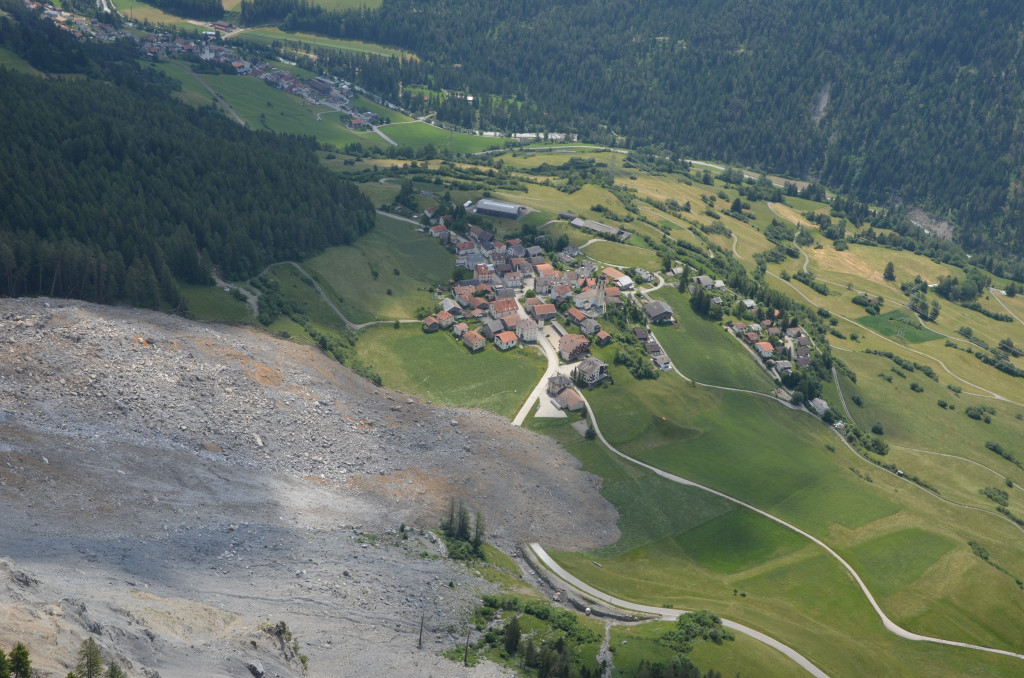
Figure 9: View of the frontal deposition area near Brienz/Brinzauls village on 16 June 2023.
 Dave Petley is the Vice-Chancellor of the University of Hull in the United Kingdom. His blog provides commentary and analysis of landslide events occurring worldwide, including the landslides themselves, latest research, and conferences and meetings.
Recent Comments