11 March 2019
What does climate sound and look like?
Posted by Shane Hanlon
By Dr. L.S. Gardiner
We’ve developed a new exhibit, called Sounding Climate, that uses sound and images to represent modeled temperature, precipitation, sea ice and carbon dioxide data. The exhibit, installed at the National Center for Atmospheric Research (NCAR) in Boulder, Colorado, helps public visitors explore data on an interactive touchscreen to understand anthropogenic climate change and natural variability.
The idea for this exhibit was born four years ago, on a snowy Saturday in February, when climate scientist Dr. Clara Deser was at the NCAR Mesa Lab with about a hundred singers from a local women’s chorus. A member of the chorus herself, Clara wanted to help her fellow singers learn about climate change. As she was describing her research to the lab full of singers, she realized that music could be a powerful tool for sharing science.
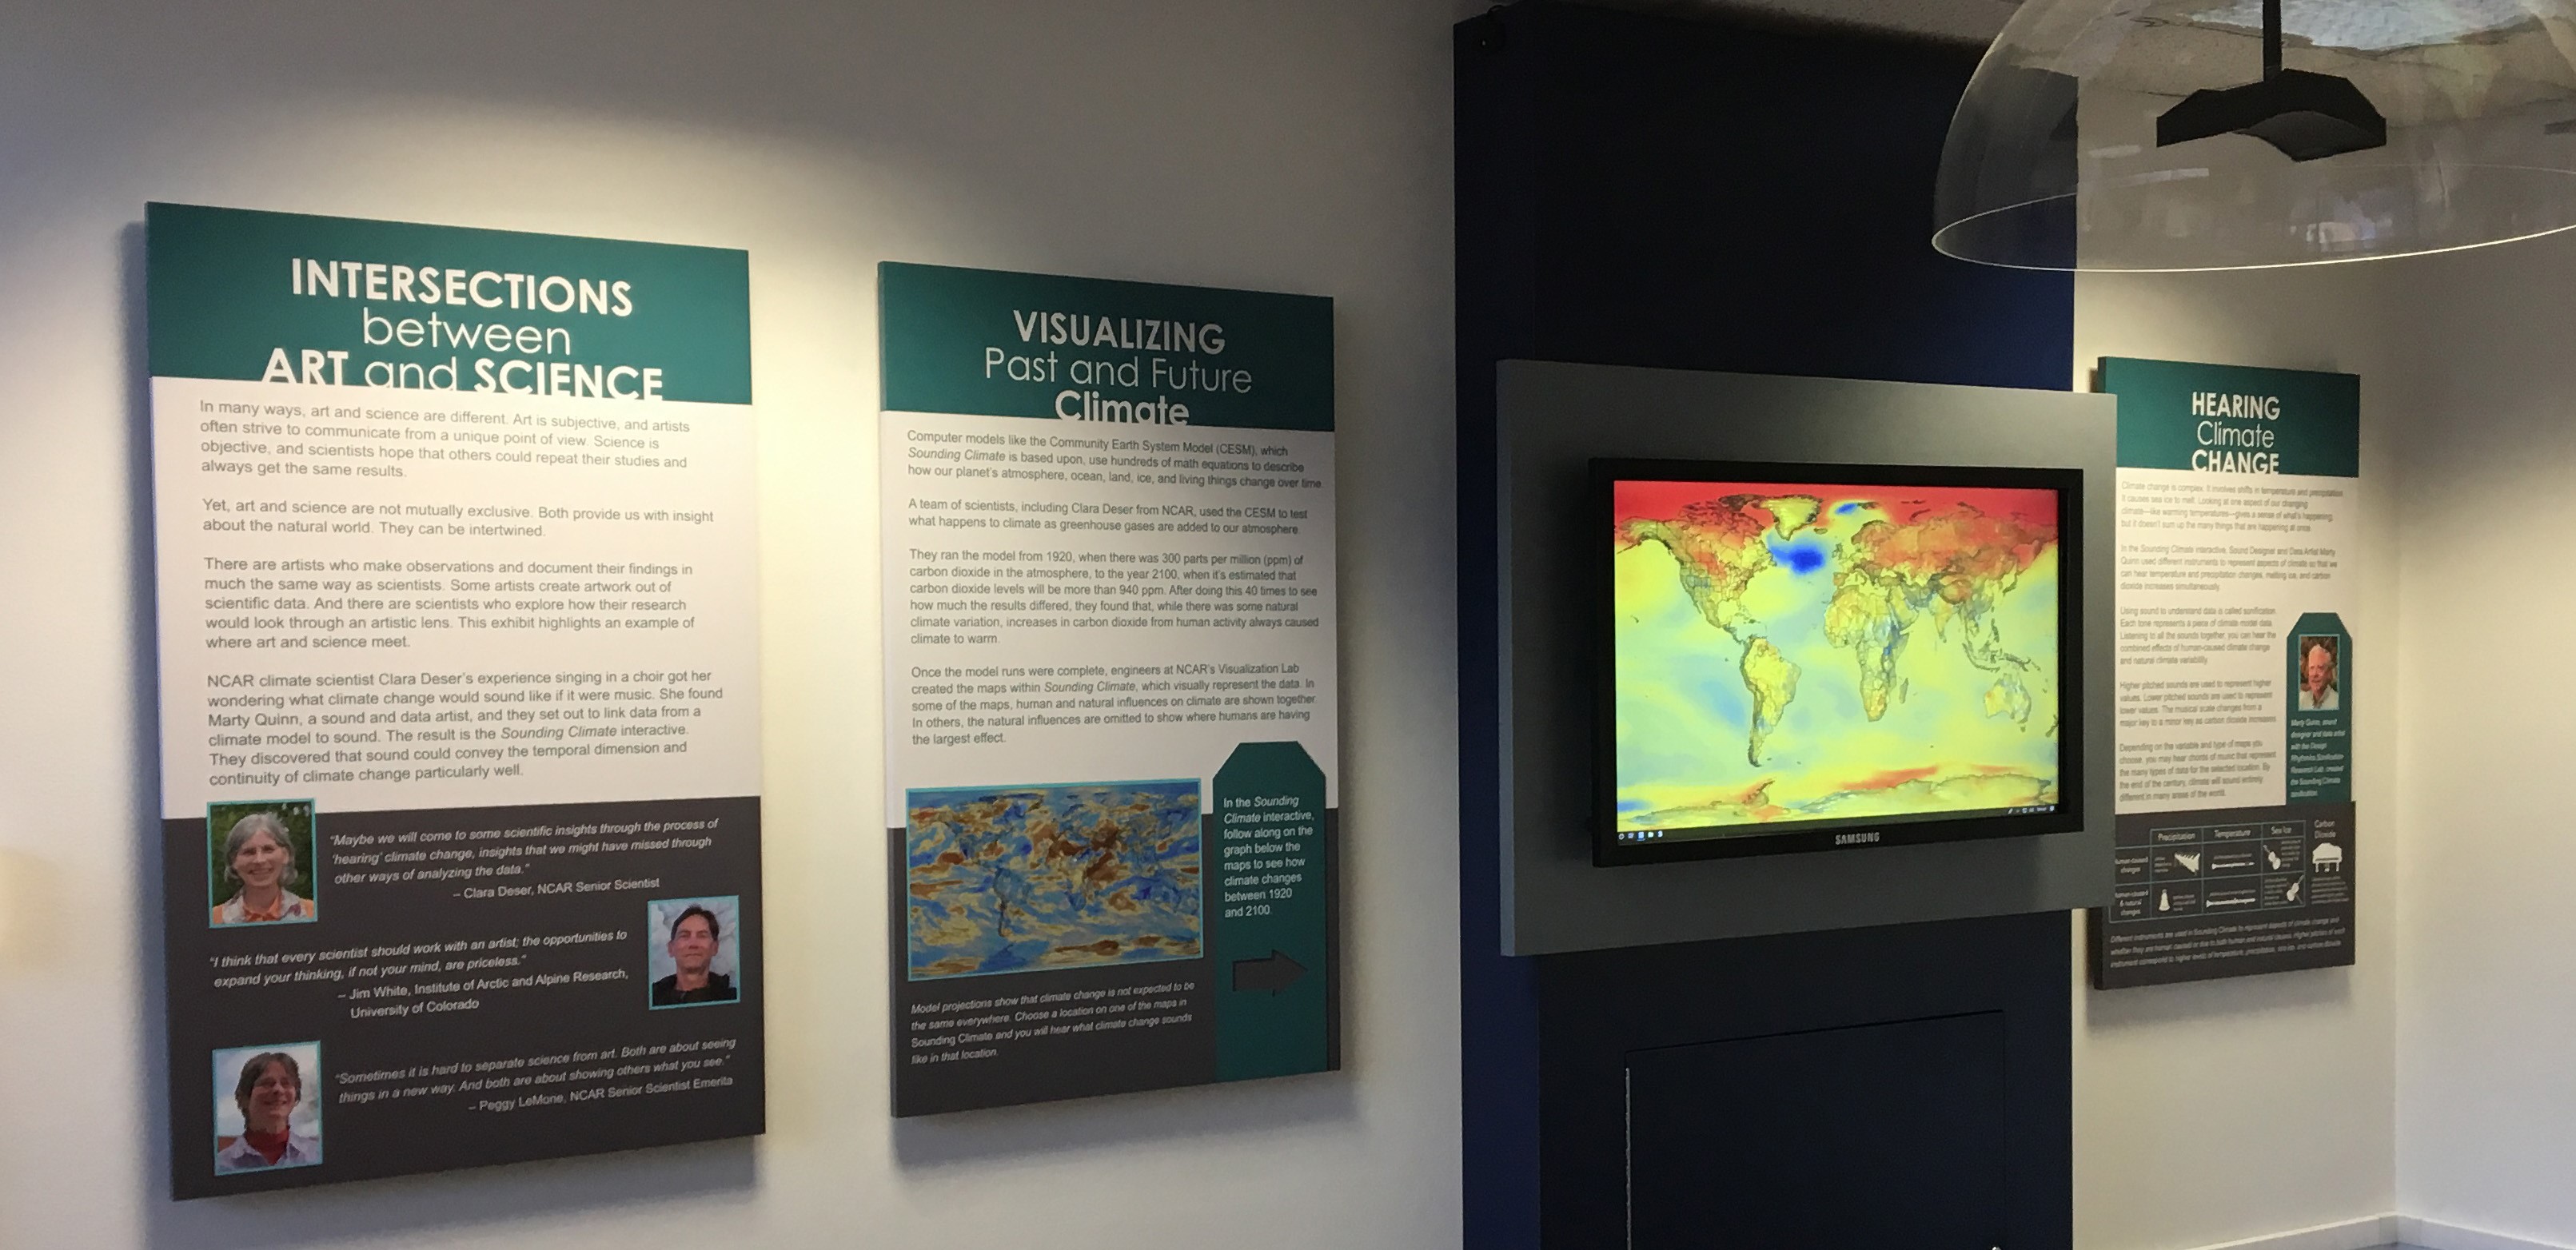
The Sounding Climate exhibit at the National Center for Atmospheric Research in Boulder, CO. Credit: L.S. Gardiner, UCAR
“They really made me recognize that the arts are an incredibly important way to communicate other disciplines, and, in this case, science,” said Clara, recounting how she started thinking about using music to communicate climate change.
Around the same time that Clara invited the chorus to NCAR, she and colleagues were preparing to publish the Community Earth System Model (CESM) Large Ensemble Project, which simulated climate from 1920 to 2100 in forty model runs to examine climate variability and change.
Curious about what the climate data would sound like, Clara contacted Marty Quinn, a sound designer and data artist. They collaborated to create a sonification – using sound to represent the climate data. Adding the efforts of scientists, artists, visualization experts, educators, writers, a programmer, graphic designers, and exhibit fabricators, the sonification that Clara and Marty created has become the Sounding Climate exhibit at NCAR.
By linking model data to sound, visitors hear musical instruments that represent different aspects of climate (temperature, precipitation, carbon dioxide, and sea ice). The notes played by each instrument depend on the data values. Higher pitched sounds are used to represent higher values. Lower pitched sounds are used to represent lower values. The musical scale changes from major to minor as carbon dioxide increases.
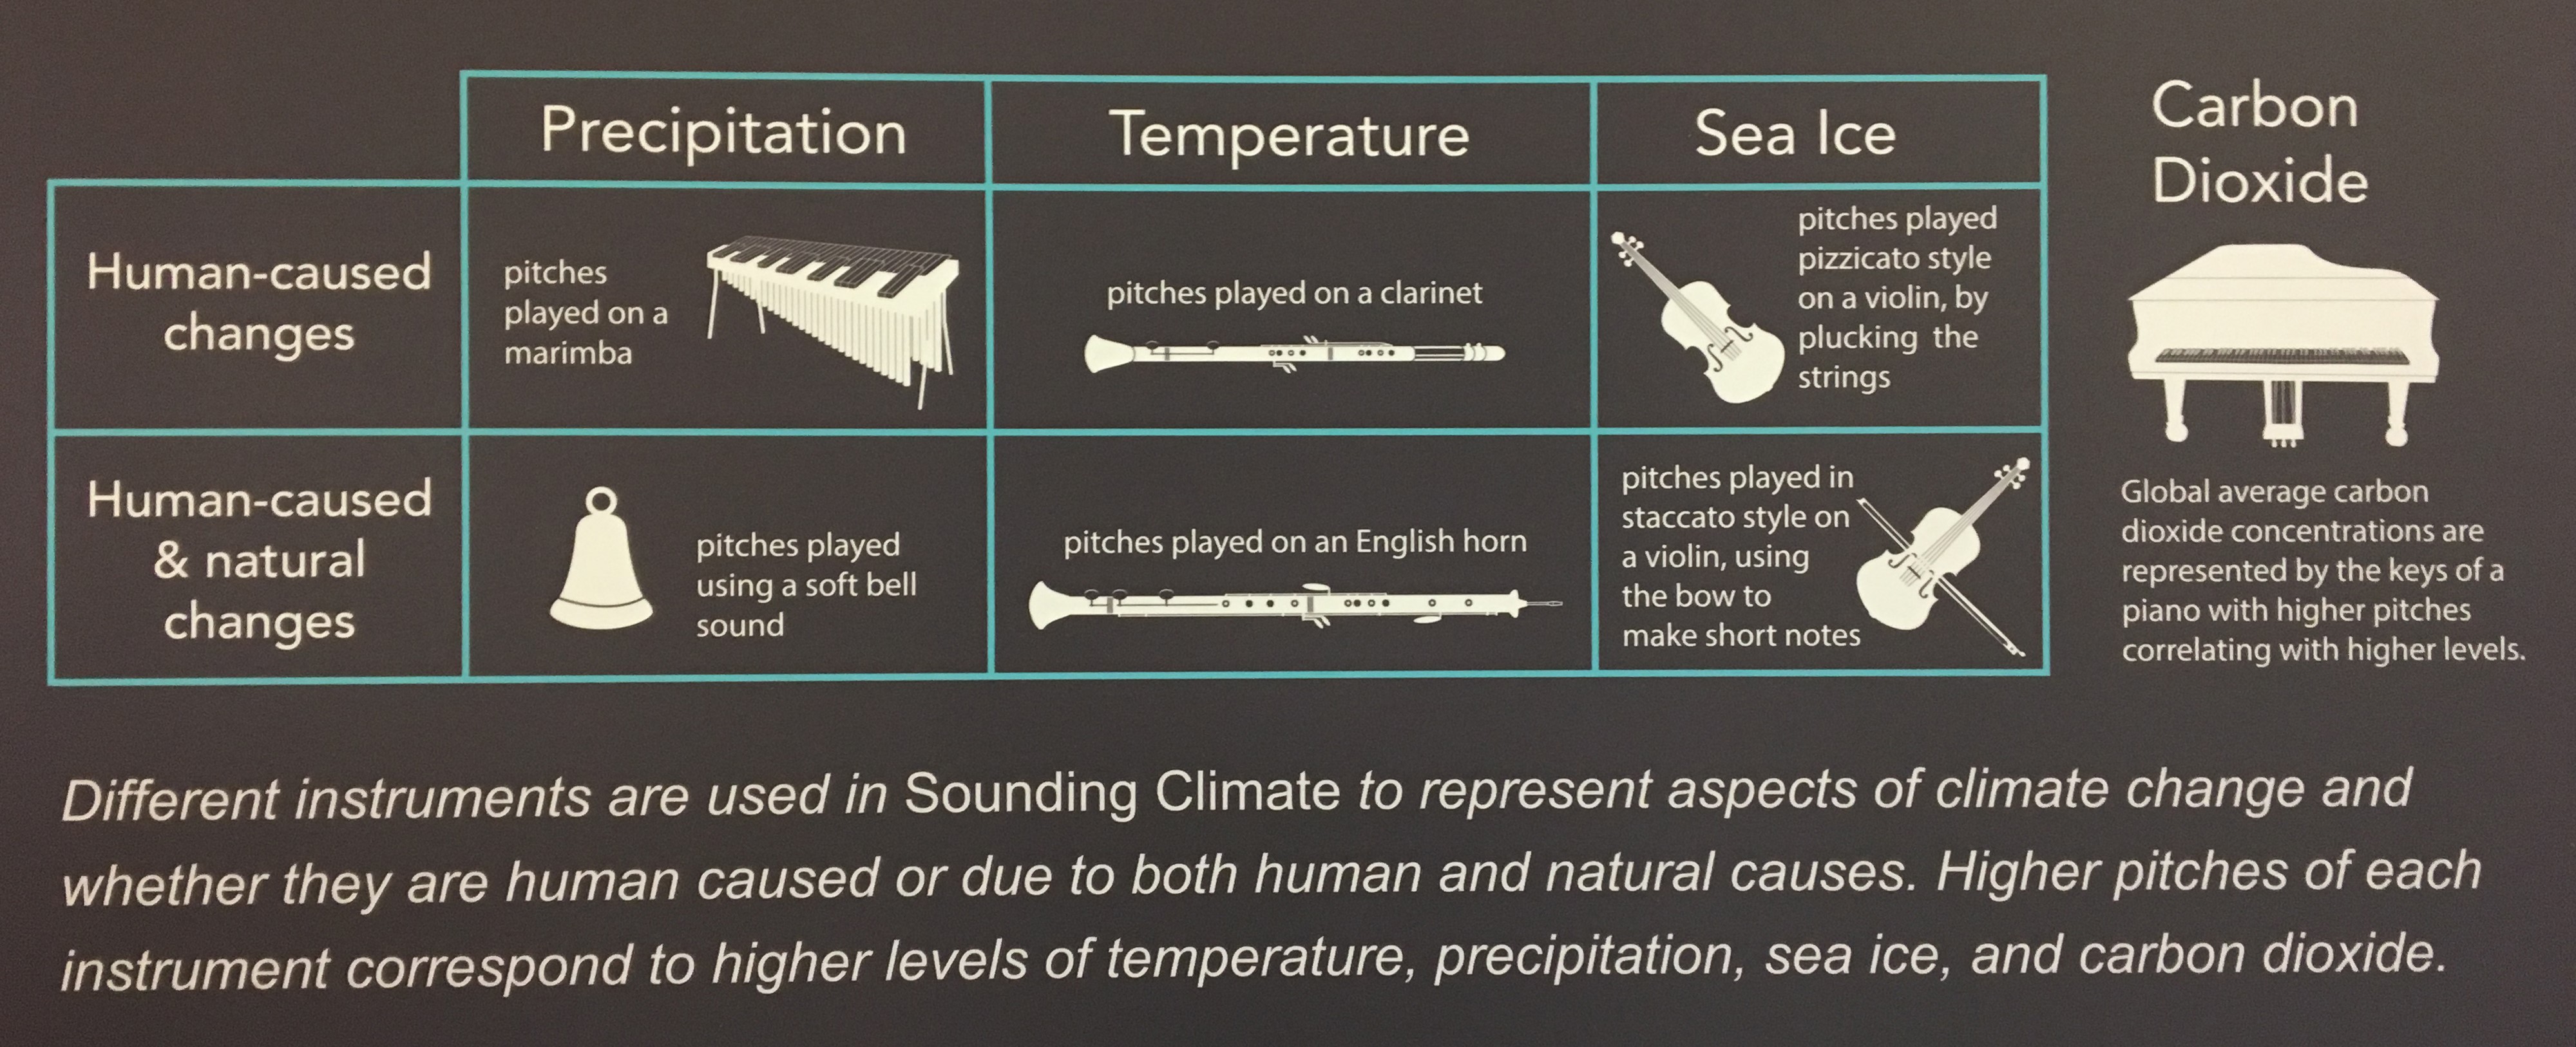
The sounds table. Credit: L.S. Gardiner, UCAR
Sounding Climate also includes animated map-based visualizations of the model data created by data visualization experts at NCAR. The maps provide geographic context and make the entire data set visible while the audio plays for a particular location.
Interpreting data as sound through sonification can be a powerful tool for understanding complex datasets and we’ve found that it is especially helpful for conveying the temporal dimension of climate change.
“It’s something that is creeping up on us and it’s accelerating and it’s not going away,” Clara noted about what it feels like to hear climate change. “Over time, you start to get the sense that you’ve actually entered a whole new type of climate and climate variability that we haven’t actually witnessed in our lives.”
– L. S. Gardiner, PhD MFA is a science educator, writer, and illustrator at the UCAR Center for Science Education in Boulder, Colorado
 The Plainspoken Scientist is the science communication blog of AGU’s Sharing Science program. With this blog, we wish to showcase creative and effective science communication via multiple mediums and modes.