
3 April 2019
The complexity of the timing of rockfalls
The complexity of the timing of rockfalls
A decade ago the research team that I led at the University of Durham undertook a study of rockfall activity on the North Yorkshire coast in the UK (see for example Rosser et al. 2015). In this work we used terrestrial laser scanning on a monthly cycle to detect rockfall locations on high coastal cliffs. The work was fascinating, arduous and intriguing. We found huge numbers of rockfall events, but given the comparatively long intervals between the scans we really struggled to understand the controls on the temporal occurrence of the rockfall events.
A paper just published in the journal Geomorphology (Matsuoka 2019) describes high resolution monitoring of a natural rock slope high in the southern Japanese Alps, with the intention of understanding these controls. This is a fabulously thorough piece of work, using a remote camera, debris traps, rock temperature, rock moisture and automated weather stations that collected records of air temperature, wind, precipitation and suchlike. The quality of the data yielded by this study is superb – for example, this is the annual record of rockwall retreat, rock temperature, rock moisture, air temperature and precipitation:
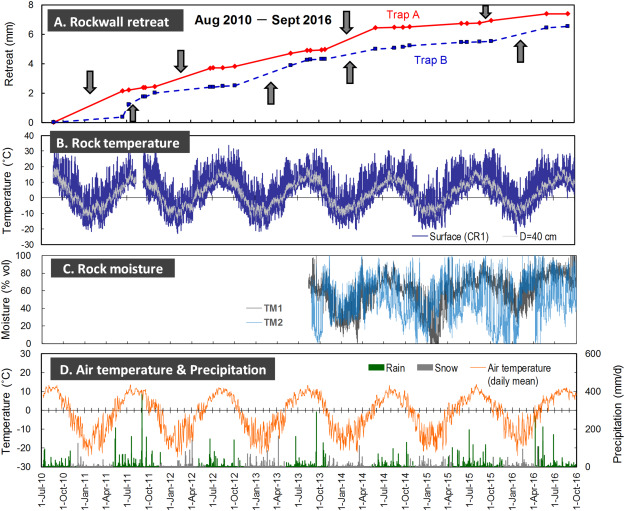
“Six years (2010–2016) of rockfall dynamics at the Aresawa headwall, from Matsuoka (2019). (A) Cumulative rockwall retreat derived from debris traps. Arrows indicate relatively rapid erosion. (B) Rock temperatures at the surface (crack-top) and 40 cm depth. (C) Rock moisture contents given by the relative values between the maximum and minimum records during the first two years (2013–2015). (D) Daily mean air temperatures and daily precipitations recorded at the weather station. The precipitation are classified into rain and snow using time-lapse images. Note that the amount of snow is not precise.” [This is a lightly edited version of the author’s caption].
For reference, this is a Google Earth image of the slope that was monitored, on the Aresawa headwall on the southeast side of Mount Ainodake:-
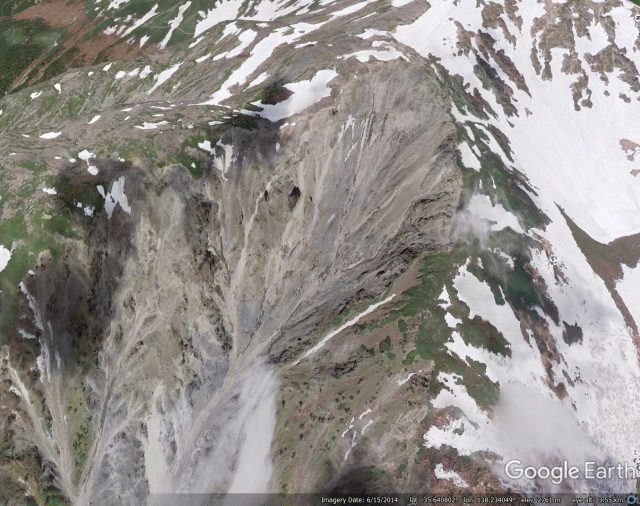
Google Earth image of the monitored slope on Mount Ainodake in Japan.
.
The top graph shows the rate of erosion (retreat) of the rock slope as rockfalls have occurred. This was determined by capturing sediment in traps at the foot of the slope. If the rock face area is known, then the sediment volume provides an average rate of retreat over the entire surface over the time period between the measuring period. In reality, the rate of retreat for any given point will vary considerably, controlled by the timing of specific rockfall events.
It is perhaps unsurprising that the data is complex. But Matsuoka (2019) found that there were five key processes that control the generation of rockfall events:-
- Inevitably, heavy rainfall events triggered significant rockfalls. These rainfall events occurred in the summer and early autumn;
- Lighter rainfall events led to increased moisture levels in the rock face. If this was followed by cold conditions that induced shallow freezing, rockfalls were observed when rapid thawing followed. These events occurred in spring and autumn;
- Similar events to (2.) occurred in colder periods, when the precipitation fell as snow;
- Thaw after deep winter freezing enabled the release of large rock blocks;
- Small rockfalls were enabled by short duration cycles of freeze and thaw, especially in the winter months.
It is interesting that wind did not appear to be a key control. This work emphasises the complexity of rockfall generation. Similar complex behaviour is undoubtedly seen in other settings, such as coastal cliffs, in each case controlled by the prevailing weather conditions. It is the advent of these very high resolution data capture techniques, and the ability to analyse very large, very complex datasets, that is now providing the capability to decode these process properly.
References
Rosser, N.J., Petley, D.N., Lim, M., Dunning, S.A., and Allison, R.J. 2005. Terrestrial laser scanning for monitoring the process of hard rock coastal cliff erosion. Quarterly Journal of Engineering Geology and Hydrogeology, 38 (4), 363-376.
Matsuoka, N. 2019. A multi-method monitoring of timing, magnitude and origin of rockfall activity in the Japanese Alps. Geomorphology. https://doi.org/10.1016/j.geomorph.2019.03.023
2 April 2019
Tsangpo gorge: a first analysis of landslides triggered by the 2017 Ms=6.9 Milin earthquake
Tsangpo gorge: a first analysis of landslides triggered by the 2017 Ms=6.9 Milin earthquake
On 18th November 2017 a shallow Ms=6.9 earthquake struck the Tsangpo Gorge area of Tibet. At the time I used satellite imagery from Planet Labs to show that the earthquake had triggered large numbers of landslides along the Tsangpo Gorge. Some of these were valley blocking, although fortunately the blockages proved to be short-lived. A paper (Hu et al. 2019) in the journal Landslides provides an analysis of the landslides triggered by the earthquake, based on mapping from satellite imagery.
In total, Hu et al. (2019) mapped 766 coseismic landslides, with a total volume of about 31 million cubic metres. Whilst this number seems small, the authors note that mapping with satellite imagery means that many of the smallest landslides will not be identified.
The authors have included the image below in the paper showing the landslides triggered by the earthquake. It is clear that there are clustered around the walls of the Tsangpo Gorge:-
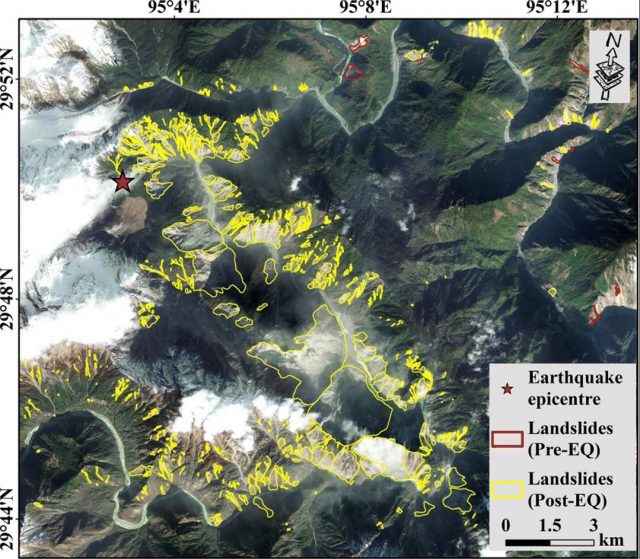
Landslides triggered by the the 2017 Ms=6.9 Milin earthquake in the Tsangpo gorge. Image from Hu et al. (2019).
.
Interestingly, Hu et al. (2019) note that the landslide distribution was dominated by the presence of the deeply-incised, V-shaped gorge rather than proximity to the fault (which is the case elsewhere). Thus, in this case, topography has been the controlling factor in landslide development.
In total, nine valley-blocking landslides developed in the earthquake, although only three lakes formed within the Tsangpo Gorge. These breached within a few days.
The authors highlight the increased likelihood of debris flows in this area in the aftermath of the eaethquake, in common with effects seen elsewhere. Interestingly, they also highlight increased risk of glacial debris flow events in the area. On 17th October 2018 such an event occurred downstream from the earthquake-affected area at Sedongpu. This event, which blocked the Tsangpo to a depth of 80 metres, had a volume of about 33 million cubic metres according to Hu et al. (2019). Ten days later a further glacial debris flow occurred at the same site.
Reference
Hu, K., Zhang, X., You, Y. et al. 2019. Landslides and dammed lakes triggered by the 2017 Ms6.9 Milin earthquake in the Tsangpo gorge. Landslides. https://doi.org/10.1007/s10346-019-01168-w
1 April 2019
Mountain roads in Nepal
Mountain roads in Nepal
One of the major foci in the development of Nepal, as in many poor mountainous countries, has been the construction of mountain roads. The aims are laudable – by providing wheeled connectivity, the roads aim to provide “quicker transportation of goods and better access to employment, education, health care and markets”. But the impacts of roads are complex, with strong evidence that they drive migration and trigger major social changes in the newly connected communities. Not all of these changes are positive.
Whilst I recognise the importance of mountain roads, I have long expressed concerns about the environmental degradation that they cause, using Nepal as a case study. A commentary (Sudmeier-Rieux et al. 2019) has been published in Natural Hazards and Earth System Sciences, which is open access, which examines the issues with mountain road construction in Nepal. The context is the likely convergence between the Chinese Government Belt and Road Initiative and the decentralised approach to development in Nepal, which together are likely to drive the construction of more mountain roads.
Sudmeier-Rieux et al. (2019) note the extraordinary development of roads in Nepal in recent years. In 20 years the local road network (for the most part consisting of mountain roads with minimal engineering, often built by a small team with a bulldozer) has increased by 1200%. In 2011/12, they note that Nepal spent 8% of its national budget on road construction. But, as the authors note, Nepal’s mountain roads “are in a treacherous state, subject to frequent rockfall, landslides and accidents”. The roads lack drainage and slope support, often driving the destruction of irrigation schemes, burying springs and contaminating water supplies, leading to severe losses due to erosion.
The image below shows a typical mountain road in Nepal, illustrating the problem:-
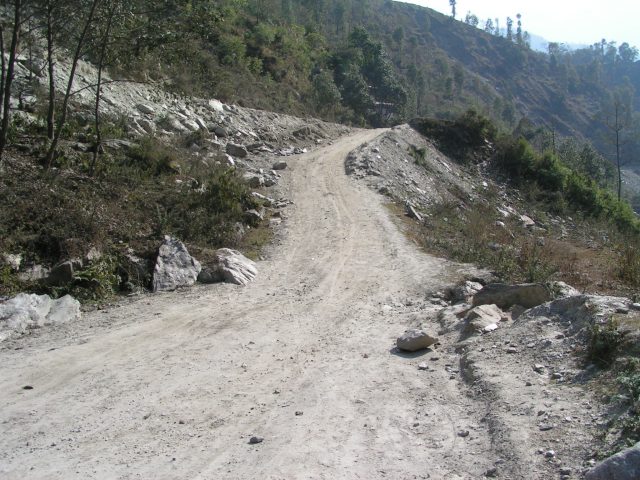
A typical poorly engineered mountain road in Nepal.
.
It is easy to find examples of these impacts of mountain road construction in the Hill Districts of Nepal:-
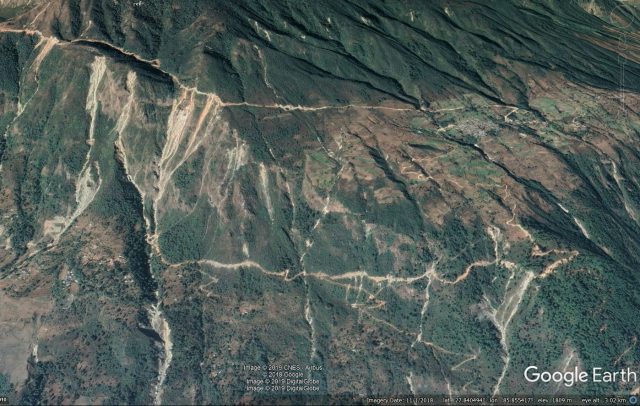
Google Earth images of the environmental impacts of poorly constructed mountain roads in Nepal.
The authors make a strong argument that the problem is political not technical. The engineering techniques exist to make these mountain roads sustainable. Sudmeier-Rieux et al. (2019) argue that the major problems with these poorly constructed mountain roads can be managed if “government policies were enforced to achieve well-established road engineering designs, including basic standards of road grading, alignment, drainage and bioengineering”. They argue that the move to decentralisation of power in Nepal, and the influence of the Belt and Road Initiative, provides the mechanisms to exert this control.
It is hard to disagree. Sadly, I have little confidence that it will happen, and I fear that we will now see a new wave of road construction driving increased landsliding in Nepal, with high levels of loss and more environmental damage.
Reference
29 March 2019
The Mocoa Debris Flow: an analysis of the causes and effects
The Mocoa Debris Flow: an analysis of the causes and effects
Almost exactly two years ago (31st March 2017) the Mocoa Debris Flow killed 409 people (including 76 people whose remains were not recovered) in Putumayo Department, southern Colombia. I wrote about this event at the time, showing that it was the result of multiple small landslides in the upstream catchment, which combined to generate a catastrophic debris flow event that swept through this rural town. The image below shows the aftermath of this landslide – there is an excellent gallery of images on The Atlantic website:-
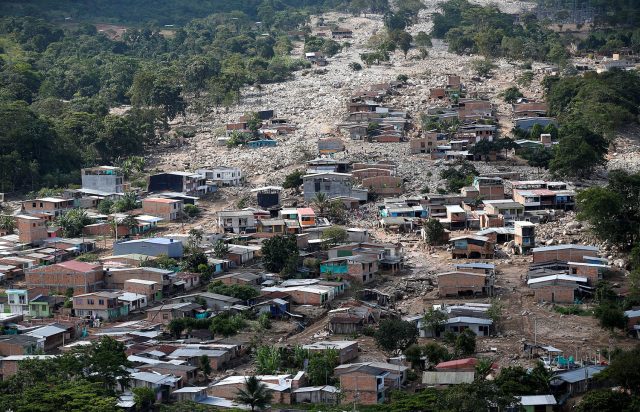
Aerial view of a neighborhood destroyed by the Mocoa Debris Flow on 31st March 2019. REUTERS/Jaime Saldarriaga, via The Atlantic.
.
In a new paper published in the journal Landslides, et al. (2019) have analysed the causes and effects of this devastating event. They have found that the flow was indeed caused by multiple smaller landslides in the upper part of the catchments above Mocoa. These have been mapped – the figure below shows the contributing landslides and the deposit left by the main part of the Mocoa Debris Flow:-
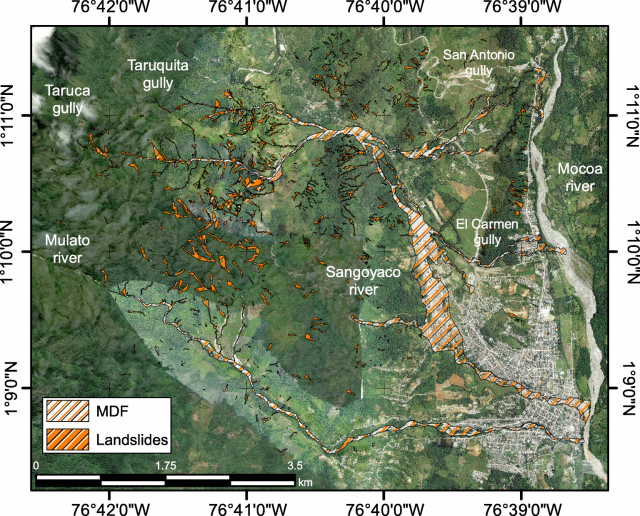
An annotated aerial photograph showing the multiple small landslides and the main track of the Mocoa Debris Flow in 2017. Image from García-Delgado et al. (2019).
.
In total they identified 629 smaller landslides that contributed to the Mocoa Debris Flow, which had a volume of about 3.5 million cubic metres. A key factor in the level of loss was that the town had expanded in recent years towards the west, with many newer residences being built on fan deposits, built up during previous debris flows. Without mitigation measures, this is a high risk recipe. The events of the Mocoa Debris Flow were triggered by a three-hour rainfall event in which about 130 mm of precipitation fell. At the time of the Mocoa Debris Flow pore water pressures were already high as a result of previous seasonal rainfall.
The final factor in the disaster may have been choking of the channels upstream of Mocoa, which allowed larger masses of debris to accumulate and then be released.
Overall, the Mocoa Debris Flow disaster is a salient lesson in the need to manage catchments (García-Delgado et al. 2019 suggest that farming and deforestation may have contributed to the slope instability) and to ensuring that communities do not live on debris flow deposits. As the most intense rainfall events become more common as a result of climate change, the risks from these events are increasing.
Reference
García-Delgado, H., Machuca, S. & Medina, E. 2019. Dynamic and geomorphic characterizations of the Mocoa debris flow (March 31, 2017, Putumayo Department, southern Colombia). Landslides, 16 (3), 597-609. https://doi.org/10.1007/s10346-018-01121-3
26 March 2019
NASA Earth Observatory imagery of the Chimanimani landslides in Zimbabwe
NASA Earth Observatory imagery of the Chimanimani landslides in Zimbabwe
Yesterday NASA posted imagery of the Chimanimani landslides in Zimbabwe, triggered by Cyclone Idai. Last week I highlighted that initial imagery suggested that there had been significant levels of landsliding; the NASA imagery confirms this. The image below shows the landslides around Chimanimani itself, captured with Landsat 8 Operational Land Imager (OLI) instrument:-
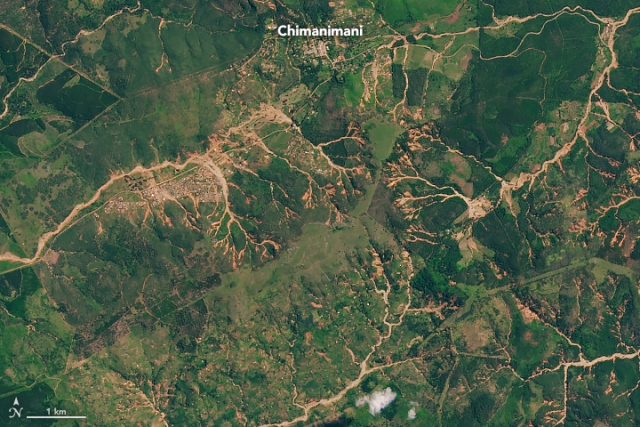
NASA Landsat 8 OLI image of the Chimanimani landslides in Zimbabwe, triggered by Cyclone Idai.
.
The imagery clearly confirms that this area suffered extensive shallow landslides in the upper part of the catchments, which in turn combined to generate channelised debris flows that affected the villages. These landslides have occurred over a wide area, beyond the zone shown in the image above (which has received most of the attention), as seen from the image below showing the area to the southwest of Chimanimani:-
NASA Landsat 8 OLI image showing landslides to the southwest of Chimanimani in Zimbabwe, triggered by Cyclone Idai.
.
Note also the extensive evidence of sediment-rich floods in the main channel, which illustrates the way in which landslides high in the catchment can cause extensive damage long distances downstream.
The largest of the Chimanimani landslides appears to lie to the east of the town itself:-
NASA Landsat 8 OLI image showing the largest of the Chimanimani landslides, triggered by Cyclone Idai.
.
This is a slightly intriguing feature that will benefit from more detailed investigation.
Meanwhile work continues to assess the losses from these landslides. On 24th March, reports suggested that the known fatalities from the Chimanimani landslides had reached 189, although the final total was expected to be double this number. There are some harrowing tales of the events that night; this is an account from Chipo Dhliwayo:-
“Rocks came from the mountain and crushed our hut; my in-laws’ house was the first to be destroyed. When our hut fell, my husband had gone to help my in-laws,” said Dhliwayo, as Zimbabwe military helicopters with aid and relief arrived at the worst affected areas of Chimanimani days after the tragedy.
“I had three children that were sleeping in the house and I managed to rescue only my six-month-old child on my own before my husband arrived back.
“When he got back, I was crying and trying to move some of the rocks covering our hut to rescue our four-year-old kid, who survived. But the other child did not come out alive; he died in the hut, trapped under large stones,” she said.
25 March 2019
Sul Superior: another Vale tailings dam at risk of imminent collapse in Brazil
Sul Superior: another Vale tailings dam at risk of imminent collapse in Brazil
The Brazilian mining company Vale warned over the weekend that its Sul Superior tailings dam, at the Gongo Soco mine near to Barão de Cocais, in the southeastern Brazilian state of Minas Gerais, is at risk of imminent collapse. This dam had been the focus of concern over the last two months, with evacuations from the path of a potential tailings flow starting on 8th February 2019. However, on Friday Vale raised the alert level to 3, the highest classification. The Guardian reports that, according to Brazil’s mining and energy secretary, level three means that “a rupture is imminent or already happening”. It also carries a quote from Lt Col Flavio Godinho, a member of the state civil defence department, that “any activity at the dam could trigger a rupture”.
Back in February, portaldasgerais.com.br posted this image of the Sul Superior dam:-
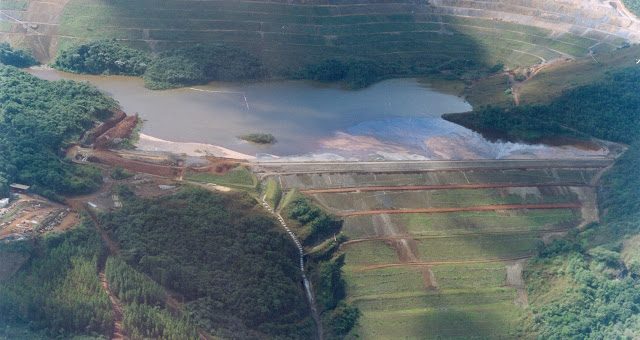
The Sul Superior dam at the Gongo Seco mine in Brazil. Image via: portaldasgerais.com.br.
.
Indications are that this dam is in the order of 85 metres high, containing a volume of tailings in the range of 3 to 6 million cubic metres. Fortunately, this is somewhat less than was the case at Brumadinho, but is still sufficient to cause enormous environmental damage.
This appears to be the site on Google Earth – the location is -19.972, -43.598:-
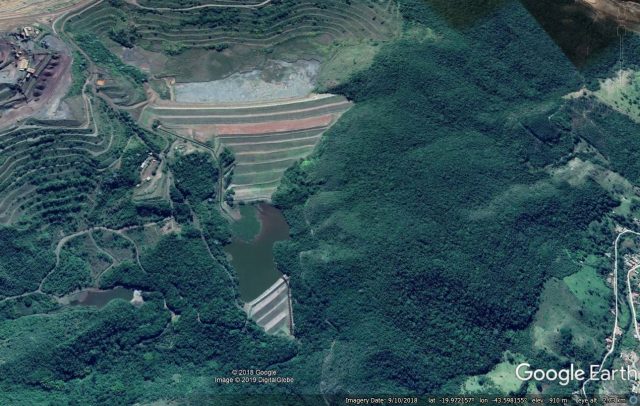
Google Earth imagery of the Sul Superior tailings dam in Brazil, which is now considered to be at risk of imminent collapse.
.
There is a very interesting paper available online from the Colombia Water Center (NB PDF), which proposes a hazard assessment methodology for tailings dams, and uses a selection of large facilities in Minas Gerais as an example. Interestingly, the Sul Superior Dam generated a hazard assessment that is 17th out of a list of 28 facilities.It appears that the Brumadinho dam, which is sometimes technically known as Barragem I, ranked 7th on the list.
21 March 2019
Planet Labs imagery of landslides in Chimanimani National Park, Zimbabwe, triggered by Cyclone Idai
Planet Labs imagery of landslides in Chimanimani National Park, Zimbabwe, triggered by Cyclone Idai
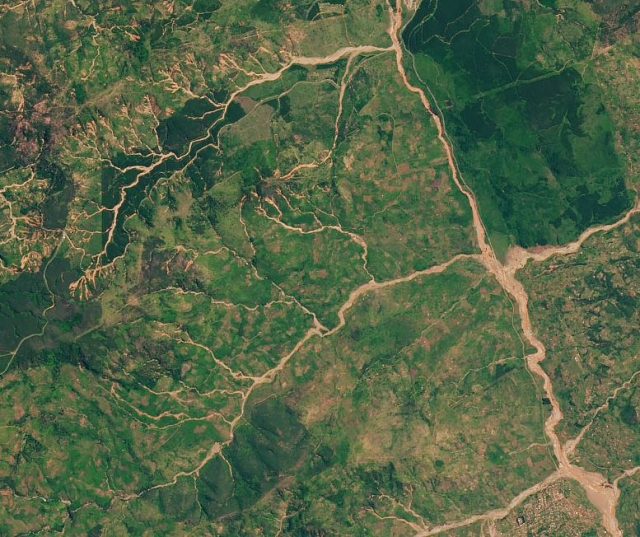
Yesterday Planet Labs captured high resolution satellite imagery of some of the landslides triggered by Cyclone Idai in Chimanimani National Park, Zimbabwe. There is increasing evidence that these landslides have caused substantial loss of life. This image is a SkySat image of the area, collected on 1st March 2019:-
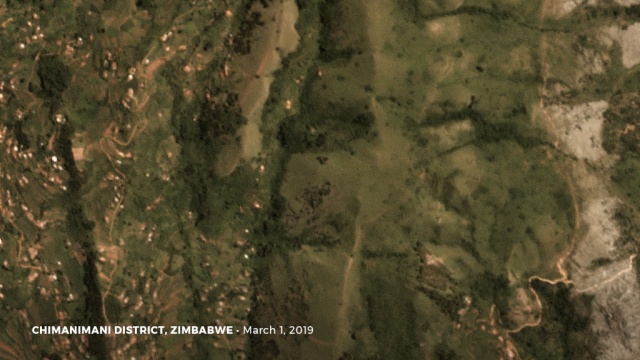
Planet Labs Skysat image of part of the area affected of Chimanimani by landslides triggered by Cyclone Idai. Planet Labs Skysat image, 1st March 2019, used with permission.
.
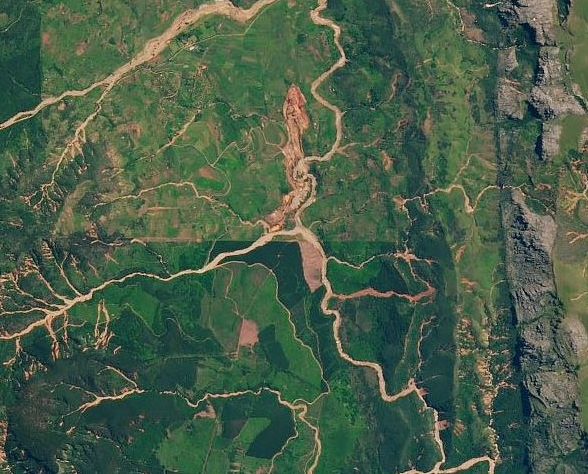
This is an image of the same area, collected yesterday, showing some of the landslides:-
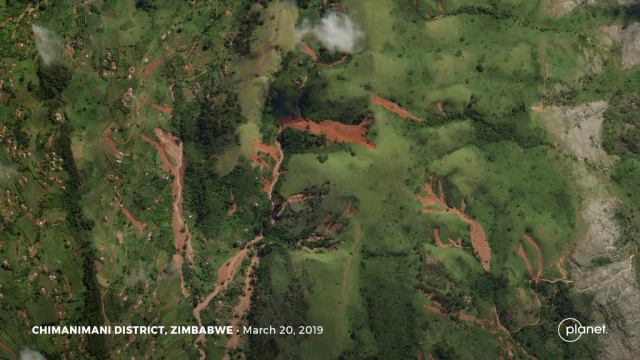
Planet Labs Skysat image of part of the area affected of Chimanimani by landslides triggered by Cyclone Idai. Planet Labs Skysat image, 20th March 2019, used with permission.
.
So, the images show that there are multiple landslides across the landscape. The red colour of the landslide scars indicates deeply weathered soils, which are prone to failure in intense rainfall events. The initial slips, generally high on the slope, have triggered failure downslope, allowing the volume of the landslide to increase. That debris has combined in the channels to form the debris flows that have caused the losses downstream. Note that this area has been extensively deforested, which may explain the high incidence of landslides on this occasion.
Planet Labs also captured a lower (3 m) resolution PlanetScope image of the Chimanimani area yesterday (20th March 2019). Whilst it is affected by some cloud, this appears to show very extensive landslides and debris flows of the types shown above, many of which have impacted upon the villages:-
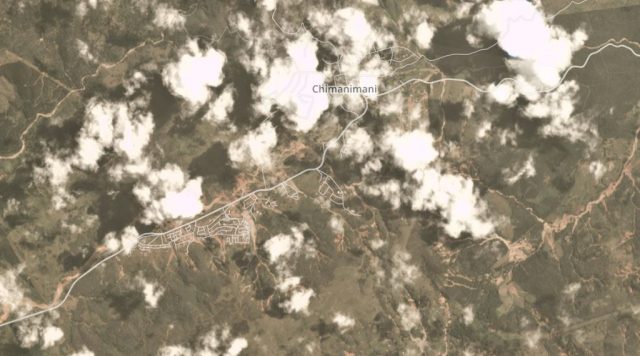
Planet Labs PlanetScope image of part of the area affected of Chimanimani by landslides triggered by Cyclone Idai. Planet Labs PlanetScope image, 20th March 2019, used with permission.
.
The village of Ngangu, southwest of Chimanimani, appears to have been particularly badly affected:-
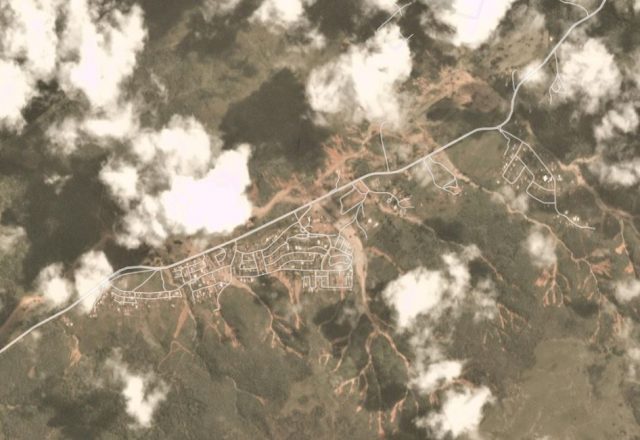
Planet Labs PlanetScope image of the landslides in the area of Ngangu in Zimbabwe. Planet Labs PlanetScope image, 20th March 2019, used with permission.
.
It is likely that the level of loss, and destruction of houses, in this area are very high.
Reference
Planet Team (2019). Planet Application Program Interface: In Space for Life on Earth. San Francisco, CA.
20 March 2019
Cyclone Idai: evidence of the impact of landslides and debris flows
Cyclone Idai: evidence of the impact of landslides and debris flows
As the true magnitude of the likely costs of Cyclone Idai across southern Africa becomes clear, some images are emerging that indicate that in some areas landslides may have been a significant part of the problem, in Zimbabwe at least. This is directly indicated in a few news reports – for example, it has been widely noted that two boys were killed when a landslide struck the dormitory of a school:-
“Two pupils and a worker at a secondary school in the area were among those killed after a landslide sent a boulder crashing into their dormitory. Soldiers on Sunday helped rescue the surviving nearly 200 pupils, teachers and staff who had been trapped at the school in Chimanimani.”
But reports also suggest that landslide and debris flows might have played a much larger role. The same report indicates that:-
“Agony is etched in Tapiwa Chanyawo’s face as he tells of the night the storm came, a mudslide swept away their home, and his family died. Their home, in the eastern Zimbabwean town of Chimanimani, lay in the path of Idai — a gigantic tropical cyclone that may have left more than a thousand dead in its wake. “My father, my mother, my two sisters including the elder one and her child, they all died,” Chanyawo told AFP from his bed at a local hospital, counting the numbers on his fingers.”
This report contains the following image, which includes very clear landslide scars in the hills and, perhaps, the aftermath of a channelised debris flow:-
The aftermath of Cyclone Idai in Zimbabwe. Image by AFP Photo/Zinyange AUNTONY, via Yahoo News.
.
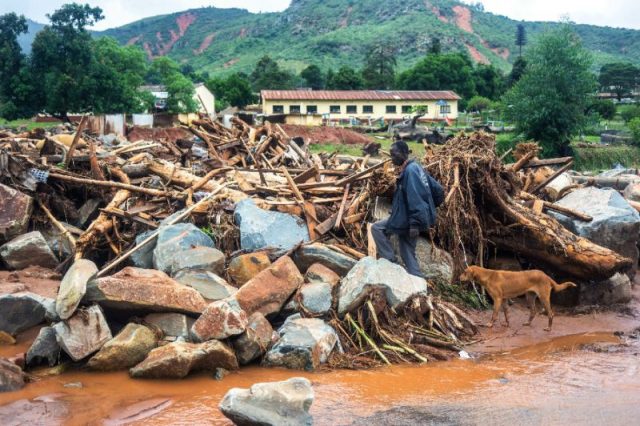
Meanwhile, Povo News has posted this image, which I believe is the village of Ngangu, close to Chimanimani:-
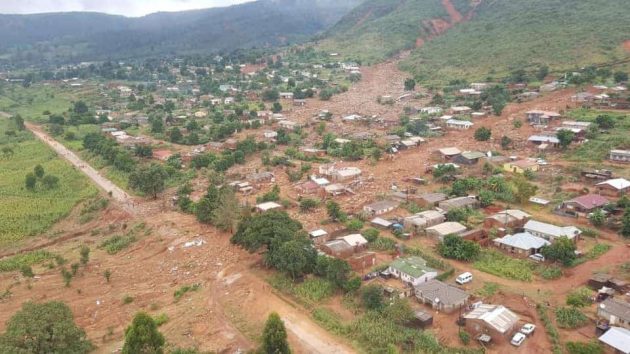
The aftermath of Cyclone Idai. This image appears to be the village of Ngangu, close to Chimanimani. Image via Povo News
.
There is no doubt that this image shows the aftermath of debris flows, with clear landslide scars in the hills in the background. It appears that there are multiple examples of this type of event:-
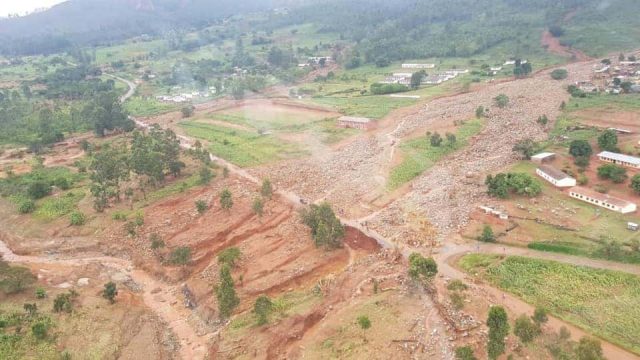
The aftermath of Cyclone Idai. This image appears to be the area around the village of Ngangu, close to Chimanimani. Image via Povo News.
.
Elsewhere there is evidence of other, more conventional, landslides, which have caused extensive damage to the road network:-
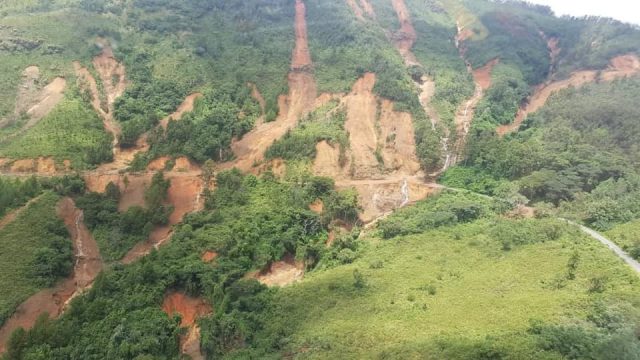
Landslides in the he aftermath of Cyclone Idai, close to Chimanimani. Image via Povo News.
.
Note here the multiple small landslides have combined in the channels. This process is probably the origin of the debris flows; a mode that is very familiar from Japan, Colombia and elsewhere. The destructive power of the resulting debris flows is well illustrated by the famous video from Lantau Island.
19 March 2019
Sentani, Indonesia: at least 89 killed in rainfall induced debris flows
Sentani, Indonesia: at least 89 killed in rainfall induced debris flows
On Saturday, heavy rainfall in the Sentani area of Papua region of Indonesia triggered landslides and debris flows that are known to have killed at least 89 people, with reports suggesting that at least another 74 people are missing. Reports suggest that 159 people have been injured. Whilst seven of the fatalities are reported to have been in a landslide event at Ampera in Jayapura City, most of the remainder of the losses are ascribed to “flash floods”. However, photographs from the site clearly indicate that these events were channelised debris flows. For example, this appears to have been the largest event, which occurred close to the airport:-
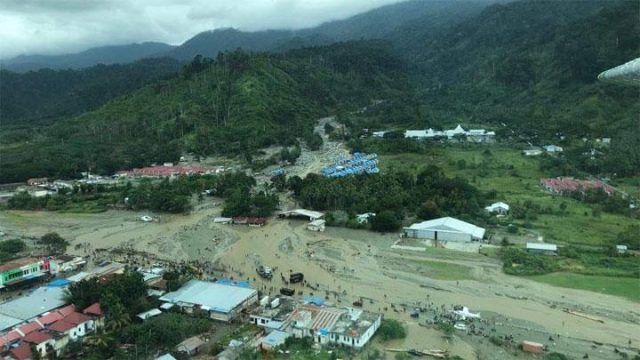
The aftermath of the channelised debris flows at Santani in Papua, Indonesia. Image via Bisnis.tempo.co.
.
This image provides a different perspective on the same site:
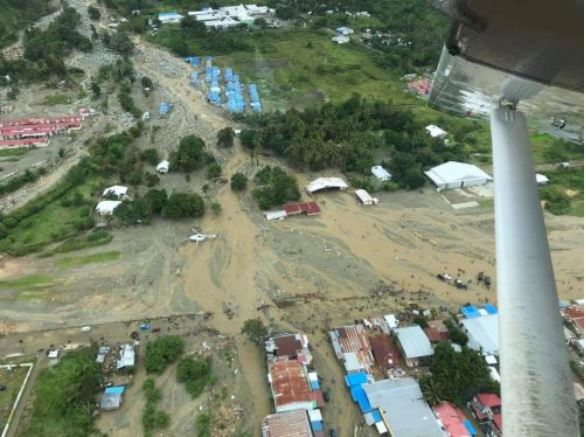
The aftermath of the debris flows at Sentani in Papua, Indonesia. Image via radarcirebon.
.
Some reports indicate that this area received about 250 mm of rainfall in seven hours. There are also suggestions that deforestation in the mountains may also have played a significant role. But as is so often the case, the major issue appears to be the construction of houses on natural alluvial fans, built by successive debris flow events. Note in the image above the way in which the flow has passed directly through the housing development with blue roofing. The river channel is just to the left but flows naturally migrate across fans during large events.
As numerous videos have shown, channelised debris flows are very energetic events, which most residential structures are unable to resist. The answer to these events is to try to ensure that these hazardous areas are not occupied, at least during intense rainfall; to protect properties that are in dangerous locations; and, of course, to try to ensure that catchments are managed properly.
18 March 2019
Zaoling, Shanxi: a deadly loess landslide on Friday
Zaoling, Shanxi: a deadly loess landslide on Friday
At 6:10 pm local time a slope collapsed in the township of Zaoling in Linfeng City, Shanxi Province in China. The latest update on Xinhua indicates that 20 people are likely to have been killed, of whom 10 have been found to date, and a further 16 were injured. JQKNews has this image of the site:-
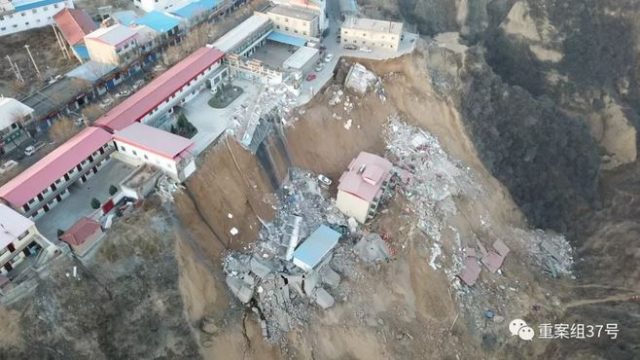
The fatal 15th March 2019 landslide at Zaoling in Shanxi Province in China. Image from JQKNews.
.
JQKNews provides an unusual amount of information about this landslide, compared with the norm for large events in mainland China:-
“At about 18:10 on March 15, a landslide occurred on the north side of Zaoling Township Health Center in Xiangning County, Linfen City, Shanxi Province, causing the collapse of a family building (6 families), a credit cooperative family building (8 families) and a small bathing center. According to the latest news from the relevant government departments in Xiangning County, Linfen City, Shanxi Province, as of 15:00 on the 16th, 7 people were killed, 13 injured and 13 others were lost. On the 16th, a reporter from the Beijing News saw on the spot that hundreds of meters of warning lines were pulled up outside the street-front shops on the side of Zaoling Township Health Center. One building slid down half of the hillside in the landslide, while two other collapsed and scattered gullies and slopes were mostly buried in loess.
“Beijing News reporter noted that on the evening of the 15th, a crack appeared in the wall of a two-storey hospital building in Zaoling Township Health Hospital, and the hospital evacuated the patients. On the 16th, a reporter from the Beijing News saw at the scene that the cracked hospital building had collapsed.”
The report suggests that the residential property remained essentially intact but a bathhouse collapsed, leading to the loss of life. The variable state of the different buildings can be seen in this image:-
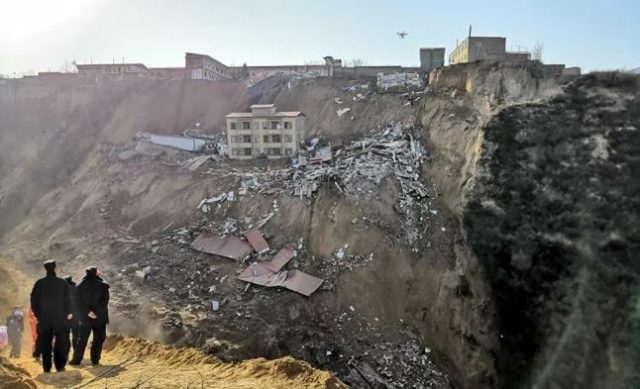
The aftermath of the 15th March 2019 landslide at Zaoling in Shanxi Province in China. Image from AP via El Universal.
.
The reports suggest that this was a loess landslide, and the images appear to confirm this. It is interesting that it has occurred in apparently dry conditions. The landslide appears to have involved a large block that fortunately remained mostly intact and suffered little rotation, which fortunately meant that one of the large buildings remained upright. This appears to be the location of the landslide (35.807, 110.654):-
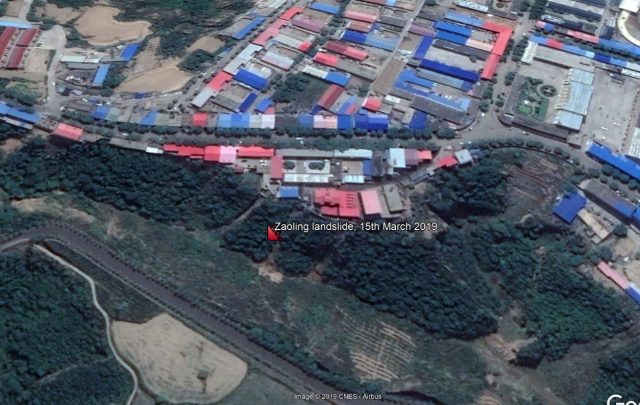
The 15th March 2019 Zaoling landslide in China. Image from Google Earth.
 Dave Petley is the Vice-Chancellor of the University of Hull in the United Kingdom. His blog provides commentary and analysis of landslide events occurring worldwide, including the landslides themselves, latest research, and conferences and meetings.
Recent Comments