
7 March 2014
Two interesting new landslide videos – Birling Gap and San Leo
..
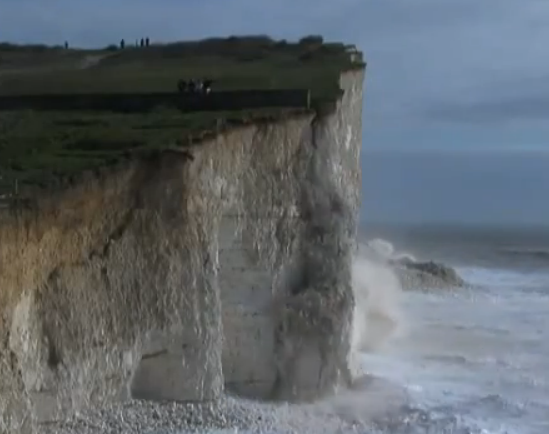
Birling Gap, Sussex, 4th March 2014
Birling Gap in Sussex, on the south coast of England, has suffered high rates of erosion in the storms of this winter. On 4th March Eddie Mitchell caught on camera a substantial collapse event, as shown in the screenshot above. This is well-described in a Sussex Express article, and is available on Youtube:
http://www.youtube.com/watch?v=o56NWgAWWOE
..
The collapse event is quite interesting. If you look carefully you will see that it was initiated at the foot of the cliff, after which the collapse rapidly propagates upslope. The area that collapsed had been cordoned off because a large crack had appeared across the cliff top. Rockfalls are the usual erosional process on this section of cliff; this is undoubtedly just one of many this winter, which has seen seven years of erosion in two months. Sadly this is now threatening a set of historic cottages, whose loss now seems inevitable within a few years at most.
Erosion on the cliffs of Birling Gap is a serious problem. The National Trust have a nice video about the issues:
http://www.youtube.com/watch?v=ZXAgtVj_weA
..
San Leo, Italy, 27th February
A large landslide occurred at San Leo in Rimini, Italy on 27th February. The aftermath of the slide has been captured with a UAV-mounted camera, and is available on Youtube:
..
Thanks to Doug Stead and Margherita Cecilia Spreafico for highlighting the video to me.
26 February 2014
Mount La Perouse landslide: a Landsat 8 satellite image
The Mount La Perouse landslide in the news
The Mount La Perouse landslide is now attracting interest from the media, which is rather cool. This has been driven at least in part by the publication yesterday of images of the landslide collected by Landsat 8 and published by NASA yesterday. The best thing about this is that we now have a before and after view of the landslide.
Mount La Perouse before the landslide
This is an image of the location of the landslide, collected on 27 May 2013:
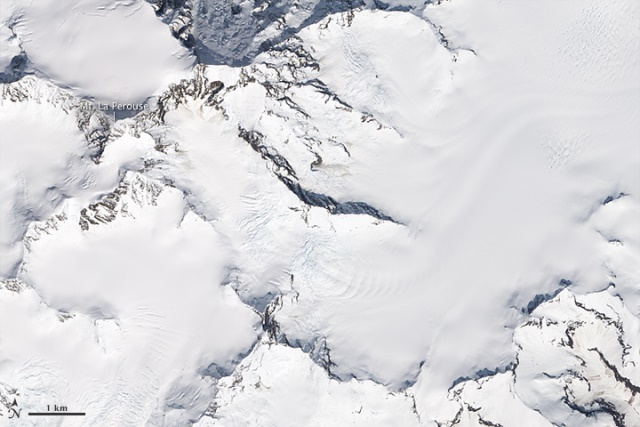
Image from the NASA Earth Observatory: http://earthobservatory.nasa.gov/IOTD/view.php?id=83195&src=eoa-iotd
..
Mount La Perouse after the landslide
This is the Landsat 8 image of the landslide, collected on 23 February 2014:
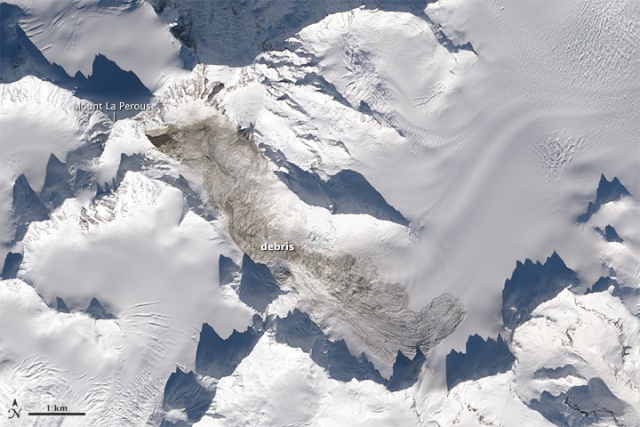
Image from the NASA Earth Observatory: http://earthobservatory.nasa.gov/IOTD/view.php?id=83195&src=eoa-iotd
..
The mobility of the Mount La Perouse landslide
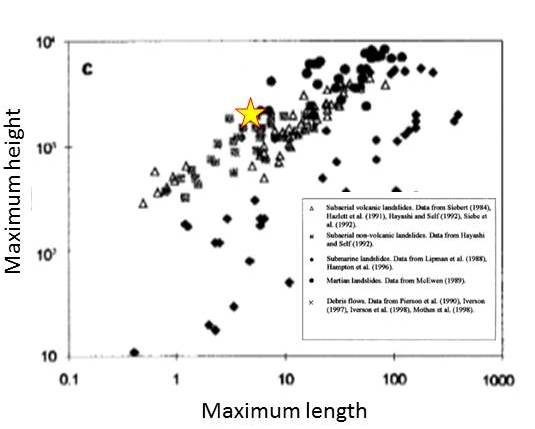
It has been suggested by some that flowing across ice and snow might be a factor in determining the mobility of very large landslides. Back in 2002 Francois Legros wrote a very nice paper in which he collated a dataset on very large landslides, and then compared their mobility (for example the maximum distance that they traveled in relation to the maximum height difference from the landslide crown to the landslide toe). I have plotted the approximate position of the Mount La Perouse landslide on his graph below (apologies for the poor quality scan!):
..
The data suggests that this landslide was at the higher end of the mobility scale on this criteria. Interestingly, the morphology of the toe of the landslide is very similar to that of the Mount Dixon rock avalanche in New Zealand. The final movement phase for that event consisted of sliding across the snow and ice base at a low rate, as the video below shows:
..
Thus, it may be that this type of movement contributes significantly to the mobility of large landslides moving across ice
Reference
..
25 February 2014
Mount La Perouse rock avalanche: more images
The Mount La Perouse rock avalanche
The Mount La Perouse rock avalanche nine days ago is a very interesting landslide. My original post, based on the seismic data of Colin Stark, Clément Hibert and Goran Ekstrom is here; the first images of it, as collected by Drake Olson, are here.
Satellite data
Landsat 8 passed over the landslide on Saturday; nature was kind to us by providing a cloud-free day, so the landslide has been images well. Colin Stark has run a quick initial process of the data, which reveal the following parameters for the Mount La Perouse rock avalanche:
- Maximum length (from the crown to the toe: about 7,400 metres
- Maximum elevation (i.e. height of the crown of the source area): about 2,800 metres
- Minimum elevation (i.e. the height of the toe of the landslide): about 1060 metres
Colin has draped the Landsat 8 data on to a digital elevation model to provide a view of the dynamics of the landslide:
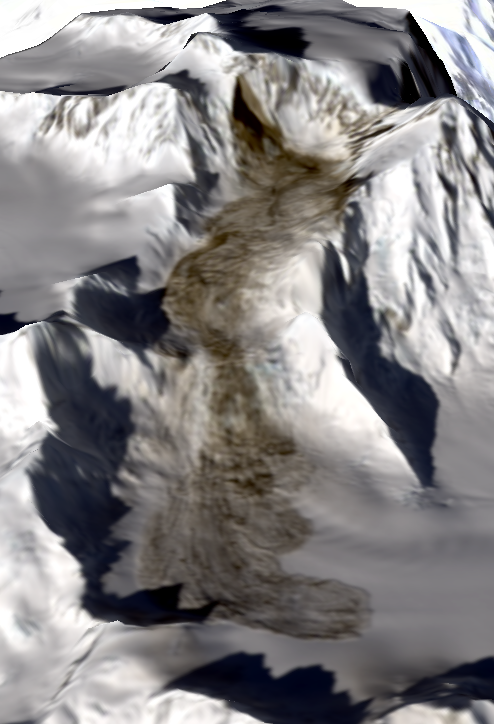
Copyright Colin Stark, used with permission. Image: Landsat 8
..
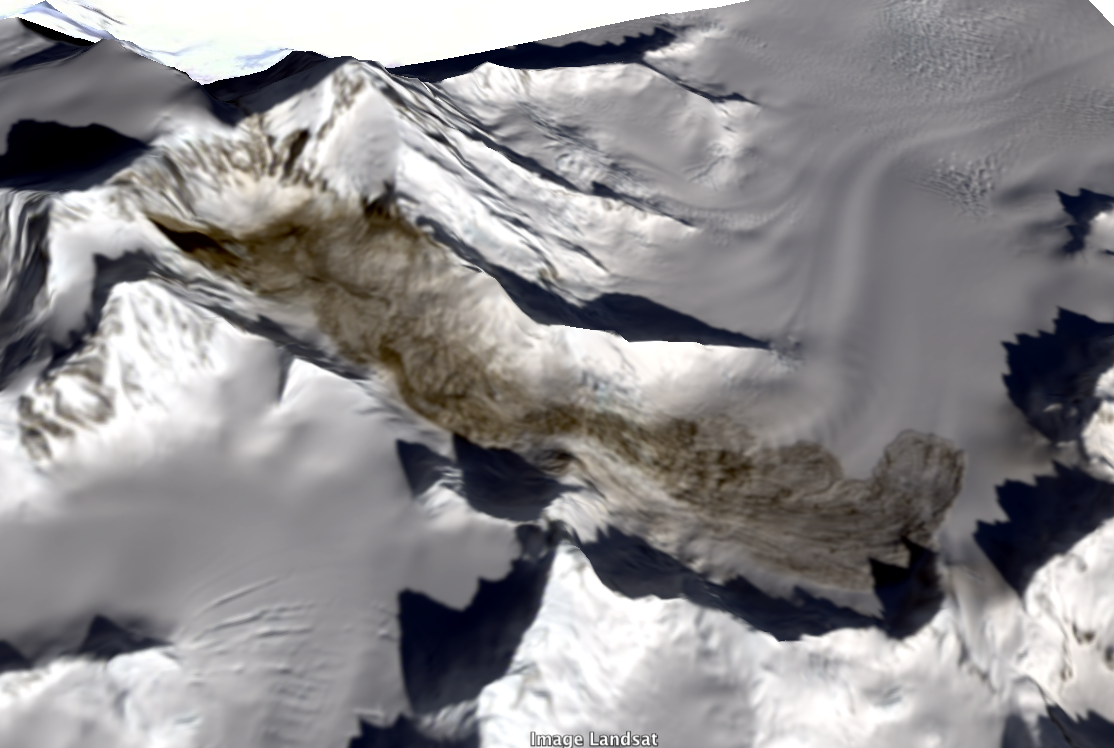
Copyright Colin Stark, used with permission. Image: Landsat 8
..
Some additional images of the Mount La Perouse rock avalanche
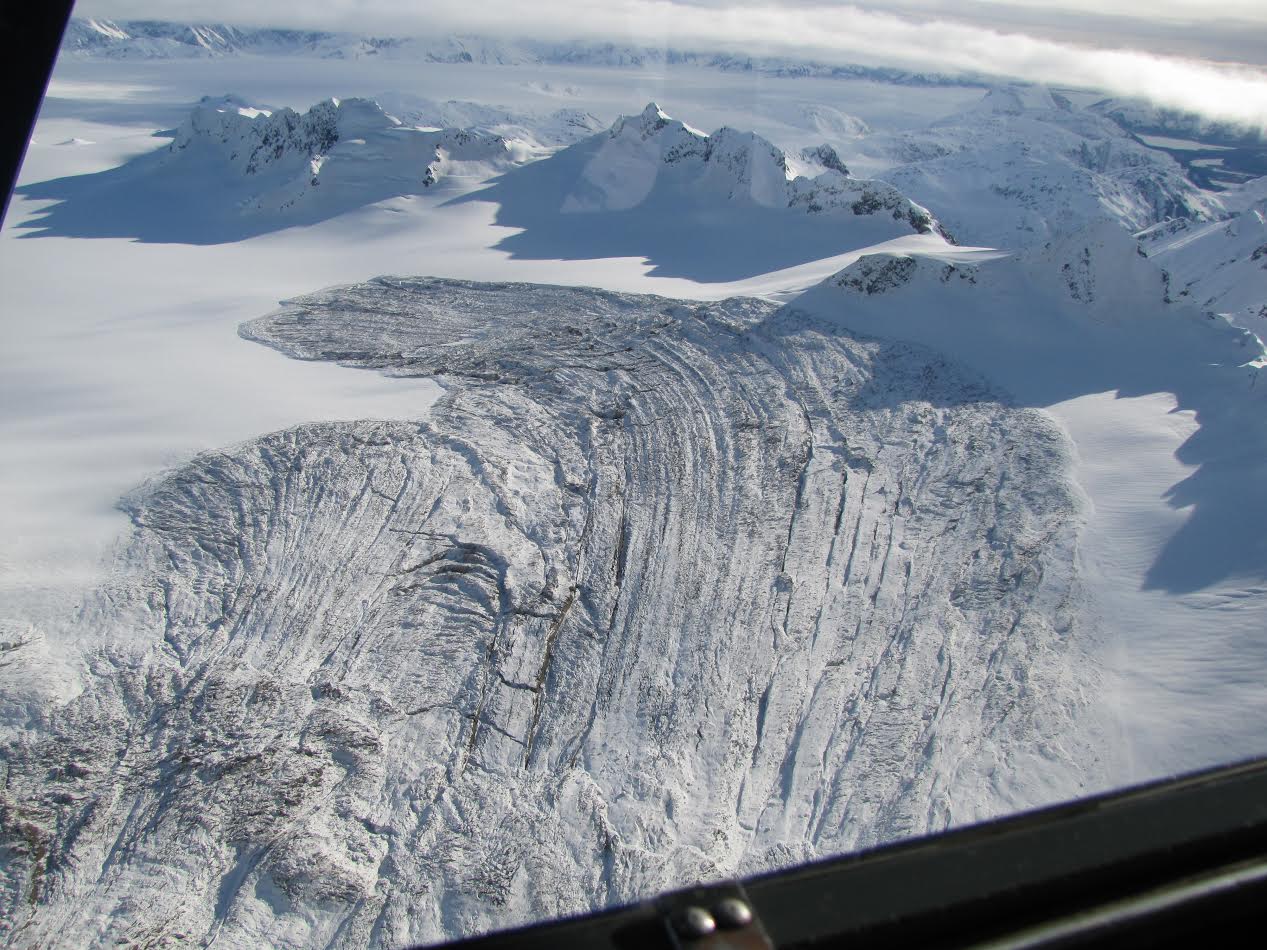
Drake Olson, via Marten Geertsema at UNBC, has provided some additional photographs of the landslide. First, this is a view of the landslide from the air. Note the remarkable super-elevation of the landslide (i.e. the way in which it has run up the sides of the valley):
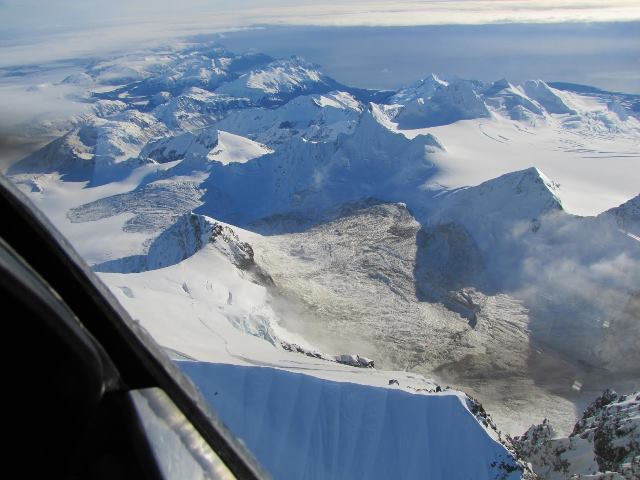
Copyright Drake Olson – used with permission
..
This is a really vast landslide. To give an impression of the scale, this is the landslide toe. If you look carefully you will just be able to see Drake’s aircraft:
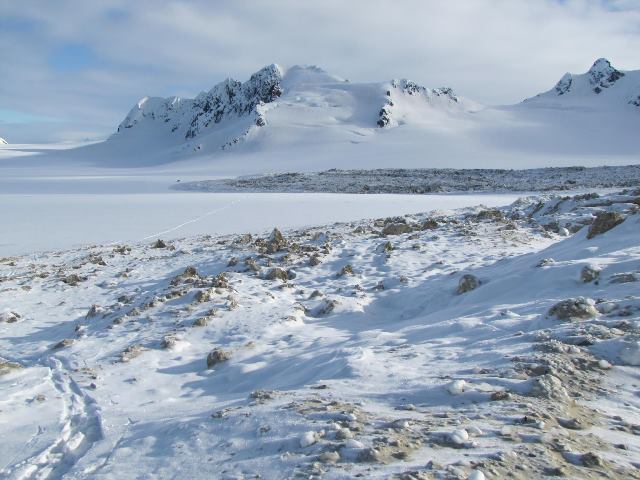
Copyright Drake Olson – used with permission
..
We are all indebted to Drake for collecting these wonderful images. Here he is sitting on the landslide debris:
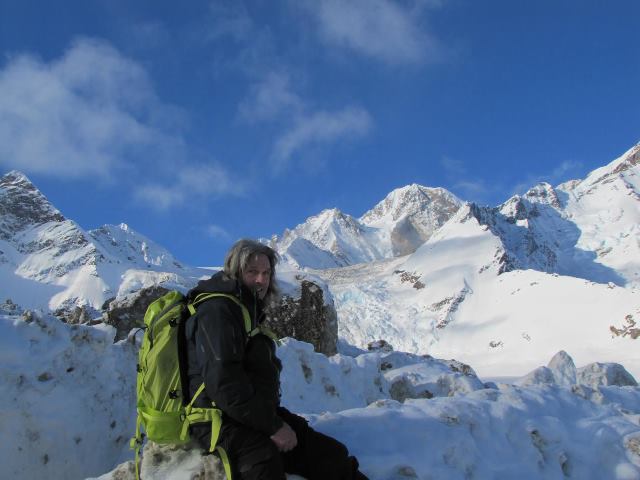
Copyright Drake Olson – used with permission
..
Acknowledgements
This post uses images and information collected by Colin Stark. He would like to acknowledge NSF, which funded the research under the following schemes:
- Geomorphology and Land-use Dynamics & Geophysics programs under award #1227083
- Division of Civil, Mechanical, and Manufacturing Innovation and the Hazards SEES program under award #1331499
22 February 2014
Mount La Perouse: Sunday’s rock avalanche in Alaska has been found
The Mount La Perouse Rock avalanche: background
Earlier this week I posted the initial results of the tool developed by Goran Ekstrom and Colin Stark, which indicated that a rock avalanche had occurred in Alaska on Sunday. We were waiting for Landsat 8 to collect imagery today in the hope of locating it. However, yesterday pilot Drake Olson found it on the flank of Mount La Perouse. Marten Geertsema has generously acted as the conduit of information about the landslide, and Drake has very kindly provided some photographs of the landslide too. Two satellite passes are due this weekend, so hopefully we’ll get some images from that source too.
The approximate location from the seismic data
The seismic data indicated that the landslide was located somewhere is the region of coordinates 58.68, -137.37,which is this area of Alaska. Interestingly, this is within 10 km of the Mount Lituya rock avalanche of two years ago:
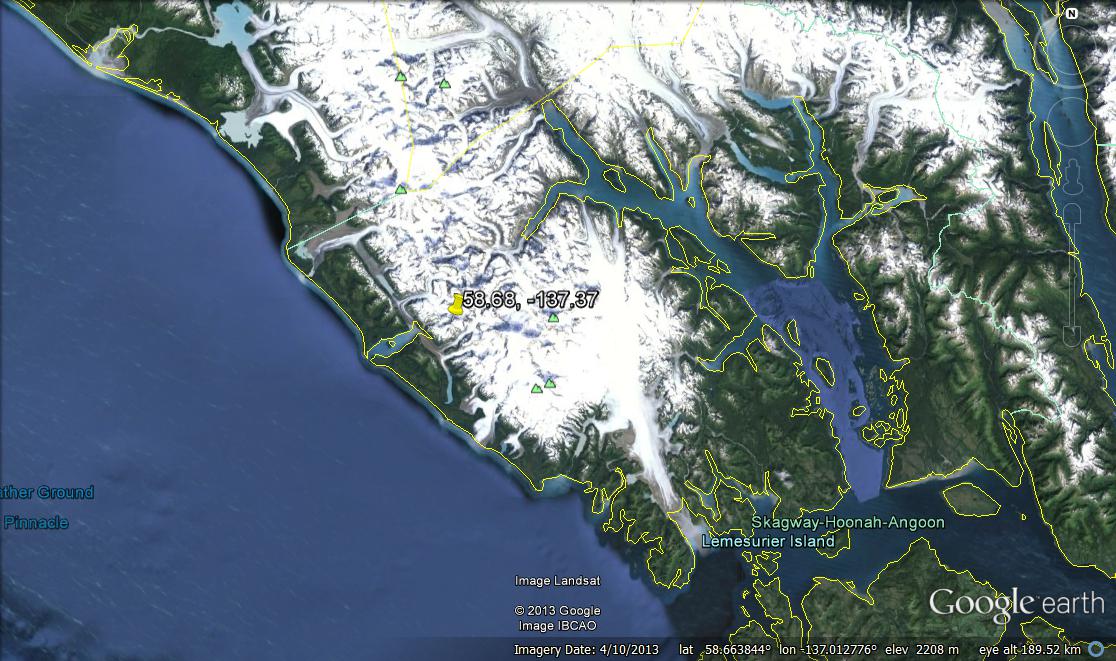 ..
..
Drake Olson and the location of the Mount La Perouse landslide
Today helicopter pilot Drake Olson spotted the landslide. It is on the flank of Mount La Perouse at about 58.542 -137.01:
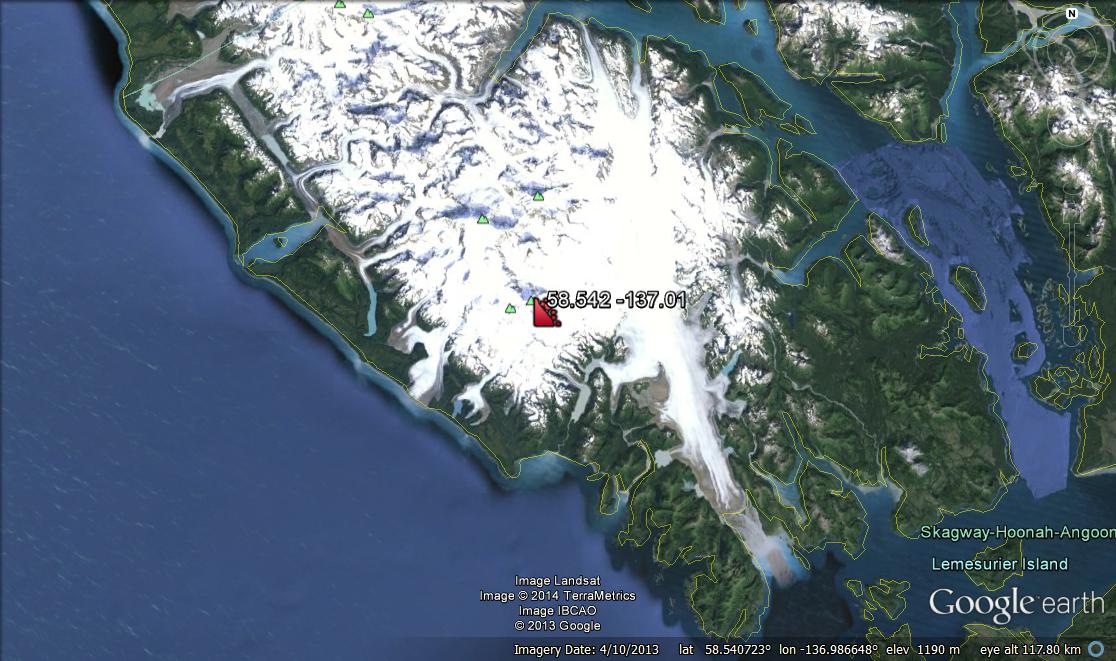
..
First information and images of the Mount La Perouse rock avalanche
This is a big landslide. It appears that a near vertical wall of the mountain has collapsed and then turned into a rock avalanche that has entrained snow and ice. The run out distance is about 4.8 km. The collapse occurred at about 3000 m elevation; unfortunately this is above the snow line, so the landslide has already started to be covered by snow. With thanks to Drake Olson, this is the source:
Copyright Drake Olson
..
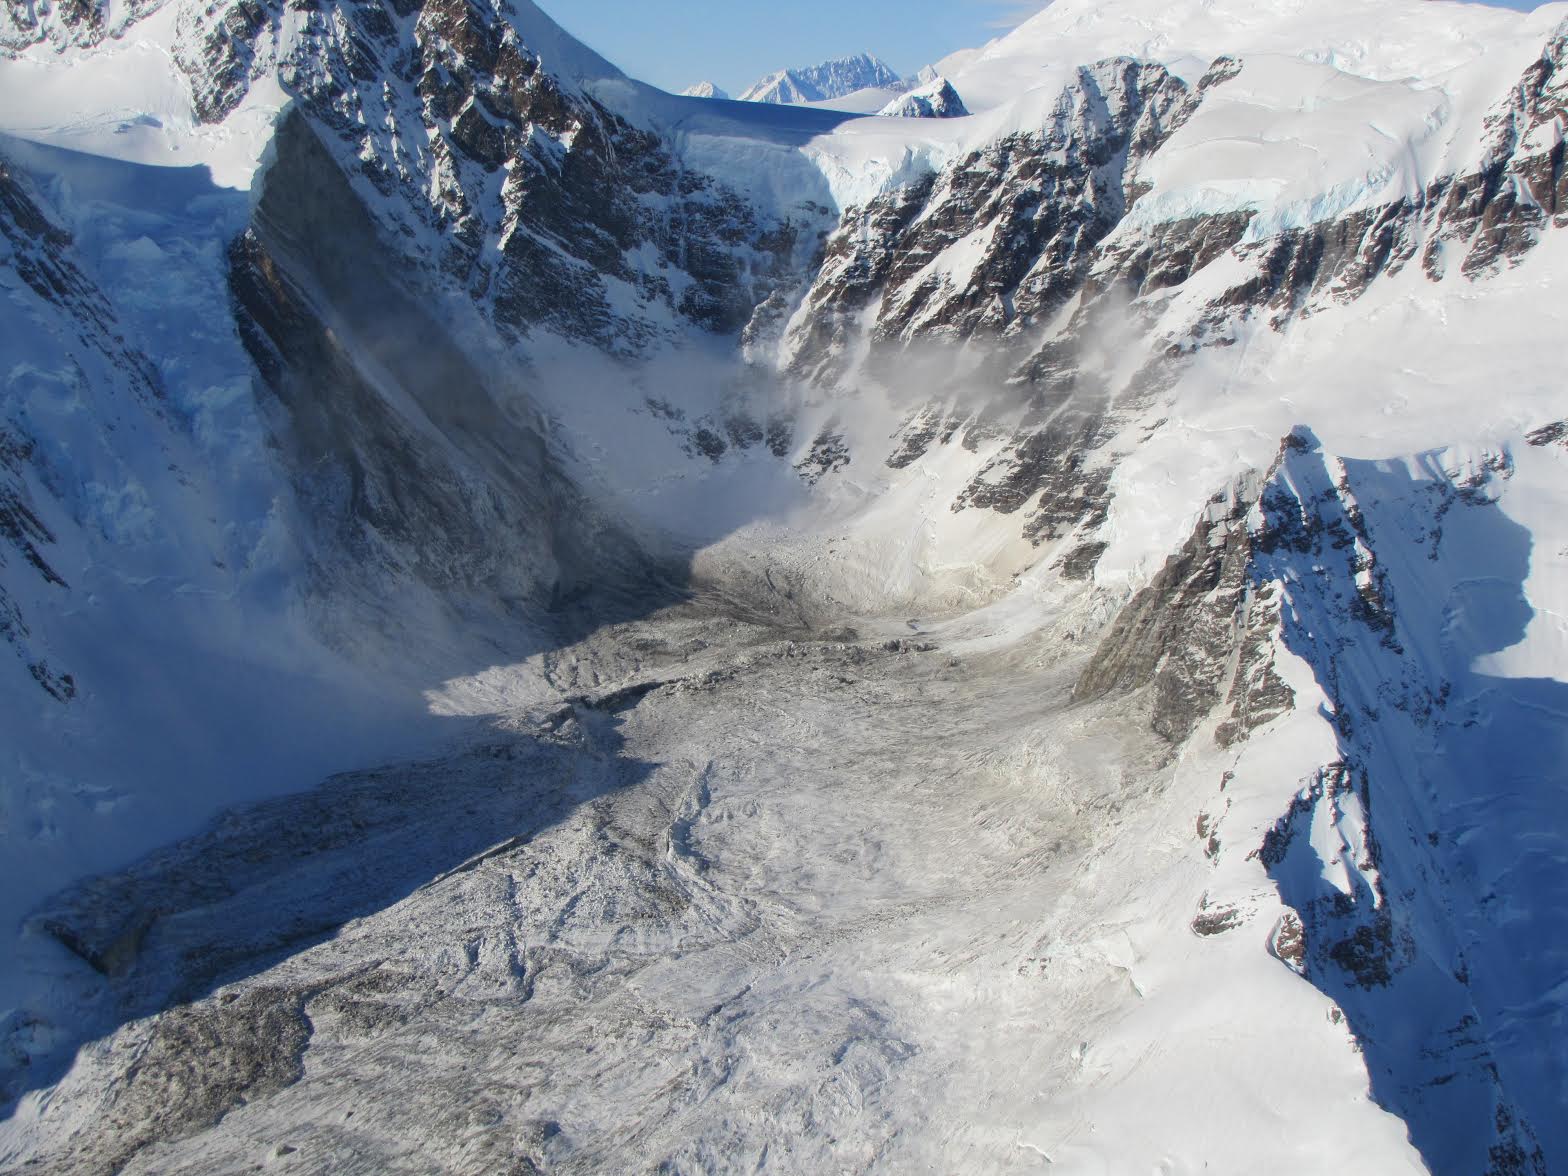
So it is clear that a near-vertical wall on the flank of the mountain collapsed. Note the clear runup on the other side of the corrie, after which the landslide has flowed downslope. The initial part of the track has a quite low gradient, after which it has flowed down a steeper slope. This is the track:
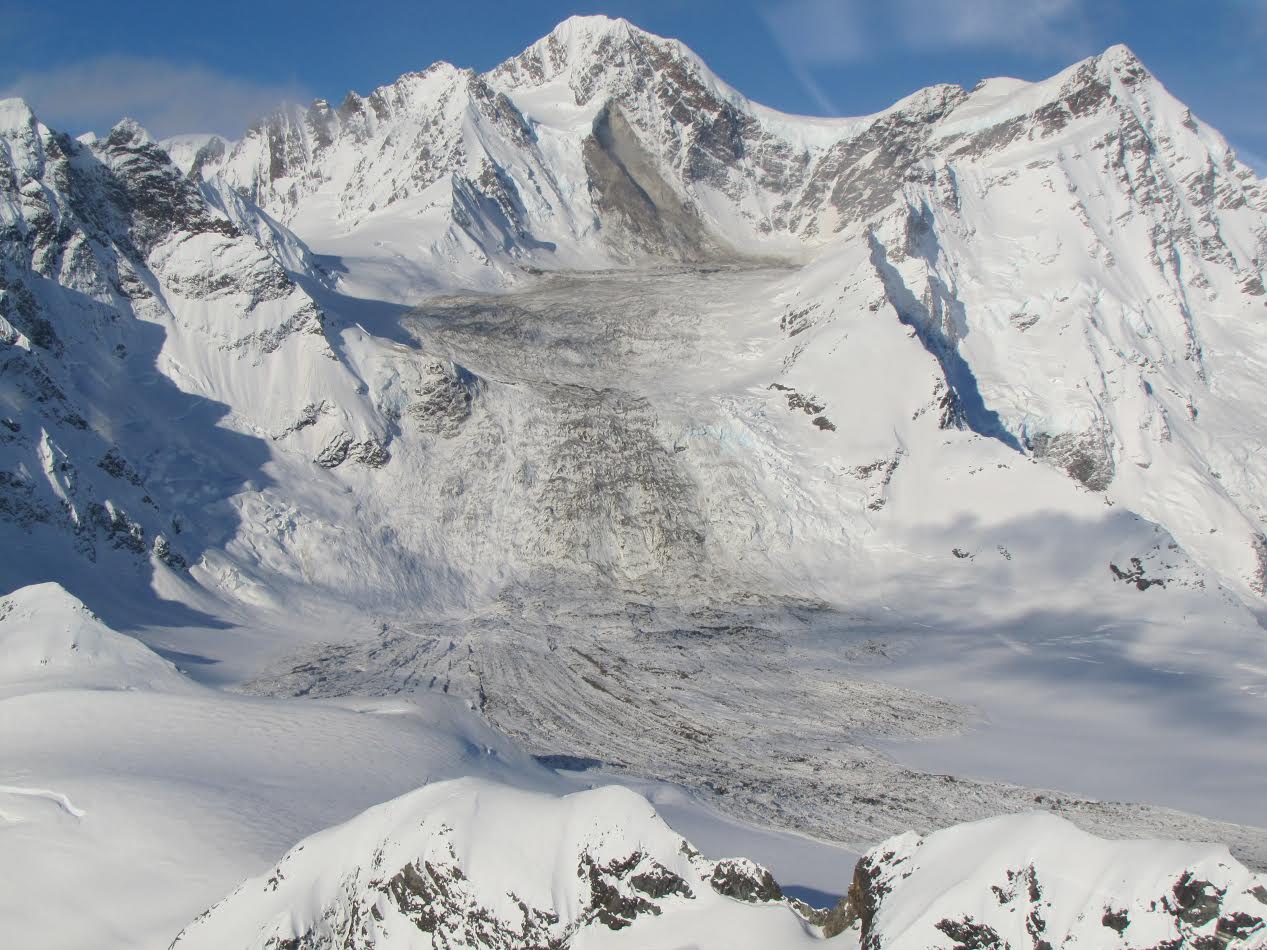
Copyright Drake Olson – used with permission
..
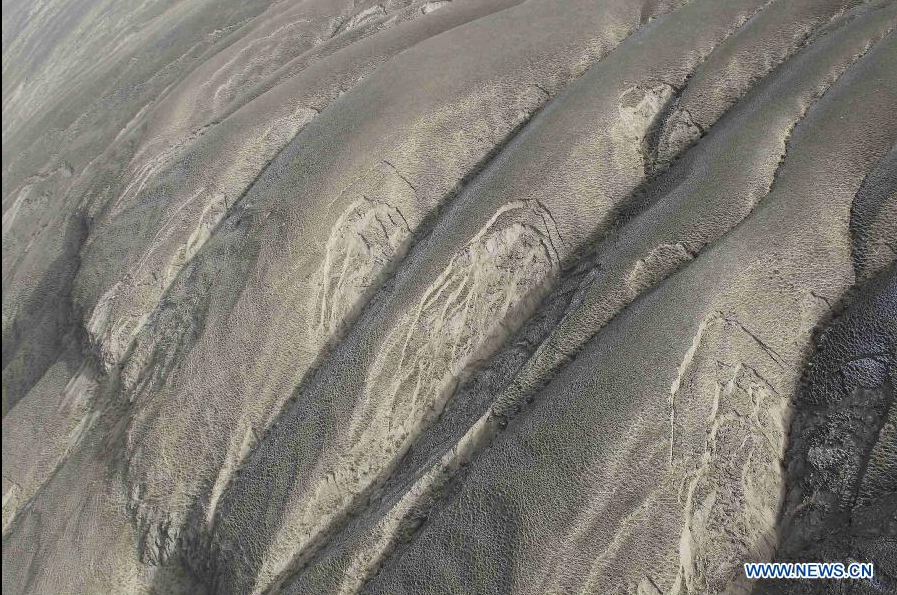
At the toe the landslide has spread out. This image shows the toe of the landslide with some quite beautiful flow lines:
Copyright Drake Olson. Used with permission.
..
These wonderful images perhaps don’t give a feel for the thickness of the deposit, which is up to about 13 m. Drake even landed at the toe of the landslide to get a feel for the constituent materials. This image shows that they consist of ice and rock, suggesting that the landslide has entrained a large amount of snow and ice as it travelled downslope:
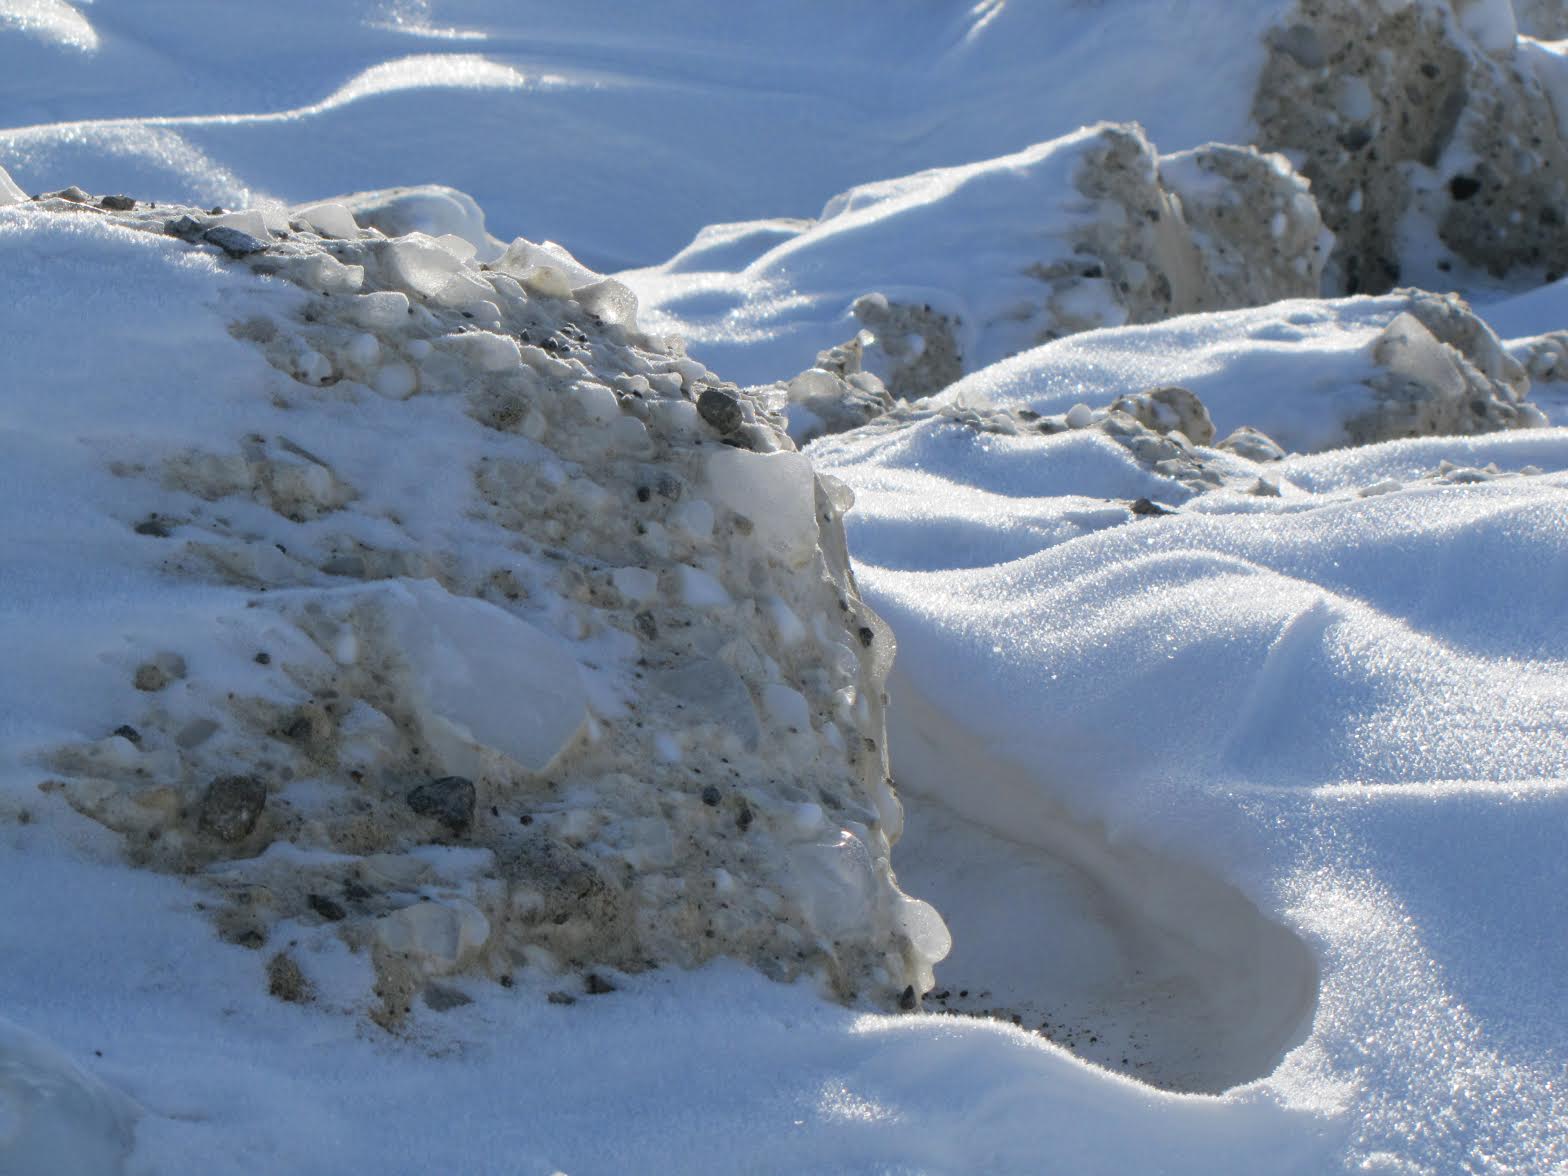
Copyright Drake Olson – used with permission
..
Unfortuantely the landslide will disappear beneath snow very quickly. Already there is a few centimetres of fresh snow on it – this is the dust layer generated by the landslide, with fresh snow on the surface:
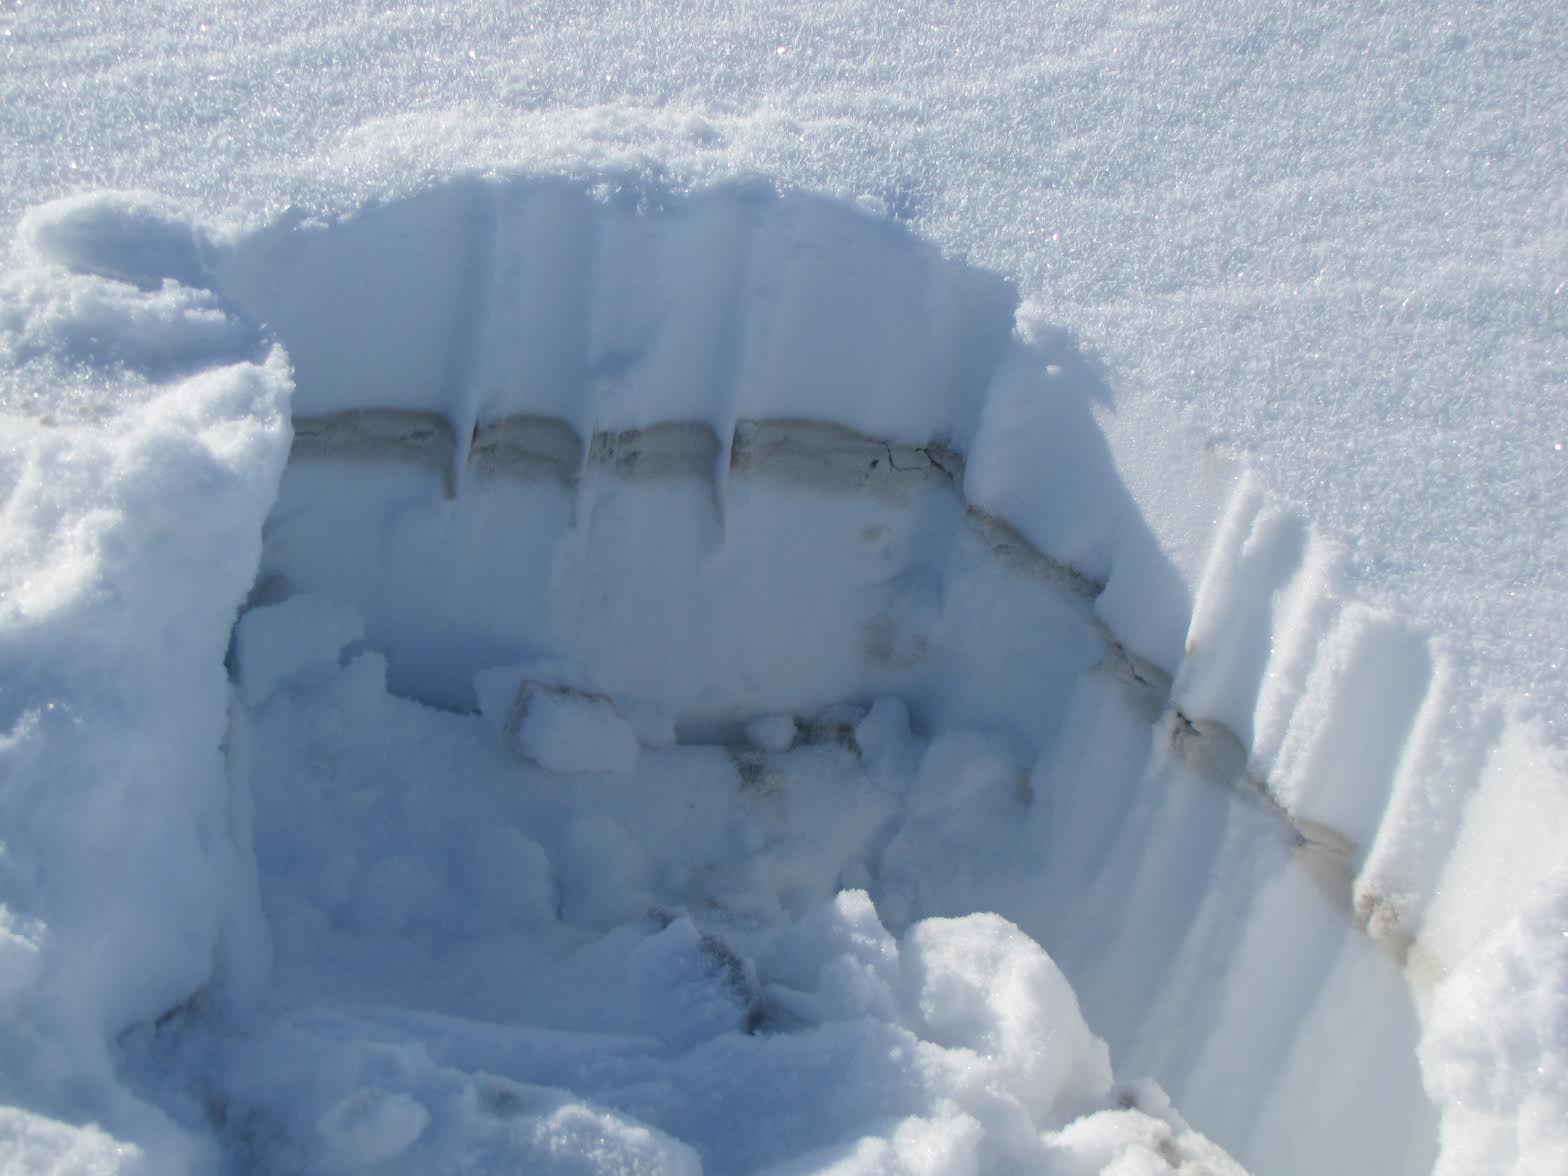
Copyright Drake Olson – used with permission
..
I must thank Drake Olson for both locating the landslide and for providing the images; Marten Geertsema for forwarding the information to me; and Colin Stark, Goran Ekstrom and Clément Hibert for spotting this in the first place and for allowing me to break the news about it.
21 February 2014
Emergency assessment of wildfire debris flow potential
Post wildfire debris flows
In recent years wildfires have become more common in many locations. For example, in northern California Miller et al. (2012) (available as a pdf online) have shown that whilst the frequency of wildfire events there has not increased, the size of the largest fires and the total area burnt has risen dramatically:
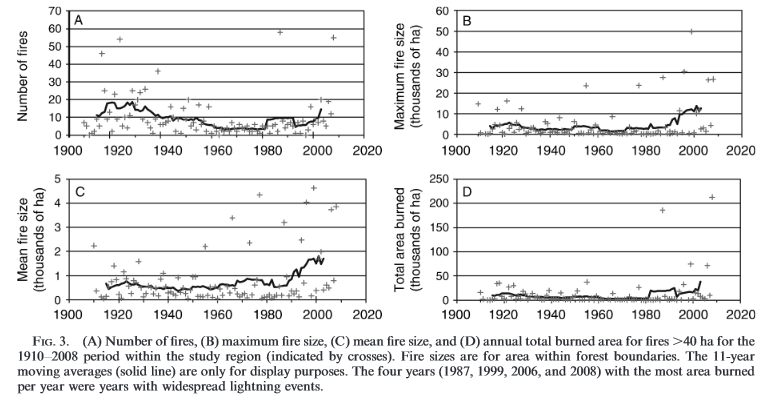
Miller et al. 2012
..
One of the consequences of wildfires is that the incidence of landslides, and in particular of debris flows, can dramatically increase. The USGS has a good primer on this topic, and this report provides an interesting summary of debris flow potential after a wildfire in Fort Collins in Colorado. The image below, from the Utah Geological Survey, shows the aftermath of a debris flow in Santaquin after a wildfire in 2002:
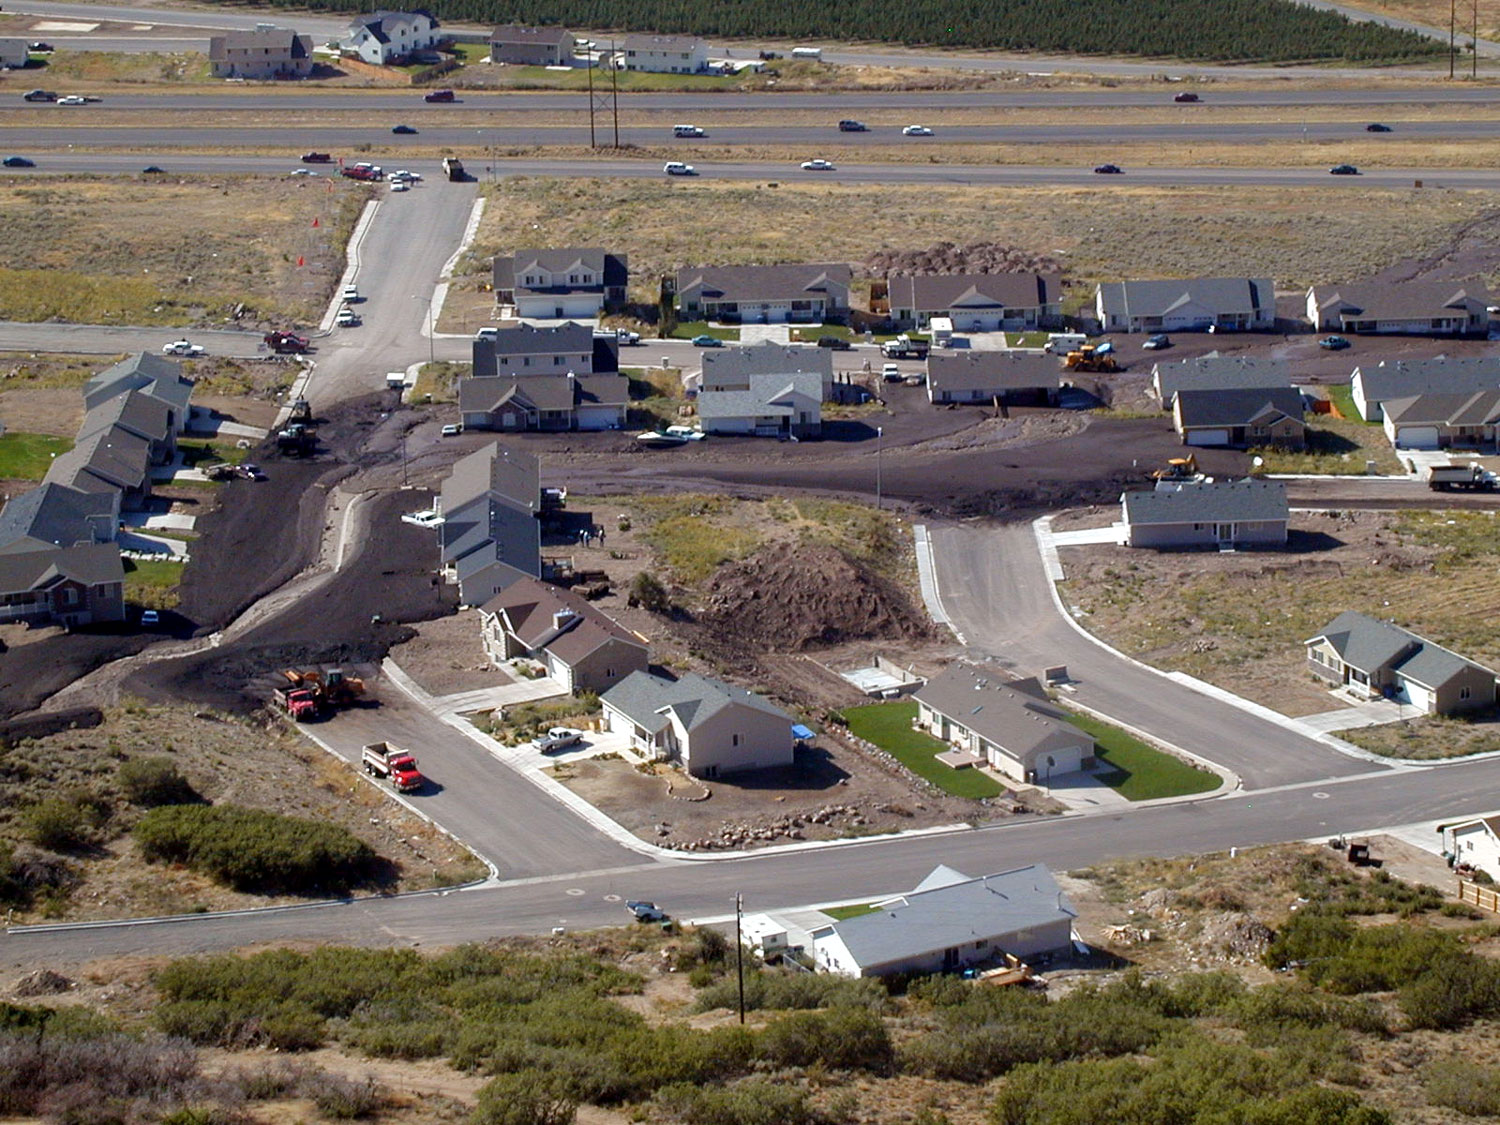
Utah Geological Survey: http://geology.utah.gov/utahgeo/hazards/landslide/flows0902.htm
..
Emergency assessment of post wildfire debris-flow hazards
Clearly such debris flows represent a very substantial hazard for those living in upland areas that have been affected by wildfires. The USGS has always led the way in the assessment and management of these landslides. Recently, Jason Kean and Dennis Staley have built a website for the USGS that provides an interactive map to distribute hazard assessments for areas affected by wildfires. The assessments use (in their words) “geospatial data related to basin morphometry, burn severity, soil properties, and rainfall characteristics to estimate the probability and volume of debris flows that may occur in response to a design storm”.
At present the only data online is for the Colby Fire, which occurred in mid-January this year in Angeles National Forest in California in mid-January. The assessment suggests that the debris flow potential is some of the sub-catchments is rather high:
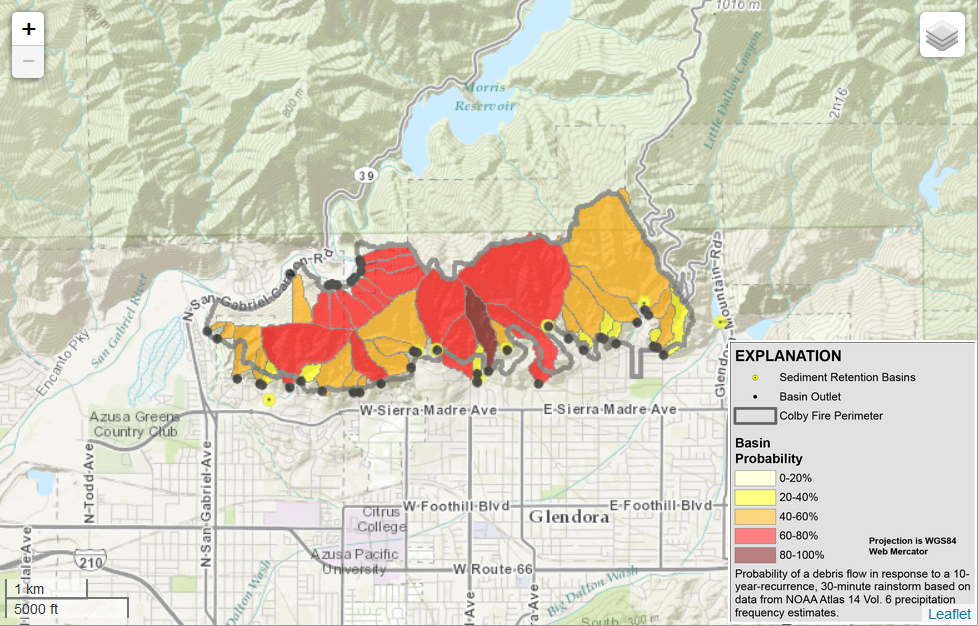
…
Whilst this tool is still in an early stage of development, it will undoubtedly prove to be extremely helpful in terms of the dissemination of information posed by debris flows in wildfire areas.
Reference
Miller, J.D., C.N. Skinner, H.D. Safford, E.E. Knapp, and C.M. Ramirez. 2012. Trends and causes of severity, size, and number of fires in northwestern California, USA. Ecological Applications, 22: 184-203.
20 February 2014
Breaking news: a very large landslide in Alaska on Sunday
Detecting very large landslides with seismic data
Update: this landslide has now been found – it is on the flanks of Mount La Perouse. Details in this blog post.
Regular readers will know that Colin Stark and Goran Ekstrom have developed a technique to use the global seismic network to detect very large landslides – this is published in Ekstrom and Stark (2012) and was accompanied by a commentary that I wrote (Petley 2012). In 2012 they detected the Mount Lituya rock avalanche in Alaska (shown in the image below), and I was extremely fortunate to be able to feature it on this blog before anyone in Alaska was aware of it. They also used this technique to identify the Seti River landslide in Nepal, and various other landslides as well.
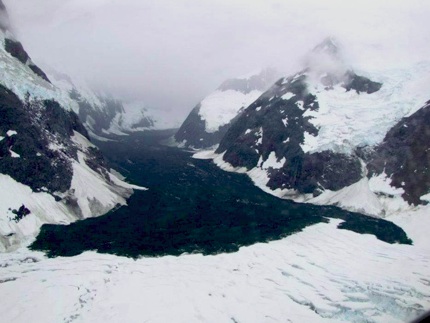
The Mount Lituya landslide on 2012. Sunday’s landslide is likely to be even larger! Source: http://www.nationalparkstraveler.com/2012/07/massive-landslide-coats-glacier-bay-national-parks-johns-hopkins-glacier-chocolate-frosting10200#comment-41027
A new, very large landslide in Alaska
Using this technique, Colin and Goran, together with Clement Hibert, have detected a new, very large landslide in the Alaska panhandle. Clearly this post is with their kind agreement and using information that they have supplied. The landslide occurred on 16th February 2014 (i.e. on Sunday) at 14:24 UT (i.e. at 05:24 local time). Using the LFH techniques in Ekstrom and Stark (2013), the approximate parameters of the landslide can be deduced. This suggests that the landslide had the following characteristics:
- Maximum force Fmax (from single force inversion): ~ 1.25 10^11 N
- Direction: ~ to the ENE
- Using the rough scaling “law” in Ekström & Stark (2013) for mass from max force, mass ~6.8*10^10kg = 68 million tonnes.
These parameters should be considered to be preliminary at this stage, but if confirmed using satellite imagery this will be the largest natural landslide since 2010, and the largest landslide anywhere in the world since the Bingham Canyon mine event.
For reference, the Lituya Mountain landslide (which so dramatic that it was even featured in the Daily Mail!) had a mass of about 20 million tonnes. The seismic data suggests that this landslide may also have run out over ice, so it is likely to be a truly impressive event once it is located.
Update: this landslide has now been found – it is on the flanks of Mount La Perouse. Details in this blog post.
References
Ekstrom, G., & Stark, C. (2013). Simple Scaling of Catastrophic Landslide Dynamics. Science, 339 (6126), 1416-1419 DOI: 10.1126/science.1232887
Petley, D. (2013). Characterizing Giant Landslides. Science, 339 (6126), 1395-1396 DOI: 10.1126/science.1236165
19 February 2014
Jupille 1961: an extraordinary fly ash landslide
The Jupille fly ash landslide of 1961
The Jupille fly ash landslide is a little-known but quite extraordinary mine waste disaster. It occurred in the town of Jupille in Belgium on 3rd February 1961, killing 11 people, consisting of seven children and four women. The landslide originated from a dump of fly ash that was about 29 m high and covered an area of 4 hectares; the disaster was caused by a collapse of about 550,000 tonnes of the fly ash deposit. The remarkable aspect of the landslide though is the rate of movement – the slide traveled about 700 m in about 60 seconds, despite moving down a very low angled slope (about 3 degrees). The landslide impacted the town at the foot of the valley, burying several houses. There is an account of the landslide here, from which this image of the aftermath is taken:
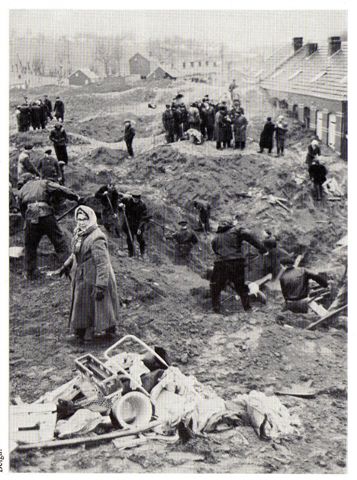
http://obelix-mbm.skynetblogs.be/archive/2009/08/22/un-vendredi-noir-a-jupille-le-3-fevrier-1961.html
..
This short but desperately sad video shows the aftermath of the landslide and the attempts to rescue the victims. At the end it includes a shot of the slope down which the landslide flowed:
..
The mechanics of the Jupille fly ash landslide
Since the disaster there has been a great deal of interest in the mechanics of the landslide, and in particular its exceptional mobility. Whilst the initial failure is quite easy to explain (little more than a rising water table), the high rate of flow requires a more nuanced explanation. It is certainly true that the landslide was unusually mobile. Investigations at the time suggested that the base of the landslide was not water saturated, which led to the suggestion by Calembert and Dantinne (1964) that the flow was caused by air fluidization. In a nutshell the idea is that the particles of ash became suspended in air, allowing the mass to flow like a liquid with very low viscosity. You can get an idea of the process by watching a video of a pyroclastic flow (though remember that pyroclastic flows are very hot, which was not the case here):
..
However, whilst air fluidization this is widely agreed to be a key mechanism is pyroclastic flows, more recent work has rejected it as a process occurring within landslides. This has been in part because exceptional mobility is also observed in landslides in which air fluidization is unlikely to be important, and in part because it has been believed that entrapping sufficient air within the mass is unlikely. But, the Jupille fly ash landslide is essentially unique, so it has been worth revisiting it with modern analytical techniques. In a paper that is online for the journal Geomorphology, Stilmant et al. (2014) have reanalysed the Jupille fly ash landslide using a new numerical model. This model, combined with field observations of the landslide and its constituent materials, suggest that most likely mechanism was indeed air fluidization. Thus, the landslide started with an initial collapse of the spoil heap, which then caused diffusion of the pressurized air through the mass, allowing it to flow at high velocity. This mechanism can explain the observed morphological features of the landslide and the high degree of observed mobility.
Like many others I suspect I had assumed that the air fluidization theory for landslide mobility had been debunked. It is fascinating to see a case in which this may well be the mechanism that explains the observed behaviour.
References
Calembert, L. and Dantinne R. 1964. L’avalanche de cendres volantes survenue à Jupille (Liège) le 3 février 1961. In: Spronck, R. (Ed.), Amici et Alumni – Hommage à Ferdinand Campus, Georges Thone, Liège, Belgium (1964), pp.41-57.
Stilmant, F., Pirotton, M., Archambeau, P., Erpicum, S. and Dewals, B. 2014. Can the collapse of a fly ash heap develop into an air-fluidized flow? – Reanalysis of the Jupille accident (1961). Geomorphology: http://dx.doi.org/10.1016/j.geomorph.2014.01.020
17 February 2014
New paper: the role of fatigue in rockfalls
Context: fatigue in rock
The concept of fatigue in material science is well-established. It describes a process in which structural damage accumulates as a material is subjected to repeated loading. This process is perhaps best known in metals (so-called metal fatigue); it came to the attention of the world in a series of crashes of the first jet airliner, the de Havilland Comet, in 1953 and 1954. In this case the repeated stress cycles applied to the fuselage of the aircaft as it was pressurised and depressurised caused cracks to grow from the corners of the windows in the fuselage; eventually this caused catastrophic failure and in-flight break-up of the aircraft. This image shows a window of one of the aircraft recovered after a crash in 1954 (from the Royal Society); note the cracks radiating from the corners of the window of the aircraft:
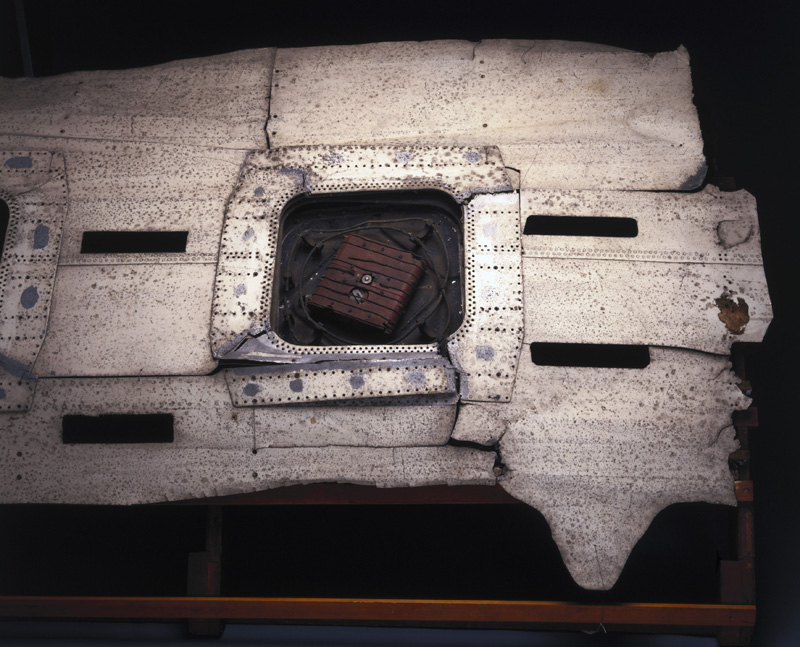
http://trailblazing.royalsociety.org/commentary.aspx?action=printCommentary&eventId=123
..
The key idea behind fatigue is that failure of the material develops though the growth of cracks. Under dynamic stresses (i.e. stresses that repeatedly increase and decrease) the local stress at the tip of the crack can exceed the strength of the material, allowing the crack to grow. Eventually the cracks join together to cause failure. This can occur even when the applied stress is lower than the ultimate strength of the material. In aircraft, this is avoided partly by ensuring that the materials are sufficiently strong to prevent this process, and partly by shaping the windows so that stress cannot concentrate in the corners. These are the windows and doors on an Airbus A380 – note the lack of sharp corners:

http://www.chron.com/news/houston-texas/gallery/Tour-the-new-Lufthansa-Airbus-A380-46851.pTwo
..
Two other things to bear in mind about fatigue. First, the rate of fatigue depends upon the stresses applied – i.e. fatigue can be quite fast when the applied load is close to the ultimate strength of the material, but is much slower when stresses are lower. And second, in many materials there is a fatigue limit – i.e. a stress below which fatigue does not occur. Thus, the process only starts once the fatigue limit is exceeded.
Fatigue in rocks
Whilst best known in metals, fatigue occurs in other materials too, and there is good evidence that brittle rocks can undergo fatigue processes. This of course leads to an interesting question as to when it might be important, and one obvious potential setting is that of rockfalls in which release is controlled by the fracture of the rock. In 2005, Peter Adams and some colleagues from the USA (Adams et al. 2005) proposed that fatigue processes might be important in the generation of rockfalls on coastal cliffs. The idea was that repeated wave impacts on the cliff toe regenerates a cyclic load on the cliff itself. They used a set of seismometers located on the cliff to show that the wave impacts generated small magnitude movements of the cliffs themselves – termed microseismic ground motions . Given that waves strike the cliffs every five to 25 seconds (i.e. about 3 million times per year) they proposed that this might induce a fatigue process that might eventually lead the rock to failure, and thus to the generation of rockfalls. It is a very neat idea, and I like the way that it accounts for progressive weakening of the cliff. They key question of course is whether it is a viable mechanism.
Are microseismic ground displacements a significant geomorphic agent?
In our paper (Brain et al. 2014), for which the work was led by my Post-Doctoral Researcher Dr Matthew Brain, we set out to investigate whether fatigue is a viable mechanism for the generation of rockfalls. We used our long-established field site at Boulby in North Yorkshire, at which we have been measuring rockfall activity since 2002:
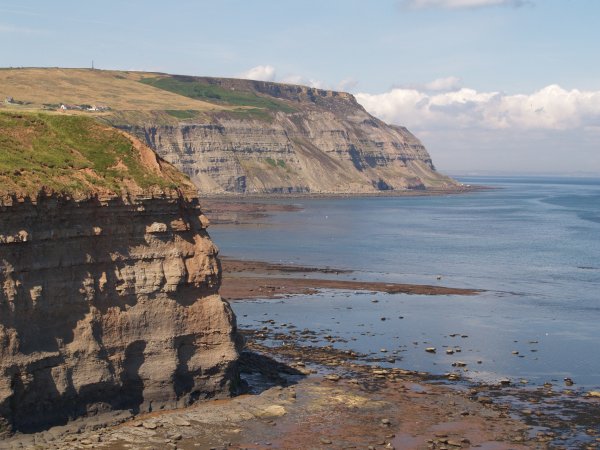
..
At Boulby we have used seismometers to measure the delivery of energy to the cliffs from wave impacts – this work is described in detail in a PhD thesis (Norman 2012), available online, by my former student and now Post-Doctoral Researcher Dr Emma Norman. In Brain et al. (2014) we looked in detail at the microseismic motions that we recorded at the cliff top, showing very clearly that the motions were related to the magnitude of the wave impacts, with the biggest motions being recorded during storms. In te largest events we recorded ground motions of about +/-16 microns. However, during calmer periods (which of course is most of the time), the ground motions were typically only about +/-12 microns – i.e. much smaller. So the key conclusion that we have drawn is that fatigue is likely to be a highly episodic process, and indeed we suggest that ground motions as low as 2 microns would be highly unlikely to cause a fatigue process, primarily because this would be unlikely to exceed the fatigue limit. Given that this reduces dramatically the number of cycles to which a cliff is subject, it is unlikely that coastal cliffs would fail in this way.
Of course the greatest microseismic motions also occur when the cliff is subject to a range of other processes that can induce failure, such as high pore water pressures and wind loading. Thus, it is more likely that one of these other processes would lead to detachment. We do recognise though that the progressive weakening of the rock mass caused by microseismic motions might contribute to the failure process.
References
Adams, P.N., Storlazzi, C.D. and Anderson, R.S. 2005. Nearshore wave-induced cyclical flexing of sea cliffs. Journal of Geophysical Research, 110: F02002 http://dx.doi.org/10.1029/2004JF000217
Brain, M.J., Rosser, N.J., Norman, E.C. & Petley, D.N. Are microseismic ground displacements a significant geomorphic agent?. Geomorphology 207:161-173. http://dx.doi.org/10.1016/j.geomorph.2013.11.002
Norman, E.C. 2012 Microseismic monitoring of the controls on coastal rock cliff erosion. Doctoral thesis, Durham University.
14 February 2014
Xinjiang earthquake: a good new image of the landslides
The Xinjiang earthquake (also known as the Kunlun Earthquake) on 12th February is now known to have triggered at least some landslides. A fascinating image has been posted on Xinhua of some of the hillslopes affected by the earthquake:
http://news.xinhuanet.com/english/photo/2014-02/14/c_133115290.htm
..
These appears to be shallow rockslides in weathered material – interestingly, most of the slips are on the gully flanks, but do not seem to have progressed to full failure. The more I look at this image the more landslides I see! I find some of the images from yesterday interesting too – for example, this image shows clear signs of old landslides – I have annotated the multiple tension cracks on one of these landslides:
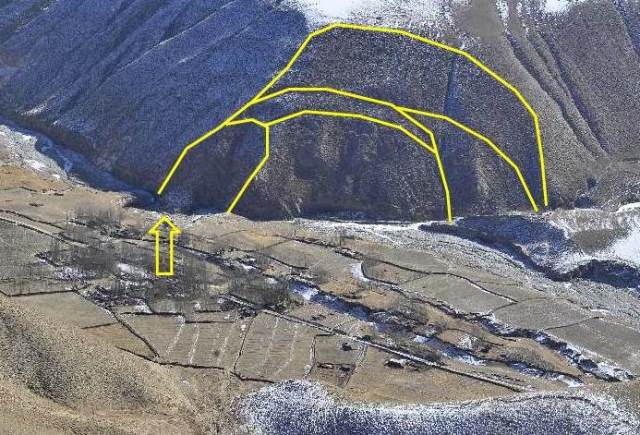
http://news.xinhuanet.com/english/photo/2014-02/13/c_133113060_10.htm
..
The only obvious feature that could be an earthquake induced landslide is highlighted with an arrow (although I am not sure that even this is actually a landslide). There is another possible small slide in the complex further along the valley. If this earthquake was not large enough to reactivate these landslides, I wonder what the original trigger was.
The best source of information about this event, and other earthquakes in this area, is the Tibet Earthquake twitter account: @aam868
13 February 2014
Xinjiang: Landslides from the M=6.9 earthquake in NW China yesterday
The Xinjiang earthquake
The Chinese province of Xinjiang was hit by a shallow, Mw=6.9 earthquake at 9:20 UTC yesterday. The USGS data suggests that this occurred on a strike-slip fault in a remote and reasonably mountainous area:
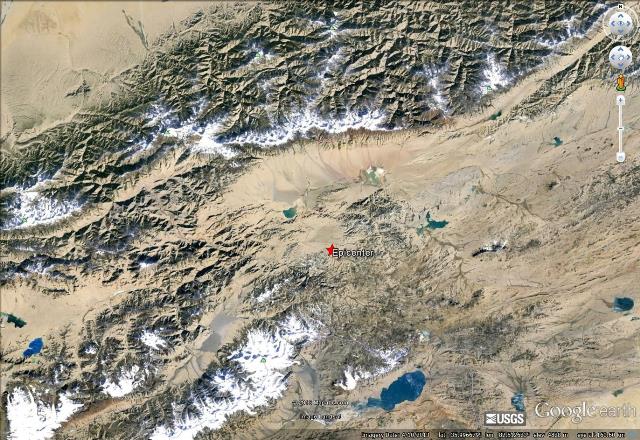
..
Landslides from the Xinjiang earthquake
The more observant of you will have noticed I have changed the images. It turns out that the earlier ones weren’t from this earthquake!
A shallow (10 km deep) earthquake of this magnitude certainly has the potential to generate significant numbers of landslides (and of course damage), but of course the human impacts are fortunately limited because of the low population density in this area. Indeed Xinhua is reporting no casualties and about 7,000 people affected.
However, this event could be interesting from a landslide perspective. Xinhua has a set of images of the area affected by the earthquake. One of them shows a landslide-affected road:
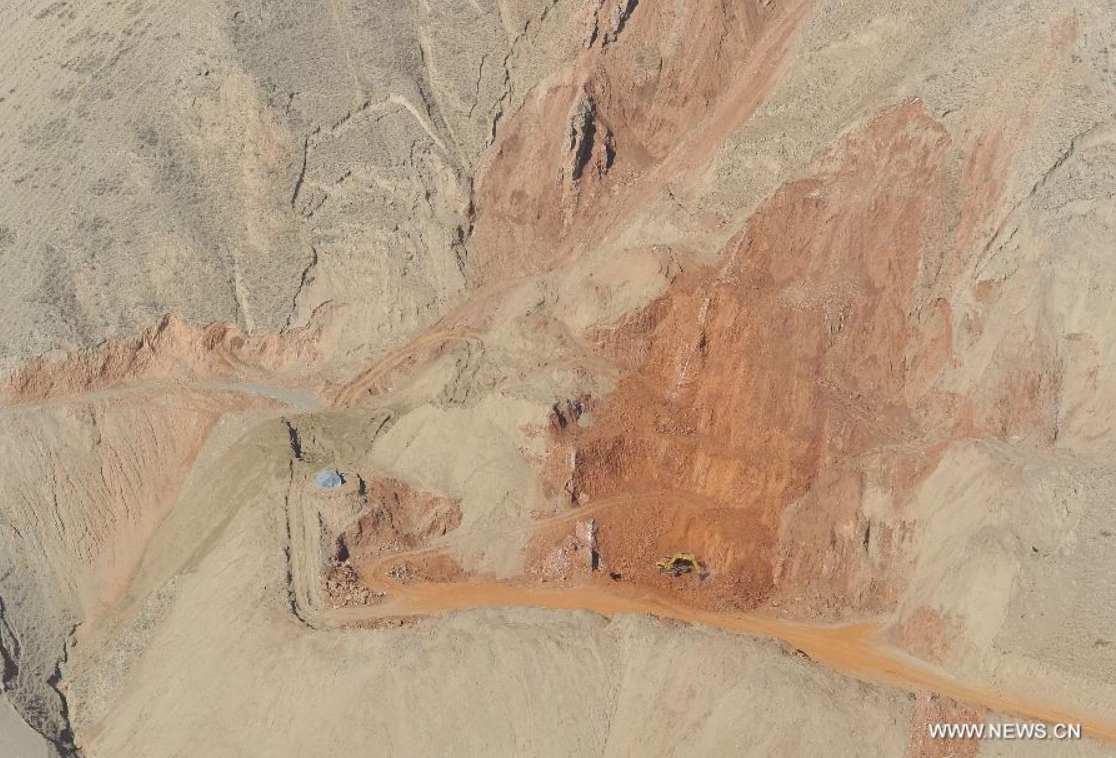
http://news.xinhuanet.com/english/photo/2014-02/13/c_133113060_14.htm
..
Whilst others suggest that the impact of landslides might have been quite light (but note the apparently fresh slumps in the foreground):
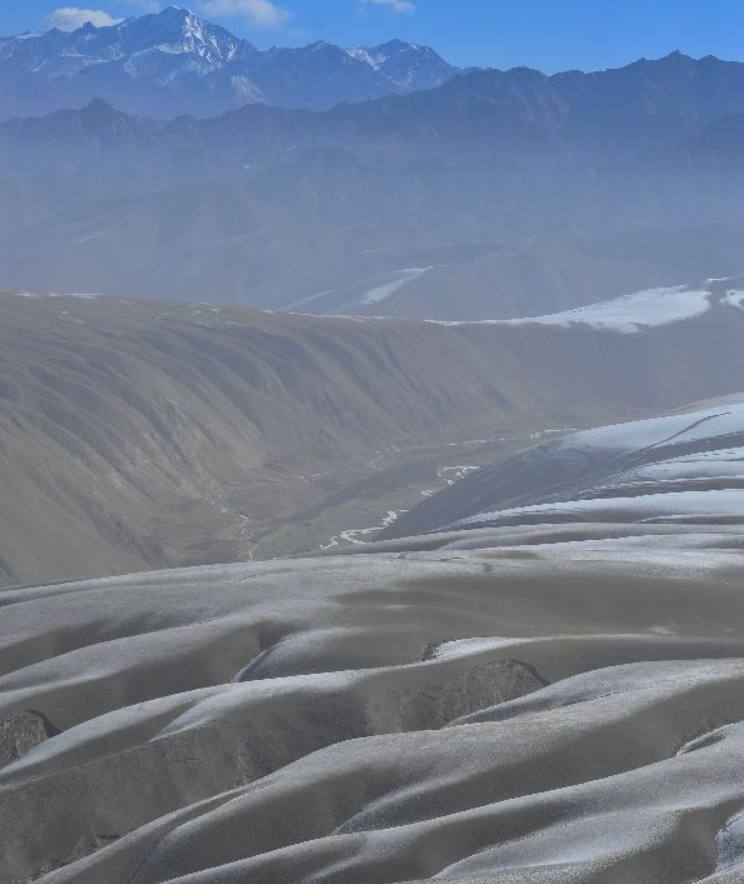
http://news.xinhuanet.com/english/photo/2014-02/13/c_133113060_14.htm
..
Hopefully further images will appear in the coming days.
Comments Off on Xinjiang: Landslides from the M=6.9 earthquake in NW China yesterday
 Dave Petley is the Vice-Chancellor of the University of Hull in the United Kingdom. His blog provides commentary and analysis of landslide events occurring worldwide, including the landslides themselves, latest research, and conferences and meetings.
Recent Comments