
18 January 2023
Joshimath: new InSAR analysis sheds light on active deformation
Posted by Dave Petley
Joshimath: new InSAR analysis sheds light on active deformation
In Joshimath the landslide crisis continues, imposing a big impact on the people of the town. Apparently the investigation of the landslide is ongoing, although the exact nature of this is unclear. There is a very bold statement from unnamed “scientists” that the situation is getting better. The New Indian Express reports that:-
“The land of the land submergence area in Joshimath is trying to stabilise,” the scientists believe. However, it will take some more time.
As soon as the summer starts, there will be a positive change in the situation. “The flow of water in JP Colony of Joshimath, which was happening at a speed of 10 litres per second, is now happening at 1.9 litres per second, which is comforting,” said scientists, who didn’t want to be named.
This is slightly odd. First, the summer is a long way hence, and second the summer will bring monsoon rainfall, which is unlikely to help (although it will not necessarily have an adverse effect). Finally, of course, the land is not trying to do anything except obey the laws of physics.
More importantly, we now have additional insight into the landslide from a new InSAR analysis undertaken using the Sentinel-1 instrument. This has been undertaken by renowned scientists from AUTh (Aristotle University of Thessaloniki) and CNRS-EOST (Centre National de la Recherche Scientifique / Ecole et Observatoire des Sciences de la Terre / Strasbourg) using the SNAPPING PSI Full Resolution service. The work has been released online and is freely available, with further analyses under way.
The team has produced two sets of analyses, including a times series for the movement of the slopes. The first examines movement over the period from January 2018 to 31 December 2022:-
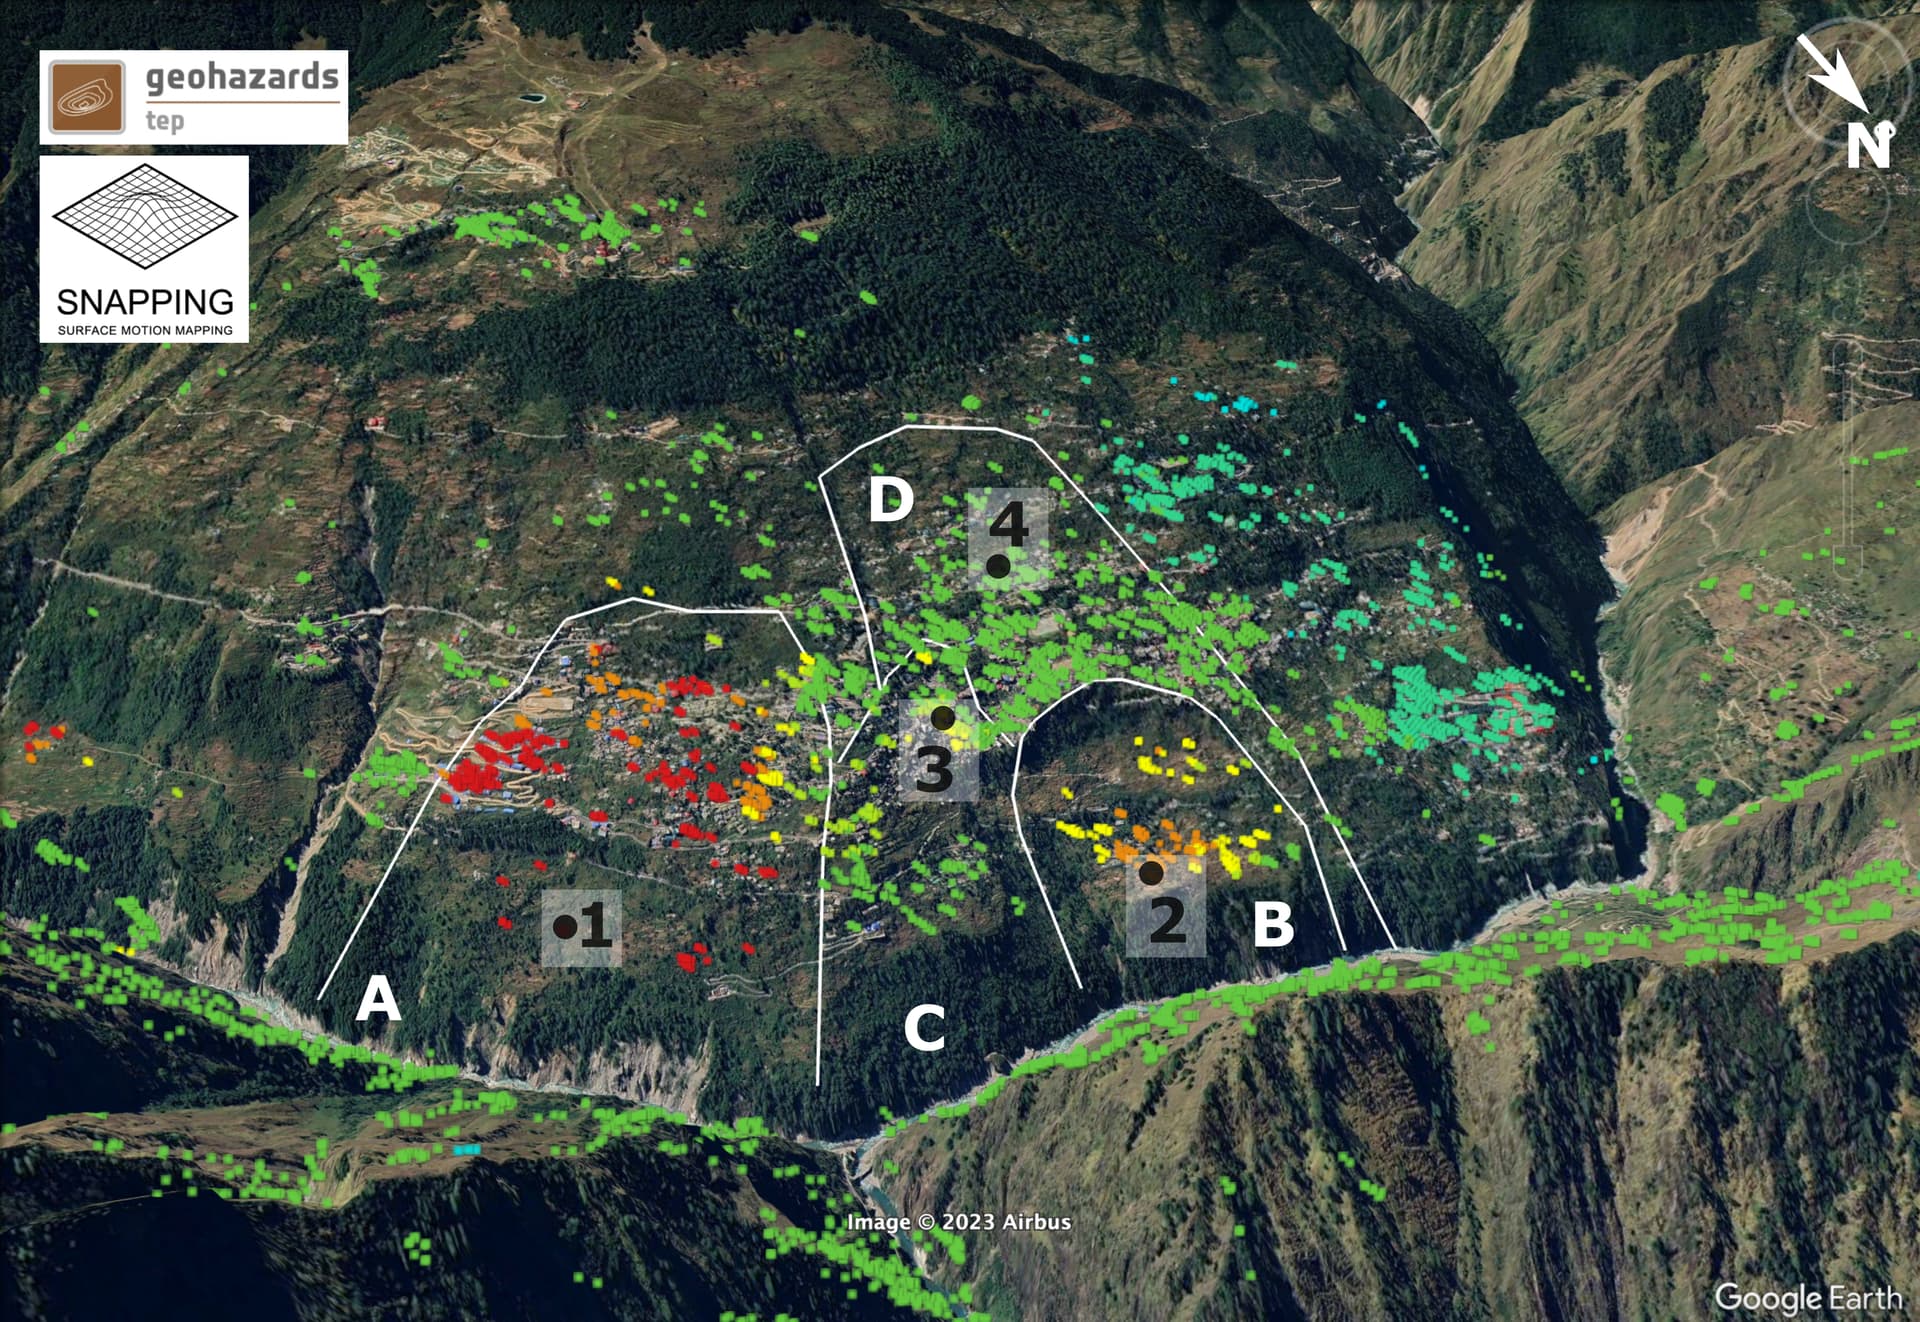
3-Dimensional view of the Joshimath slope with the SNAPPING Full Resolution PSI results overlaid (background Google Earth). The location of the active units (A, B, C, D) are delimited by white lines. The location of selected PSI targets 1, 2, 3 and 4 are also indicated. Image posted online on the gep-blog.
.
This diagram clearly shows the various landslide units upon which the town is built, and the movement patterns that they display in the long term. It confirms that the deformation is sliding, not subsidence, as expected.
A really important element of this work is that the team has produced a time series plot for points shown on the diagram above:-
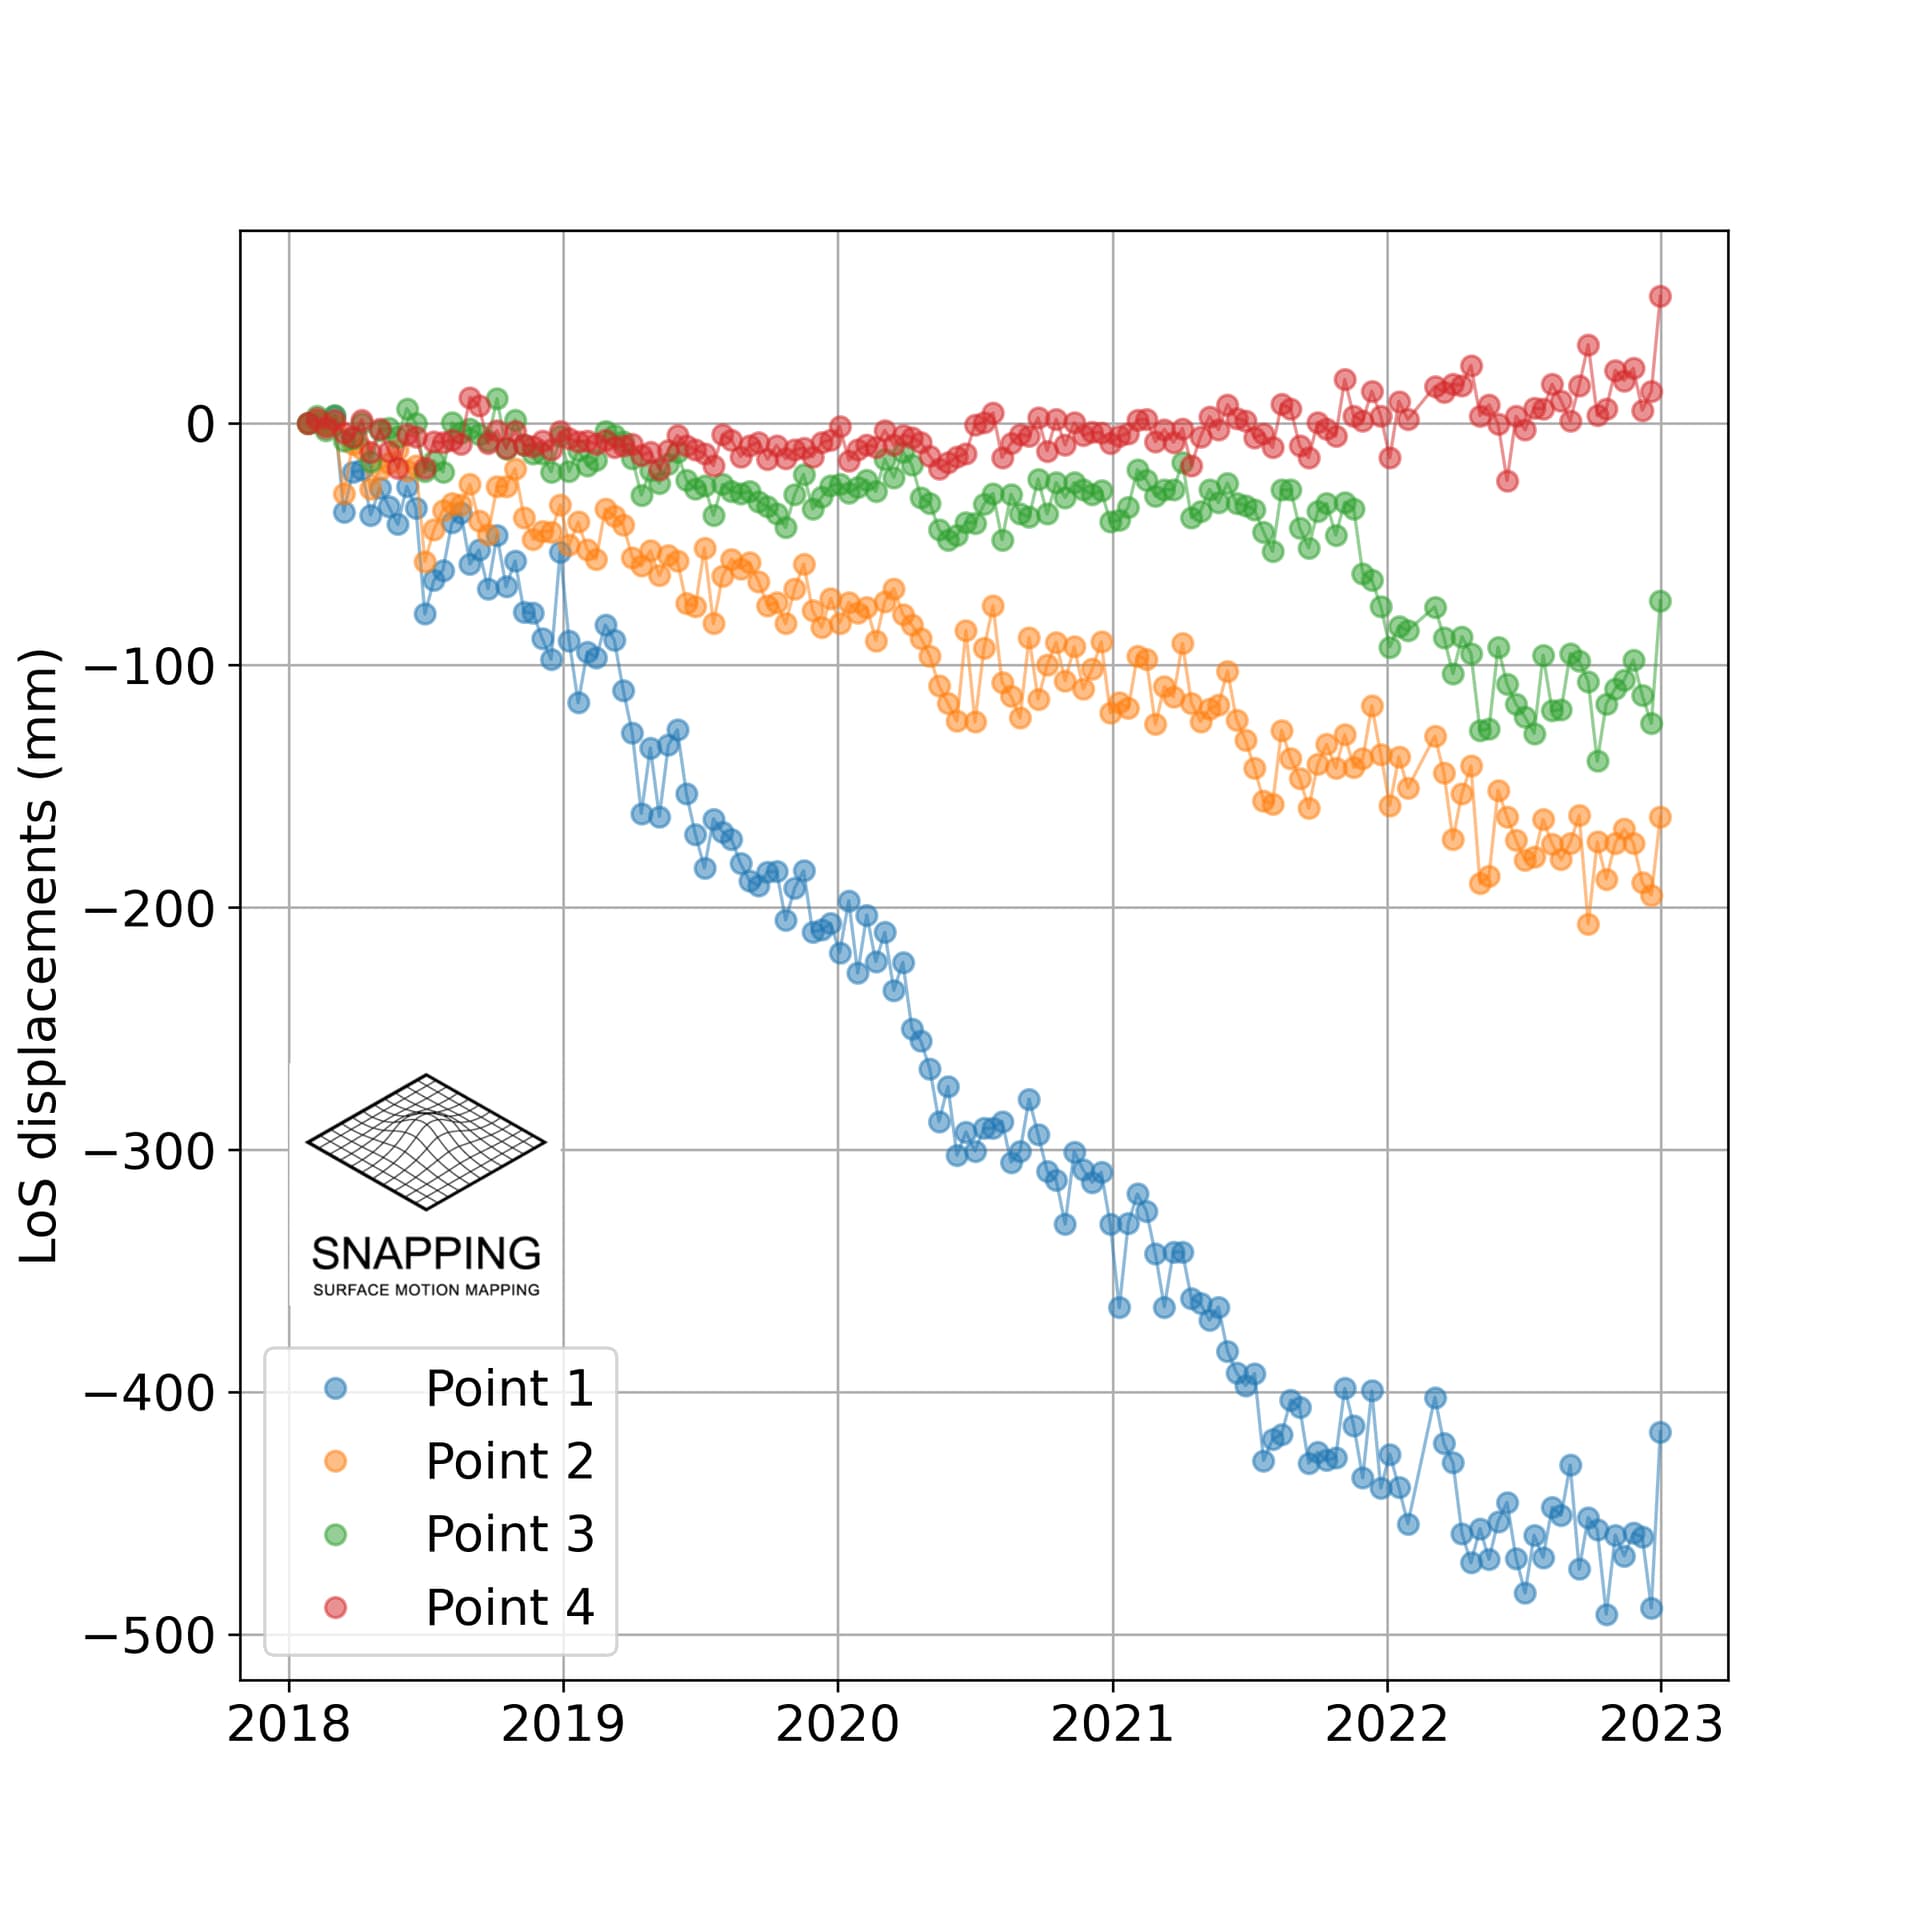
SNAPPING-derived LoS displacement time series on four points over the Joshimath slope for the period 01/2018-12/2022. The temporal evolution of surface motion among the various slope units follows a complex pattern, with different displacement rates. Image posted online on the gep-blog.
.
There are a few things to note here. First, in the long term the different parts of the landslide complex are moving at different rates, which is not unusual. Point 1 is showing large displacements – almost half a metre with continuous creep, although the rate clearly fluctuates with time (this is similar to the results we got for the Utiku landslide in New Zealand for example). Other parts of the complex are moving more slowly, and indeed the point highest up the slope is not moving.
Point 3 shows a significant change in movement rate in late 2021.
The second analysis undertaken by the team examines movement over the last few weeks:
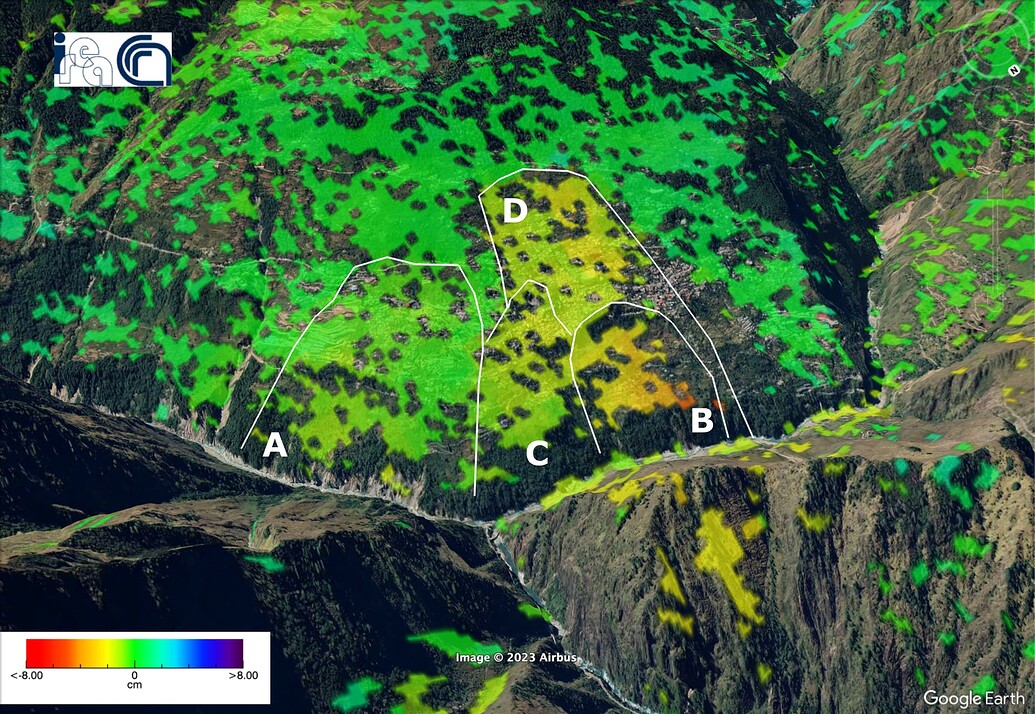
Unwrapped differential interferogram computed with the P-SBAS service for the Sentinel-1 ascending track 129 between the acquisitions of December 31, 2022 and January 12, 2023. Unwrapped differential interferogram provides the displacement of the ground in the LoS direction between two acquisitions. The orange and red colors indicate motion far away from the satellite corresponding to the downhill motion of the slope. Contains modified Copernicus Sentinel-1 images, 2022-2023. Image posted online on the gep-blog.
.
The analysis shows that three portions of the landslide complex are currently moving, with the highest rates towards the lower part of the slope. The boundaries of the movement coincide with the margins of the landslide blocks identifiable from Google Earth. We would expect to see some of the greatest amounts of building damage occurring around these margins. Thus, it is really interesting to compare the above diagram with the map posted to Twitter by Thiyagarajan J (@jThiyagu) that shows the location of the wards damaged by the landslide:-
https://twitter.com/jThiyagu/status/1612090648982851585
.
There is a strong coincidence, which suggests that these analyses are starting to pin down in more detail the nature of the landslide problem at Joshimath.
Movement of landslide complexes such as this is very complex, and we would expect to changes in the rate occurring through time. Thus, great care is going to be needed in interpreting short duration time series data. But, the bottom line is that this slope is unlikely to achieve permanent stability in its current physical state without significant engineering intervention. The current crisis will abate at some point, but the underlying chronic problem, whatever the cause, is likely to remain. That is not to say that all is lost by any means, the immediate crisis will pass, but action is likely to be needed.
.
Acknowledgement
Many thanks to colleagues from AUTh (Aristotle University of Thessaloniki) and CNRS-EOST (Centre National de la Recherche Scientifique / Ecole et Observatoire des Sciences de la Terre / Strasbourg) for making this analysis available online.
 Dave Petley is the Vice-Chancellor of the University of Hull in the United Kingdom. His blog provides commentary and analysis of landslide events occurring worldwide, including the landslides themselves, latest research, and conferences and meetings.
Not a better opportunity to see the need for Earth Monitoing as opposed to Earth Observation. This did not start yesterday …. and the ongoing displacements are quite significant. Local geometry and the Sattelite LOS are also at play in these InSAR views. Area of point 1 clearly needs GbSAR deployed sooner than later to really characterize the rate and dimension of displacements in that area !
It would be good to know when this slow movement actually started.
Point no. 1 is located on a local subsidence. Same may be checked again by taking some more points in upper portion of part ‘A’.
Zone B is the actual zone which got caught attention and brought Joshimath event to light during early January 2023
This zone was witnessing much faster movement and enlargement of cracks in building due to sudden outpouring of water which was lubricating the subsurface material and facilitating development of cracks faster
Zone A was witnessing less rapid movement compared to Zone B though Zone A which is more densely populated on whole has been witnessing downslope movement for sometime and therefore more building reported with cracks
This work shop is very useful for our future