
7 August 2023
A new home for the Landslide Blog
A new home for the Landslide Blog
I started this blog on 16 December 2007 – that feels like a long time ago now – as a site on Blogger. In 2010, the American Geophysical Union established the AGU Blogosphere, and I moved the blog to this site at that time. For almost 13 years it has been a great home for this blog. However, you may have been aware that I have been facing technical issues with the site for a while now, which have not been the fault of the AGU. Thus, I have been looking for a new, permanent home for the blog.
I’m delighted to say that as from today (7 August 2023) I will move to the new site. This is being hosted by the AGU once again, but this time on their Eos site. In their own words, “Eos is the science news magazine published by AGU”. This is a fantastic new home for the blog. The content will remain exactly the same, although the presentation will look a little different.

AGU Eos, the new home for the Landslide Blog.
So, from today new posts will be at https://eos.org/landslide-blog. The archive of older posts will remain on this site, although the long term aim is to migrate it as well.
I want to thank all those who have been so supportive at this site, most notably Larry O’Hanlon, who has worked tirelessly behind the scenes to help me in a myriad of ways.
So please do join me at the new home for the Landslide Blog: https://eos.org/landslide-blog
3 August 2023
A very lucky escape in a debris flow in Arunachal Pradesh, northern India
A very lucky escape in a debris flow in Arunachal Pradesh, northern India
The Arunachal Times has tweeted a remarkable video showing an exceptionally lucky escape for the driver and passengers of a car that was struck by a debris flow in Arunachal Pradesh in northern India. The event occurred in the Ribi Korong area on the road between Pashighat and Yingkiong on Friday 28 July 2023. This is the video:-
The passengers of a #TataNexon vehicle had a lucky escape when a sudden burst of water caused by #HeavyRainfall washed away their vehicle at Ribi Korong area on the #Pasighat–#Yingkiong road on Friday morning. pic.twitter.com/84ghoj8Jz6
— The Arunachal Times (@arunachaltimes_) July 28, 2023
.
One passenger escaped just as the debris flow struck the car, and fled to the near side of the channel. The driver and another passenger were in the vehicle when it was struck. They were extremely fortunate that the debris flow front pushed the car to the side of the flow, where it became wedged, rather than either rolling it or incorporating it into the landslide. This image shows how close the occupants were to a disaster – the door had just been opened whilst on the other side the debris flow level was close to the windows:-
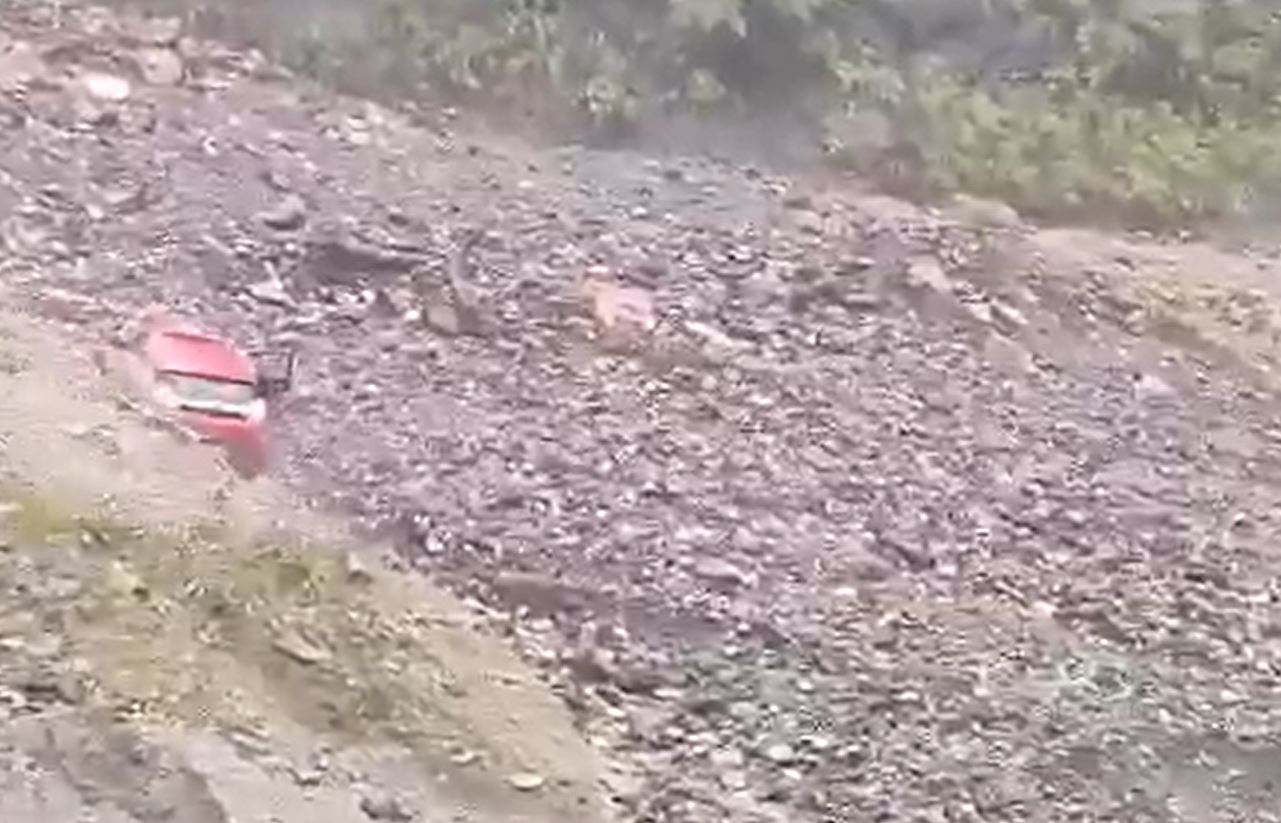
The driver starts to escape from the 28 July 2023 debris flow at Ribi Korong in Arunachal Pradesh in northern India. Still from a video tweeted by the Arunachal Times.
.
The precise location of this event is not clear to me. It is reported to have been about 16 km from Pashighat, but I have not been able to tie it down more precisely.
This event continues the pattern of landslides and flooding that is occurring in many locations at the moment. For example, Beijing has just suffered an exceptional rainfall event, with some areas having received about 750 mm between 29 July and 1 August 2023, caused by the remnants of Typhoon Doksuri. The tropical cyclone season is in its comparatively early stages in both the northern hemisphere parts of the Atlantic and the Pacific Oceans, with the most damaging storms often occurring later in the year, plus the northern hemisphere monsoon still has a long way to go.
2 August 2023
Bisisthal: a one million tonne rock slope collapse in Switzerland
Bisisthal: a one million tonne rock slope collapse in Switzerland
On Sunday 30 July 2023 a large rock slope collapse occurred close in the area of the village of Bisisthal in Switzerland. The collapse occurred in the Gwalpeten area in two phases, consisting of an initial fall of about 150,000 cubic metres, followed by a second collapse of about 300,000 cubic metres.
The failure occurred in an area that was known to be unstable and that was being monitored. Increased rates of movement had been noted in recent weeks.
There are some videos of the collapses on Youtube. There was a webcam mounted at the top of the slope, monitoring the rock pillar:-
.
Whilst an even better video was collected from within the valley. This video is worth a wait – the initial small event is not the main collapse:
.
This video beautifully captures the initial multiple collapses of the rock slope and the transition to a rock avalanche:-
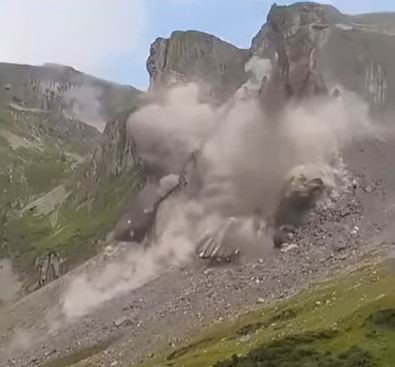
The rockslope collapse near to Bisisthal in Switzerland on 30 July 2023. Still from a video posted to Youtube.
.
There are other videos too – a Swiss news report presents a medley of them.
The location of the landslide near to Bisisthal is [46.8933, 8.8614]. At the time of writing there has been too much cloud since the collapse to allow the acquisition of good satellite images of the aftermath.
The rock avalanche occurred in an area of talus and mountain pasture, so there was no loss of life and no damage to key buildings or infrastructure, and the cattle that graze the area had been moved to a safe place. There is an interesting article on the website of Innet Monitoing AG about the work that it undertook at the site. Further rockfalls are possible.
.
Acknowledgement
Many thanks to Mauro Häusler for tipping me off about this major event.
31 July 2023
Two new mudflow videos
Two new mudflow videos
Around the world, and not just in the Northern Hemisphere, intense rainfall events are triggering landslides and inducing significant flooding. This is likely to be a combination of the normal annual climatic cycle and the effects of the highest atmospheric and sea surface temperatures on record.
The figure below, from Froude and Petley (2018), shows the global pattern of fatal landslides, using pentads (five day blocks) through the year. The data shows that the global peak occurs in the period between the 40th and 45th pentads, which is 15 July to 13 August. However, the event rate this year appears to be exceptionally high.
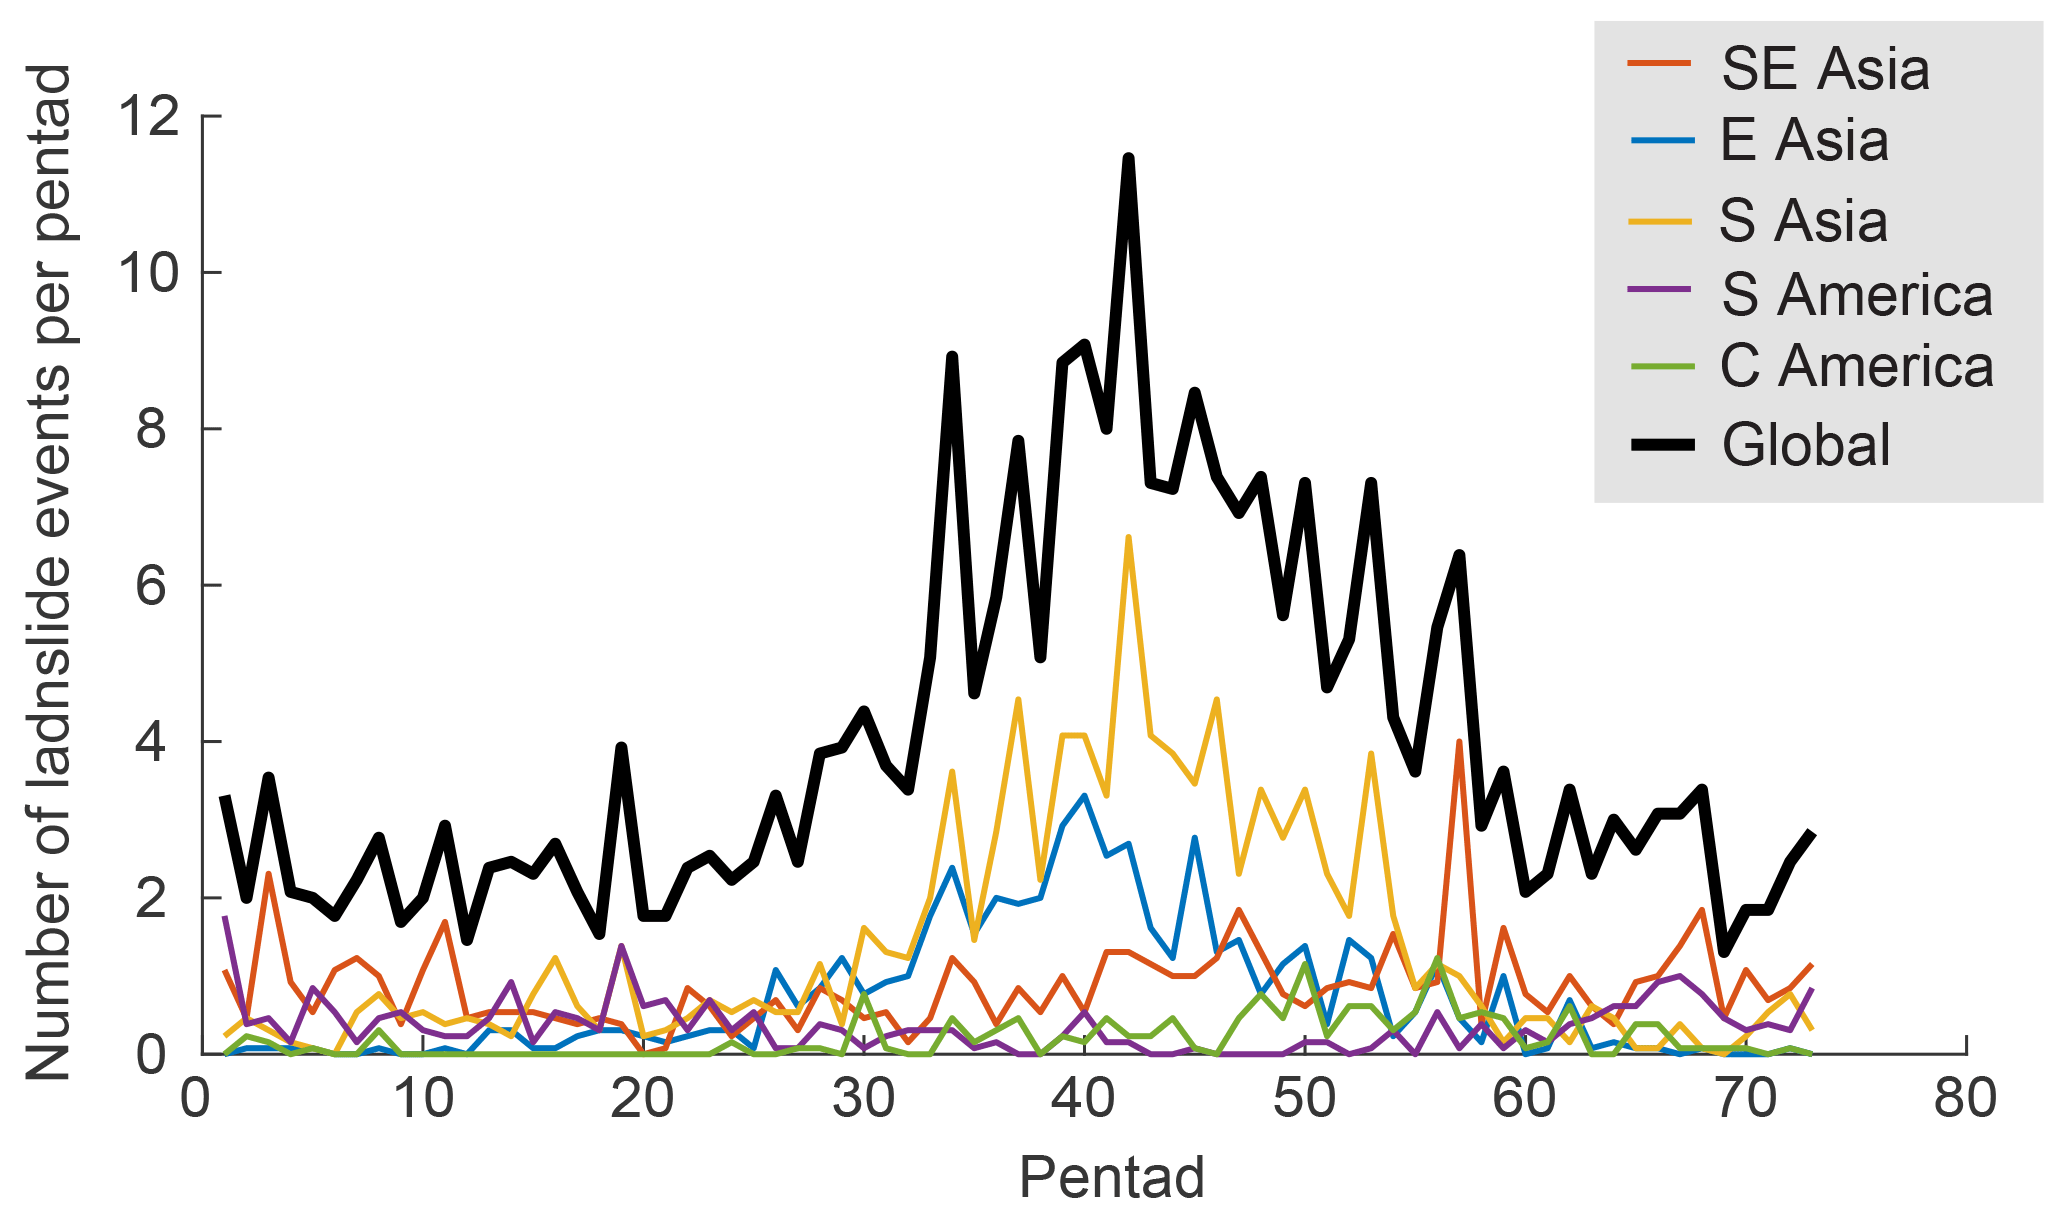
The mean number of landslides per pentad through the annual cycle for all rainfall-triggered landslides, by geographical region. The 20th pentad is the 6–10 April, the 40th pentad is 15–19 July and the 60th pentad is 23–27 October. From Froude and Petley (2018)
.
There are many landslides being caught on video – for the most part I try to Tweet these (@davepetley) rather than including them here, but some are proving to be quite spectacular. Two good examples have emerged over the weekend. The first is a very powerful mudflow that was triggered by heavy rainfall in Nan’An in Fujian Province in China, posted on 29 July 2023:-
Nan'an, Quanzhou, torrential rains lead to mudslides pic.twitter.com/TzFUwt26Yw
— Jim (@yangyubin1998) July 29, 2023
.
Nan’An is at [24.95, 118.38], although the precise location of this very violent mudflow is unclear.
Heavy rainfall is being reported in the area of Beijing today (31 July 2023), with some remarkable videos of flooding. Rainstorm warnings are in place across much of northern China. This event was caused by the remains of Typhoon Doksuri. Fortunately, no-one was killed but economic losses could exceed $500 million.
Meanwhile, a mudflow is a river in Valdoara in South Tyrol, Italy on 29 July 2023 has also been posted to Twitter:-
https://twitter.com/alex_le_bars/status/1685369384783536128
.
The location appears to be [46.75107, 12.01525]. According to reports in Italian, the event was triggered by an intense thunderstorm. Damage was caused to roads, bridges, the power infrastructure and trees.
I suspect that more videos of this type will emerge in the coming days.
.
Reference
Froude, M. J. and Petley, D. N. 2018. Global fatal landslide occurrence from 2004 to 2016. Natural Hazards and Earth System Sciences, 18, 2161-2181, https://doi.org/10.5194/nhess-18-2161-2018.
25 July 2023
The location of the 20 July 2023 debris flow at Ungar in Lhuentse, Bhutan
The location of the 20 July 2023 debris flow at Ungar in Lhuentse, Bhutan
Yesterday, I posted about a debris flow disaster that occurred on 20 July 2023 at Ungar (also spelt Unger and Unngar) in Bhutan, which is believed to have killed 23 people. Dr Stuart Dunning (@Rock_Avalanches) of the Newcastle University tweeted (or is that Xeeted?) a possible location for the accident, based upon Planet Labs images:-
Ungar, Bhutan debris flow @davepetley ? Right is June, left is July 22nd @KuenselOnline @glof_Sonam pic.twitter.com/CjQErRNXEs
— Stuart Dunning (@Rock_Avalanches) July 24, 2023
.
This location is [27.57095, 91.07595]. Looking at the photographs of the site, I think that this is indeed the location. This is a Planet image of the site collected on 15 July 2023:-
The site of the 20th July 2023 debris flow at Ungar in Bhutan. Image copyright Planet, used with permission. Image dated 15 July 2023.
.
This is an image collected on 22 July 2023, showing the aftermath of the debris flow:-
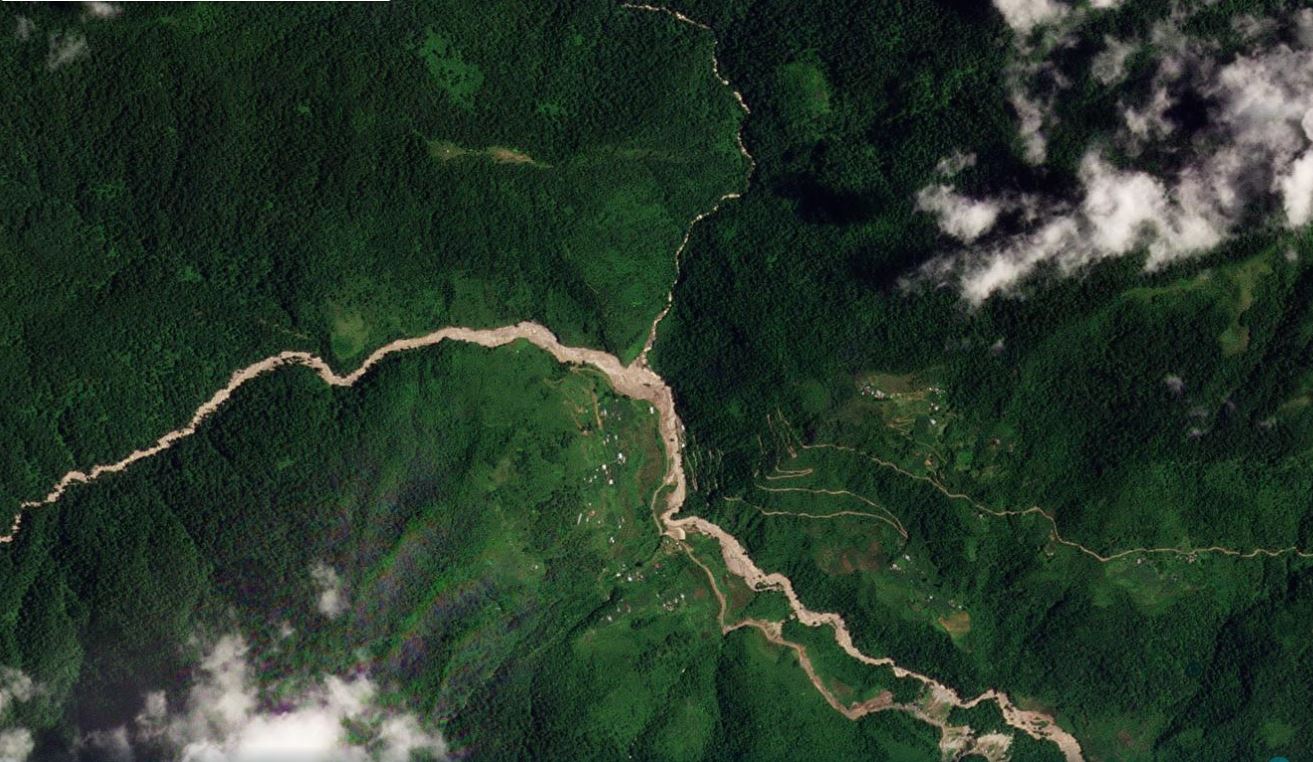
The aftermath of the 20th July 2023 debris flow at Ungar in Bhutan. Image copyright Planet, used with permission. Image dated 22 July 2023.
.
Below is a slider that should allow you to compare the two images:
.
In the image before the disaster, there appears to be a set of structures in the channel immediately below the confluence of the two tributaries. In the image after the debris flow, these structures have clearly been destroyed. The decision to locate a camp, if that is what happened, in such a vulnerable position is interesting. As I noted previously, there are multiple examples in which landslide hazard has not been properly considered in hydroelectric schemes in the Himalayas.
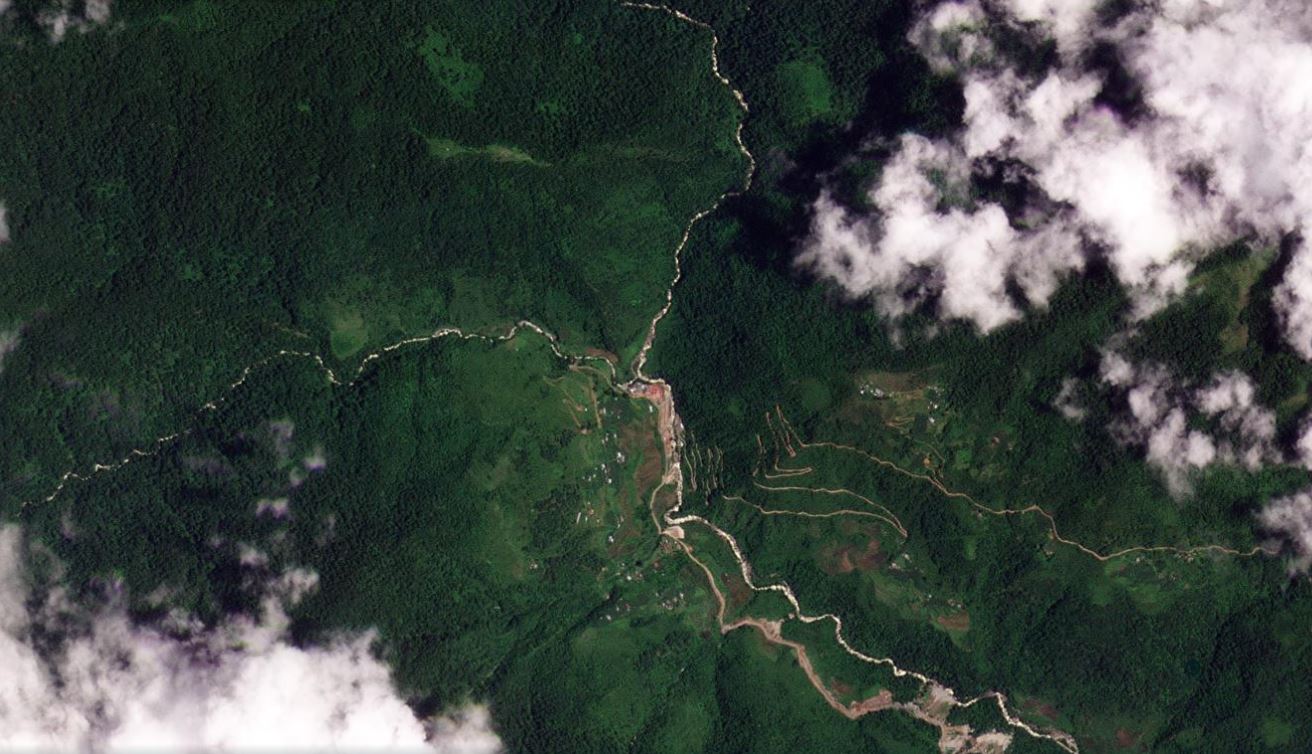
The source area for the debris flow, to the west of the images above, is shrouded in cloud in the images since the accident. However, this is what the catchment looks like on Google Earth – the pin is the location of the camp:-
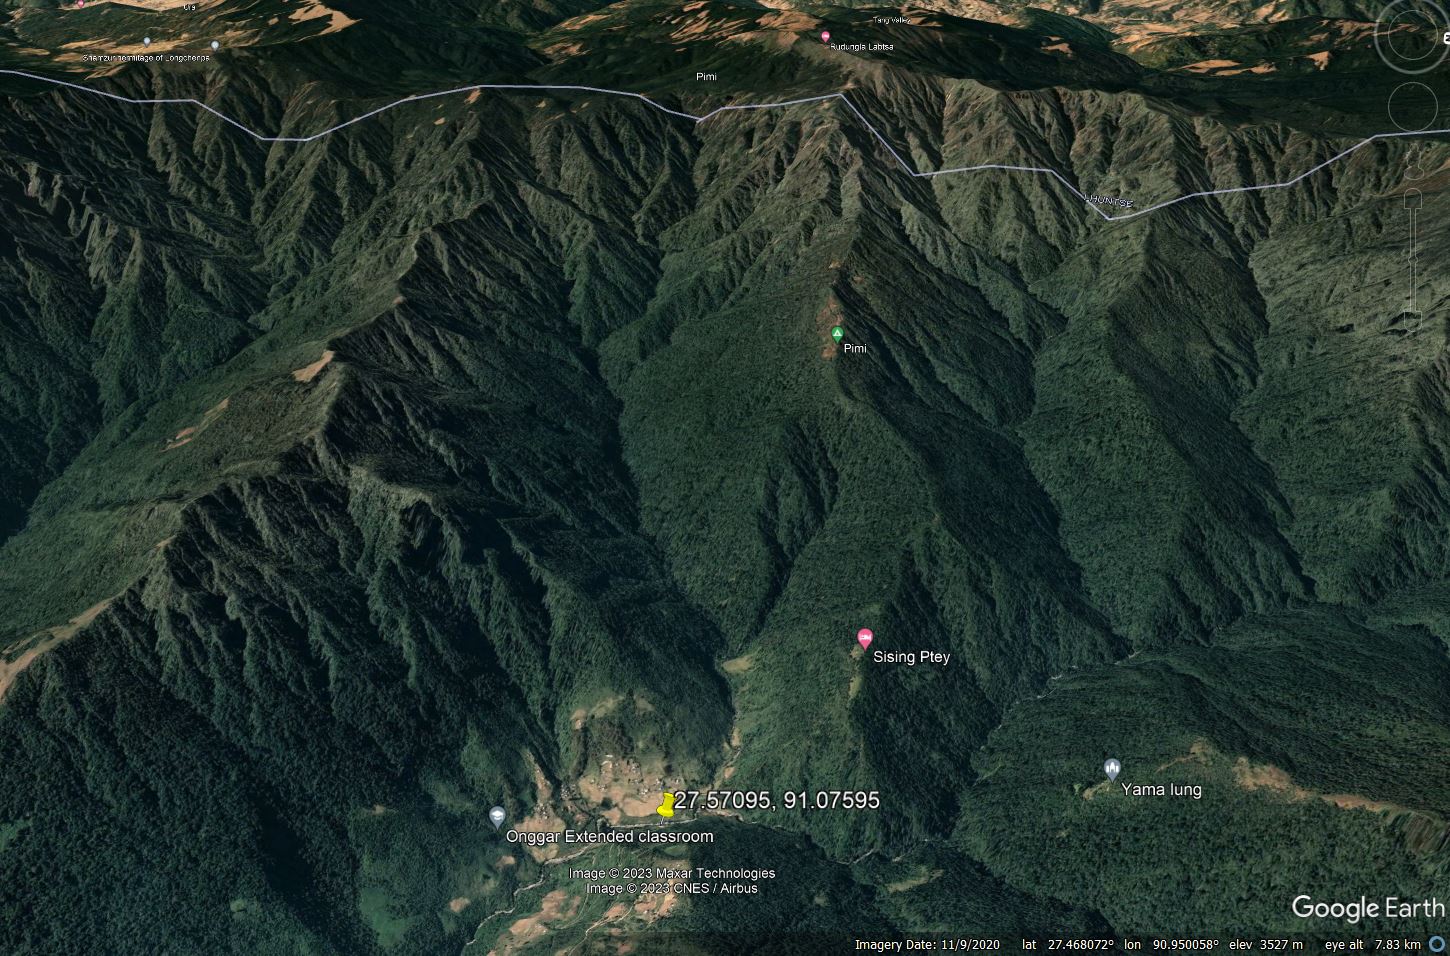
Google Earth image showing the catchment of the 20 July 2023 debris flow at Ungar in Bhutan.
.
This is clearly a very steep, dissected landscape, with multiple small tributaries feeding into the main channel. This is a classic for landscape for small slips combining to create a channelised debris flow. Unfortunately, cloud free images may not become available until the end of the monsoon.
.
Acknowledgement
Planet Team (2023). Planet Application Program Interface: In Space for Life on Earth. San Francisco, CA. https://www.planet.com/
24 July 2023
An update on the 19 July 2023 Irshalwadi landslide and a catastrophic debris flow in Bhutan
An update on the 19 July 2023 Irshalwadi landslide in India
The rescue and recovery operation for the 19 July 2023 Irshalwadi landslide in India has now been terminated. In total, 27 bodies were recovered. A further 57 people have now been recorded as having been killed but not recovered, leaving a total toll of 84 people, making this the most deadly event of the 2023 Northern Hemisphere monsoon to date.
The focus us now on those left homeless by the landslide. The Indian Express has an article that notes that commitments have been made to rehouse the survivors. I very much hope that this happens, but around the world the record is not good once the focus shifts to the next event.
[I have removed the image that was originally here as it turns out it was a different landslide].
Heavy rainfall continues across parts of India, with Uttarakhand being particularly at risk this week.
.
The 20 July 2023 debris flow at Ungar in Lhuentse, Bhutan
Meanwhile, on 20 July 2023 a debris flow hit Ungar in Lhuentse in Bhutan. Whilst this has been reported as a flash flood, the descriptions match that of a debris flow. Khuensel has an article providing the latest information – to date seven bodies have been recovered and a further 16 people are missing, with no prospect of survivors. It appears that the debris flow struck a camp that was housing workers from Druk Green Power Corporation.
“The victims included Druk Green Power Corporation employees like work supervisor, section officer, surveyors, machine operators, electricians, and plumbers.”
And
“Machinery like excavators, air compressors, bumping machines, rod bending and other machines were lost to the flood. The eight private light vehicles were also damaged.”
The camp had been established as part of the Yungichhu Hydropower Project. I have noted previously that many hydroelectric schemes in the Himalayas pay inadequate regard to the landslide risk; this could be another such case.
Interestingly, Google Earth has a site marked as “Yangichu hydroproject campsite” at [27.5263, 91.1281], but I cannot confirm whether this is the location of the disaster.
Another Kuensel article has a image of the aftermath of the debris flow:-
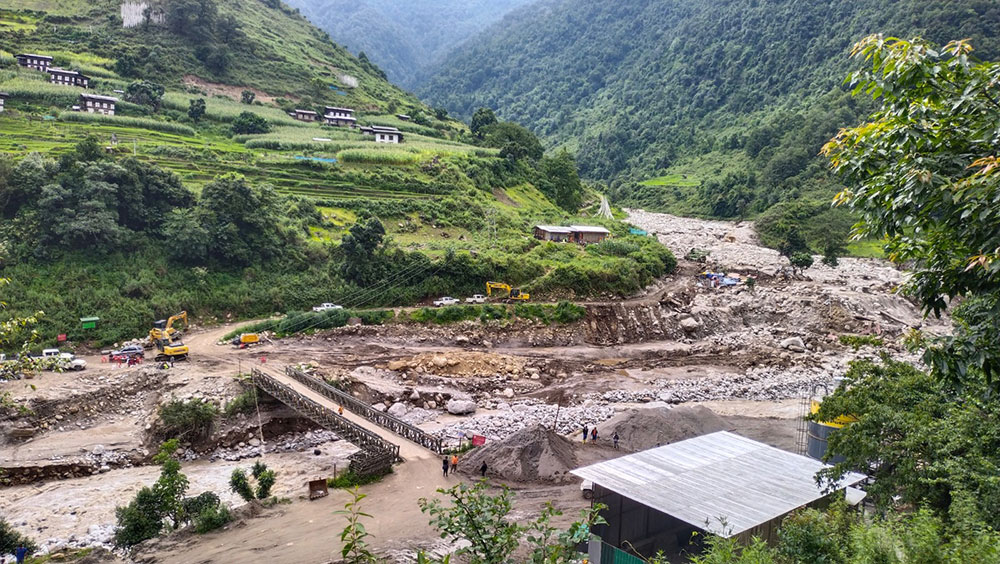
The aftermath of the 20 July 2023 debris flow at Ungar village in Bhutan. Image from Khuensel online.
.
There are reports of cloudburst events in the region at the time, so it is likely that this disaster was caused by localised, very intense rainfall.
21 July 2023
The 19 July 2023 landslide at Irshalwadi in Khalipur, India
The 19 July 2023 landslide at Irshalwadi in Khalipur, India
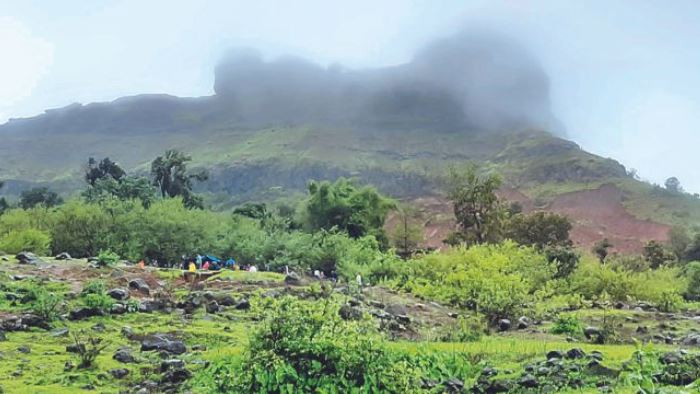
Late in the evening of 19 July 2023, a major landslide destroyed the village of Irshalwadi in Khalapur tehsil, which is located in Raigad district in Maharashtra, western India. At the time of writing there are 16 confirmed fatalities and 100 known survivors. The village is reported to have a population of 288 people; it is believed that 80 to 100 people may have been killed in the landslide, but this is very uncertain at this point. Initial estimates of the loss of life often prove to be pessimistic,
This is the largest event to date resulting from the savage rainfall that in some areas has accompanied the 2023 SW monsoon in India. News reports indicate that the area received 499 mm of rainfall over a three day period prior to the landslide. The rescue and recovery operations are being heavily impacted by continued heavy rainfall.
The location of Irshalwadi appears to be [18.9339, 73.2358]. The image below shows Google Earth imagery for the site, which is located in steep terrain:-
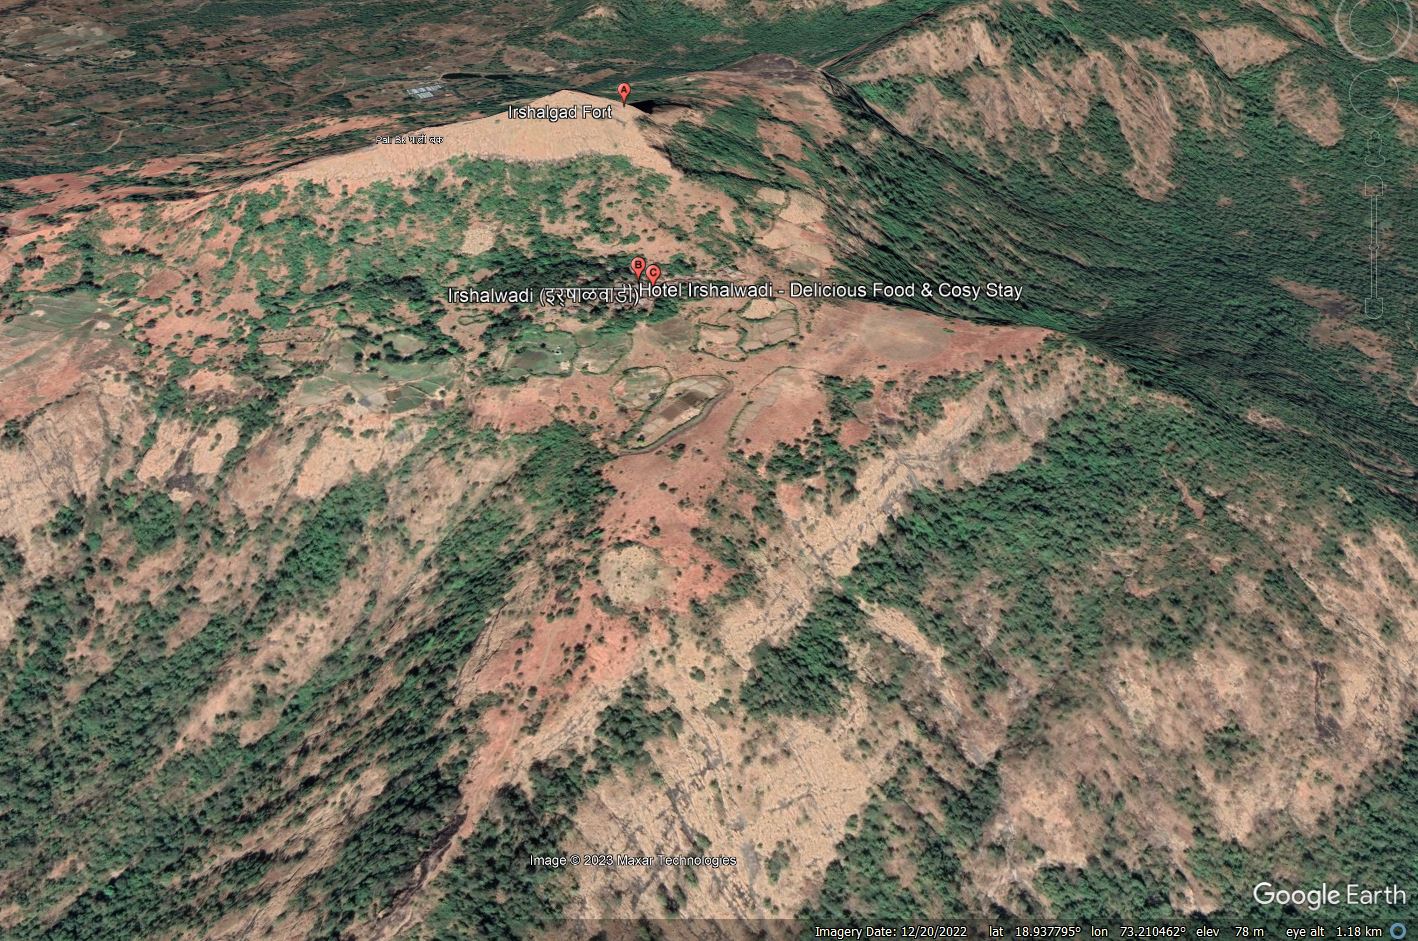
Google Earth image of Irshalwadi, the site of the 19 July 2023 landslide in India.
.
The village is not accessible by road, which is greatly hampering the rescue operations. The best image that I have found of the site is on the Pudhari news website. It shows the upper portions of the source area:-
The site of the 19 July 2023 landslide at Irshalwadi in India. Image from Pudhari News.
.
At this stage it is difficult to fully interpret the events at Irshalwadi, but on first inspection the landslide appears to have involved deeply weathered soil and regolith.
19 July 2023
The devastating 17 July 2023 debris flow at Quetame in Colombia
The devastating 17 July 2023 debris flow at Quetame in Colombia
Late in the evening of 17 July 2023 a devastating mudflow struck Quetame in Colombia. Initial reports are that 14 people have been killed and a further 20 remain missing.
There is a good thread on Twitter by the ever reliable Helbert García-Delgado that includes links to some news reports:-
Last night, seven people died and 20 more went missing after a mass flow struck the area of Quetame, close to the capital Bogotá. The road Bogotá – Villavicencio was partially affected by the flows as well. #Landslides #NaturalHazardshttps://t.co/054oe9V9kH
— Helbert García-Delgado (@HelbertSchneid1) July 18, 2023
.
Meanwhile, La FM has some security camera footage that captures the arrival of the landslide. The devastating impact is clear:-
Cámaras de seguridad capturaron el momento exacto de la avalancha que dejó varios muertos y desaparecidos en Quetame, Cundinamarca. pic.twitter.com/bC61jhqD2p
— La FM (@lafm) July 18, 2023
,
LLanomundo has an article in Spanish that includes this before and after image of a part of the path of debris flow:-
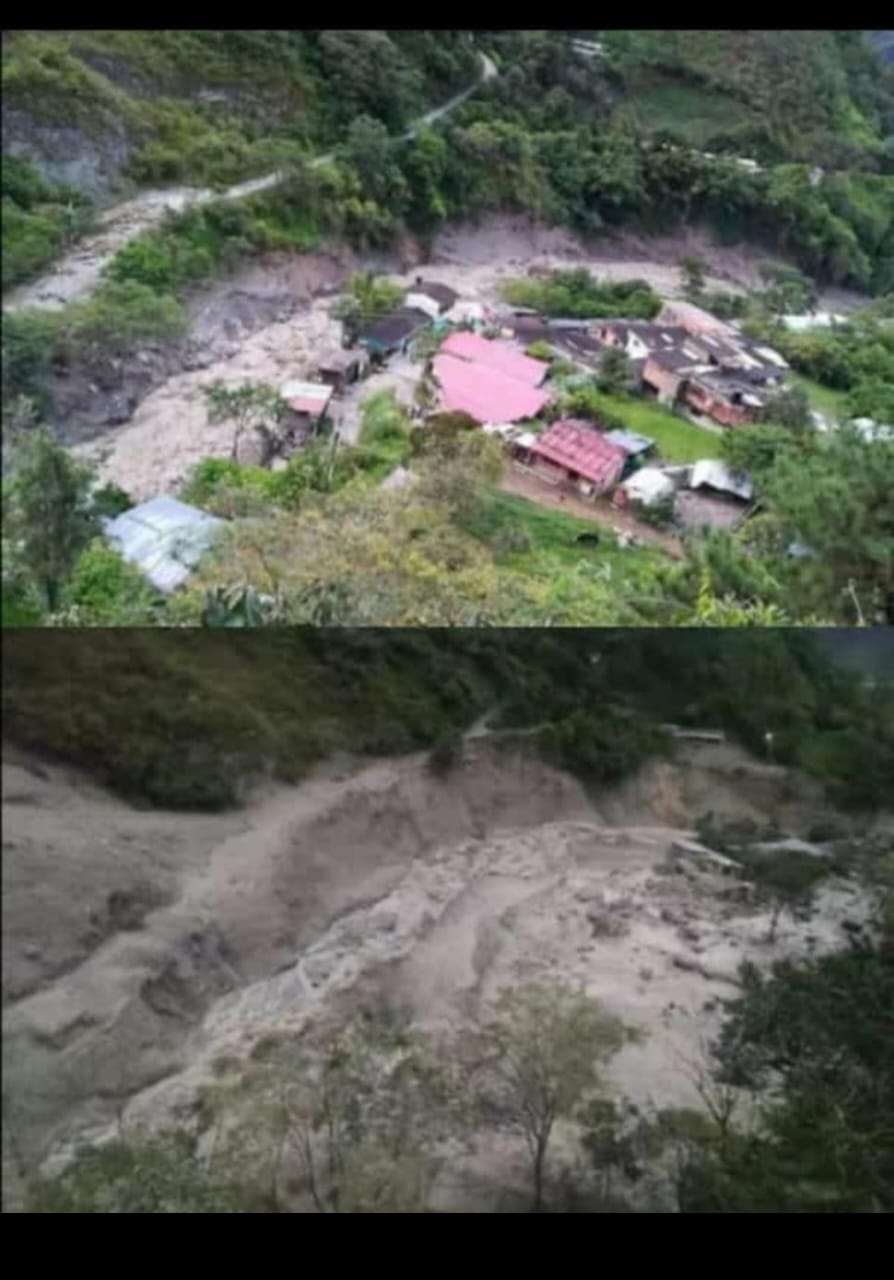
Before and after image of a part of the path of the 17 July 2023 debris flow at Quetame in Colombia. Image from Llanomundo.
.
The BBC has a news report about this event, which was triggered by heavy rainfall. Amongst those killed are at least three children. It also notes that severe damage was caused by flooding and other landslides in the area. We will need satellite imagery to understand the full extent of the damage.
News reports and images indicate extensive damage to the motorway toll station at Naranjal, which is located at [4.2797, -73.8347]. Google Earth indicates that a large gully enters the main channel at this point that has multiple landslides on its slopes. This seems potentially to be the source of the disaster, but this is speculation at this time.
18 July 2023
A mudflow on the banks of Loch Broom in northern Scotland
A mudflow on the banks of Loch Broom in northern Scotland
Heavy rainfall in northern Scotland has triggered an interesting mudflow on the banks of Loch Broom of Wester Ross in northern Scotland, near to Ullapool. The landslide was captured by a crew member from Shearwater Cruises , a local tourist boat operator. Two videos have been posted to Facebook. Unfortunately, WordPress won’t allow me to embed them, but the image below is a still from one of the clips:
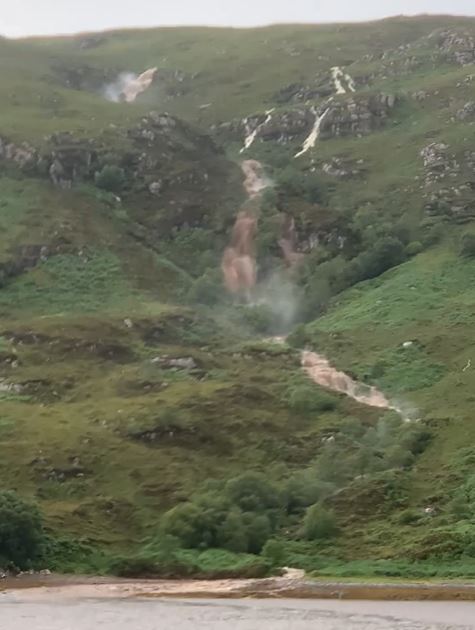
The mudflow at Loch Broom in northern Scotland. Still from a video posted to Facebook by Noel Hawkins.
.
The Ross-shire Journal has a brief article about the landslide, but it adds little. The landslide appears to be in the vicinity of [57.880, -5.166], near to Alltnaharrie.
Hopefully the British Geological Survey will seek to track this one down, so more information should be available in due course. This is a favourite area of Scotland, so I’ll need to find the time to make a trip up there.
17 July 2023
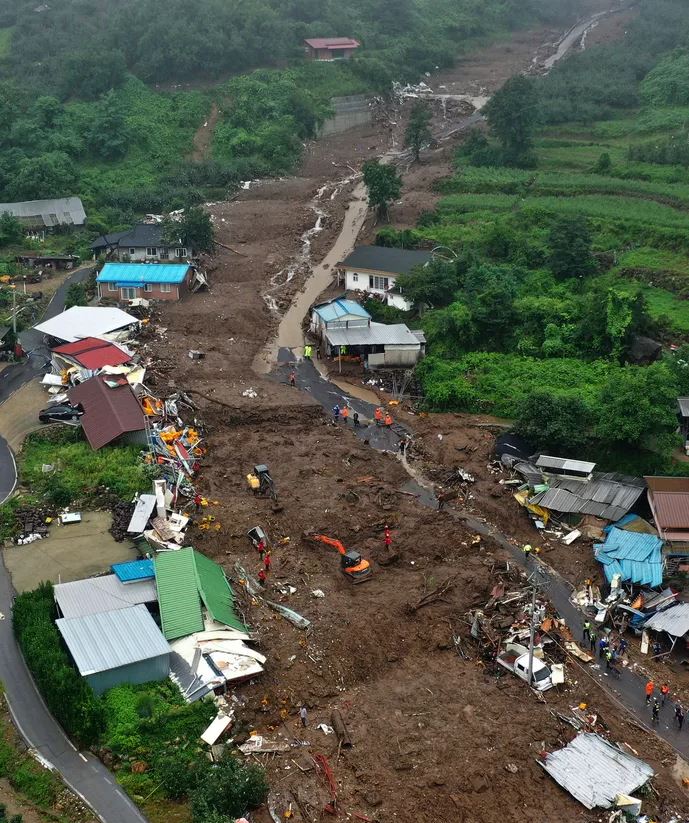
Multiple landslides triggered by intense rainfall in South Korea
Multiple landslides triggered by intense rainfall in South Korea
Across the Northern Hemisphere, intense rainfall is triggering devastating landslides and flooding. The latest area to be affected is South Korea, which has had several days of heavy rainfall, with more forecast for the early part of this week. At least 40 people have lost their lives. The most deadly single event has been the horrific flooding of a tunnel in Cheongju, North Chungcheong province, in which 13 people are known to have died, and one further person remains missing.
However, in North Gyeongsang at least 19 people have died, the majority of whom were killed by landslides. The highest profile landslide was captured on a video that has been widely circulated and is shown at the start of this clip on Youtube:-
.
A news report in Korean indicates that there was precursory activity at this site, including several smaller collapses, that meant that the road was closed. It is interesting that the site had a rockfall shelter in place, although it was probably not designed for an event on this scale. Remarkably, images since the landslide show the shelter still mostly intact:-
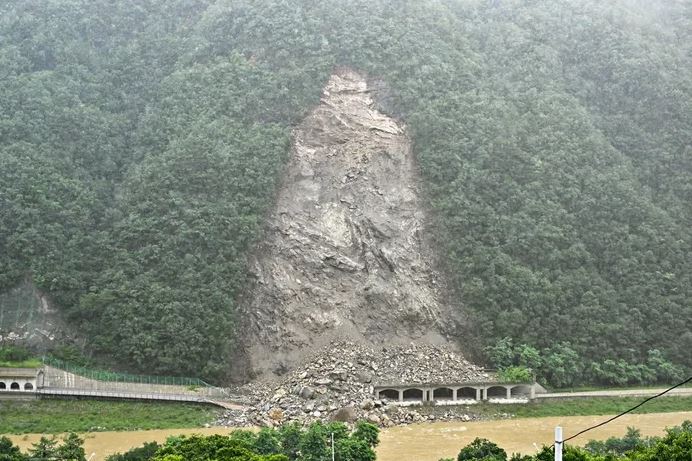
The aftermath of a large landslide in Jeongseon-gun, Gangwon-do, South Korea. Image from khan.co.kr.
.
JoongAng daily has an article, also in Korean, that describes landslides in North Gyeongsang. It includes accounts of the loss of:
- “a 67-year-old man who died trying to save his 25-year-old daughter from a landslide in Yeongju”
- a landslide that killed one person and left another injured in Gimcheon-myeon, Yecheon County
- a landslide in Yecheon County that killed a woman
- a landslide in Gimcheon-myeon that killed two people
The landslide below occurred in Yecheon County on 16 July 2-23. Reports indicate that one person was killed and two more are missing:-
A landslide in Yecheon County, North Gyeongsang, South Korea. Image from khan.co.kr.
.
More information will emerge in the coming days about these devastating landslides in South Korea.
 Dave Petley is the Vice-Chancellor of the University of Hull in the United Kingdom. His blog provides commentary and analysis of landslide events occurring worldwide, including the landslides themselves, latest research, and conferences and meetings.
Recent Comments