

11 May 2018
Mabian Yi: a massive landslide in China caught on video
Mabian Yi: a massive landslide in China caught on video
On Saturday 5th May a very large landslide occurred at Mabian Yi in Sichuan Province, China. The landslide, which appears to have been anticipated, was captured on a spectacular video that is now on Youtube. There are multiple versions of this video online, but the best I can find is this one, posted by New China TV:
.
There is a longer version of the video, slightly strangely edited, on Twitter as well. This version shows much more of the precursory rockfall activity that occurred ahead of the main failure event.
This image shows the slope just ahead of the main sliding event:-
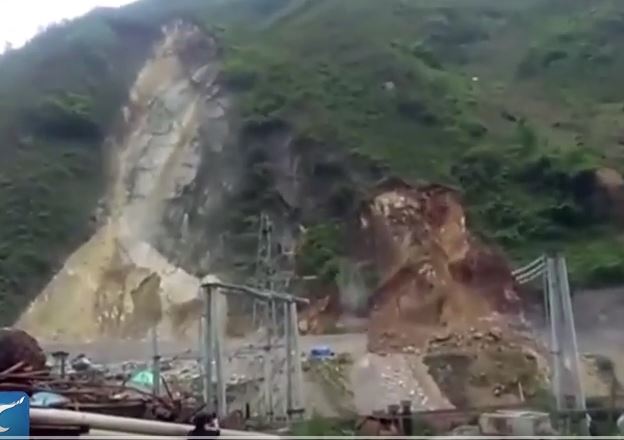
The slope at Mabian Yi just prior to the landslide on 5th May 2018. Still from a video posted to Youtube by New China TV.
.
Note the recent failure on the left of the image – this slide appears to define the lateral margin of the main failure. The 5th May landslide appears to have initiated on the right side though:
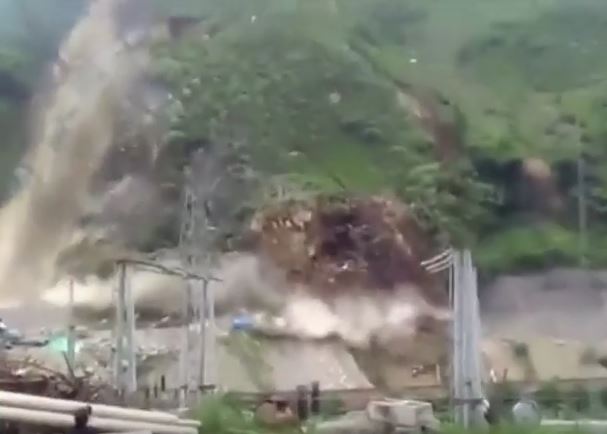
The initiation of failure at Mabian Yi on 5th May 2018. Still from a video posted to Youtube by New China TV.
.
CCTV have a little more detail about the landslide:
A massive landslide on Saturday buried a road section in Mabian Yi Autonomous County in southwest China’s Sichuan Province, terrifying the people who witnessed the disaster. Soil and boulders estimated over 50,000 cubic meters in volume cut off a nearby road and partially blocked a nearby river. Learning about the disaster, local government immediately deployed traffic police officers and road maintenance workers to handle the situation. The police now cordoned off the affected section and the workers are clearing the debris from the road. No casualties have so far been reported in the disaster.
Waonews report that the location was as follows:
At 12:30 on May 5th, a high slope collapsed (the mileage position of wave three road K6+240~320) at Po three road (pineapple bridge – Sanhekou township) Sanhekou Township, Leshan city of Mabian Yi Autonomous County (pineapple bridge – Sanhekou township).
From this I have been able to track the location down to 28.835, 103.361. This is an image of the site from Google Earth, captured in 2016:-
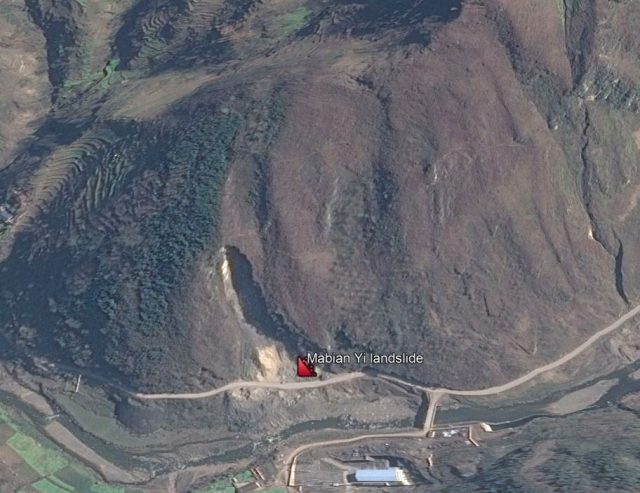
Google Earth imagery of the site of the Mabian Yi landslide in China.
.
Note the apparent tension cracks at the ridge crest. This was a landslide that has been developing for some time.
10 May 2018
Karongi: 18 people killed in a major landslide in Rwanda
Karongi: 18 people killed in a major landslide in Rwanda
On 6th May a major rainfall triggered landslide struck a village, Bucyurabuhoro, in the Rwankuba Sector of Karongi District in western Rwanda. The landslide occurred in the evening, killing 18 people and leaving at least 12 others injured. The Rwanda Red Cross tweeted this image of the landslide:-
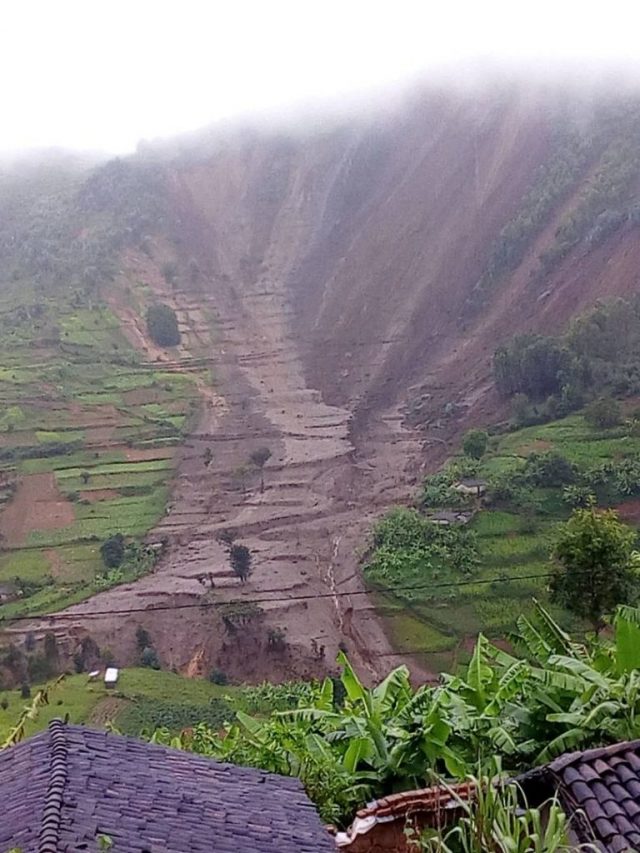
The major landslide at Rwankuba in western Rwanda on 6th May 2018. Image tweeted by the Rwanda Red Cross.
.
The online newspaper KT Press has a decent report about the landslide, which also notes that a further three people were killed by the failure of a retaining wall in Giticyinyoni in Nyarugenge district. The same newspaper also has an account of both the landslide itself and the aftermath, describing it as follows:
The evening of May 6 was normal and peaceful. Francois Nzabamwita, a resident of Bucyurabuhoro Village, Rwankuba Sector in Karongi District (Western Rwanda) left home to watch a football game at a bar in the neighbouring village. A heavy downpour followed till the end of the game. On realizing the rain wouldn’t stop, Nzabamwita decided to brave it. But a few meters to his home, a huge force swept him away – along with his house and everything in its path. A large section of the steep mountain had given way. Nzabamwita survived the ordeal but the horror is still fresh on his mind. “Fortunately, I managed to rescue a woman with a baby,” he said as hundreds of mourners gathered to bury the dead. For the entire night, locals struggled to find survivors. Nzabamwita says he witnessed an elderly man being pulled out of tons of mixture of mud, rocks and wood.
The landslide itself appear to have been caused by a series of shallow regolith failures on the steep back wall. This looks like a classic static liquefaction event in which the debris fluidises to form a highly mobile flow – in essence a much larger version of the events shown in the Papamoa landslide video from New Zealand.
4 May 2018
Chongqing: a dramatic rockfall video from China last month
Chongqing: a dramatic rockfall video from China last month
The Chinese news agency Xinhua has posted a dramatic video on Youtube showing dashcam footage of a large rockfall in SW China on 9th April 2018. According to the Weather Channel this occurred in Chongqing. I cannot find much more information about this event:-
.
The image below is not clear, but it shows the small pick-up truck that was on the road at the time of the rockfall. Large boulders, traveling at very high speed, narrowly missed making a direct impact on the vehicle:

The Choongqing rockfall on 9th April 2018. Still from a video from Xinhua via Youtube
.
The larger displaced mass of soil can also be seen on the left side of the image. The reports suggest that no-one was killed or injured in this event.
2 May 2018
The 3 km long Ultar Glacier rock and ice avalanche – first satellite images
The 3 km long Ultar Glacier rock and ice avalanche – first satellite images
Last month I highlighted the large Ultar Glacier rock and ice avalanche that struck a valley close to the town of Karimabad in northern Pakistan. This event, which was caught on video, sadly killed three people who were trekking in the valley at the time. Frustratingly, until now cloud has prevented capture of decent images, but yesterday my friend Mikhail Dokukin pointed out to me that imagery is now available. He very kindly put together this before and after GIF based upon Landsat and Sentinel data:
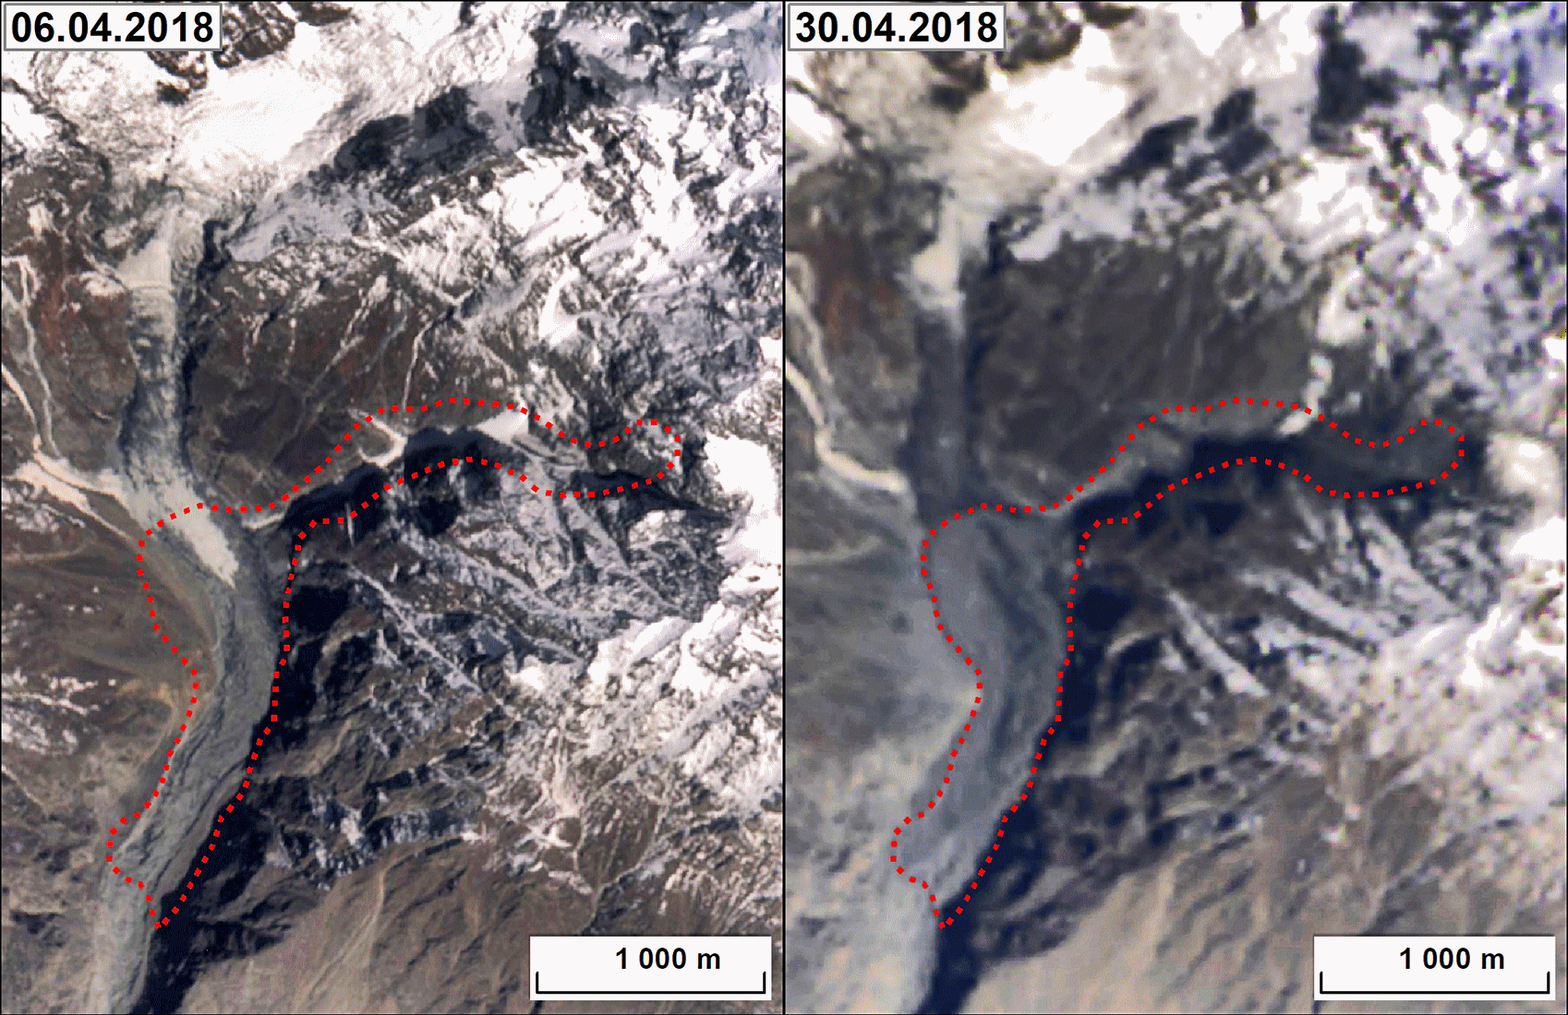
Before and after imagery of the Ultar Glacier rock and ice avalanche. Image from Landsat and sentinel data, compiled by Mikhail Dokukin.
.
That inspired me to take a look at the Planet Labs imagery for the area, and it turns out that there is a now a good before and after image pair available. This is an image taken on 5th April 2018:-
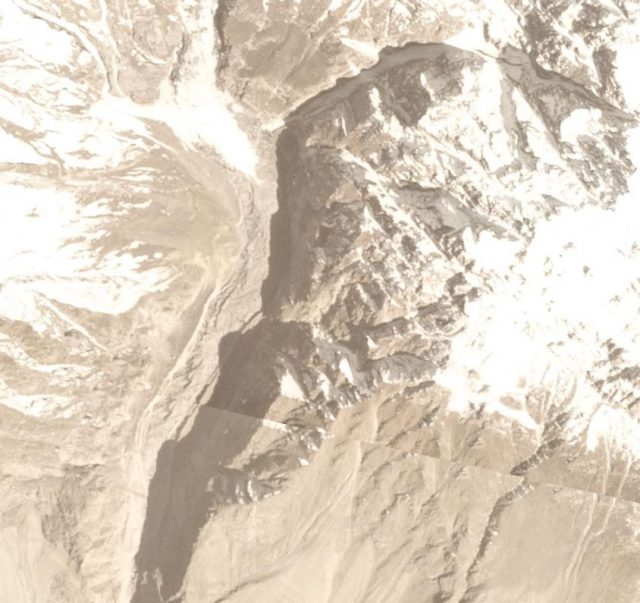
Planet Labs image of the site of the Ultar Glacier rock and ice avalanche. Images collected by Planet Labs on 1st April 2018, used with permission.
.
And this is the same site, also captured by Planet Labs on 30th April 2018, after the rock and ice avalanche:-
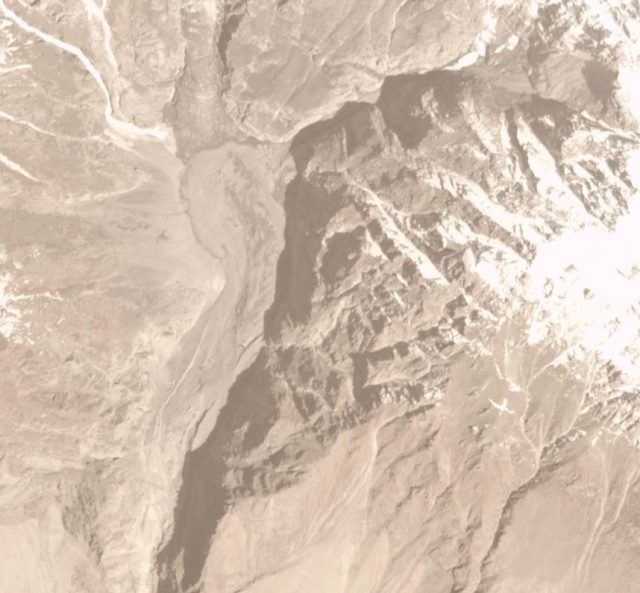
Planet Labs image of the site of the Ultar Glacier rock and ice avalanche. Images collected by Planet Labs on 30th April 2018, used with permission.
.
From this image it appears that the Ultar Glacier rock and ice avalanche started with a significant rockslope failure at the very top of the glacier, in the very northeast corner of the image. This appears to have entrained debris as it traveled towards the west across the surface of the glacier. After the slide turned to the south it started to deposit a very volume of material. Mikhail has estimated that the travel distance was about 3 km, making it the largest landslide of the year to date.
Reference
Planet Team (2017). Planet Application Program Interface: In Space for Life on Earth. San Francisco, CA. https://api.planet.com
1 May 2018
Caijiazhuang village: a cracking-sliding landslide that has killed nine people
Caijiazhuang village: a cracking-sliding landslide that has killed nine people
Yesterday I highlighted recently published research into the diurnal cycle and its impacts on cracking-sliding landslides on the Loess Plateau in China. Ironically, the same day an example of such a landslide occurred, on this occasion at Caijiazhuang village in Lishi District of Lyuliang City, in Shanxi Province. Xinhua has an unusually brief report on the landslide, which notes that:
“Nine people have died in a landslide in north China’s Shanxi Province, local authorities said Monday. The landslide happened at around 4:57 a.m. Monday in Caijiazhuang village in Lishi District of Lyuliang City, the local publicity department said.”
The Li et al. (2018) research that I featured yesterday noted that these landslides occur preferentially between 10 pm and 5 am, so this landslide fits the pattern.
The Straits Times has a couple of images of the landslide:-
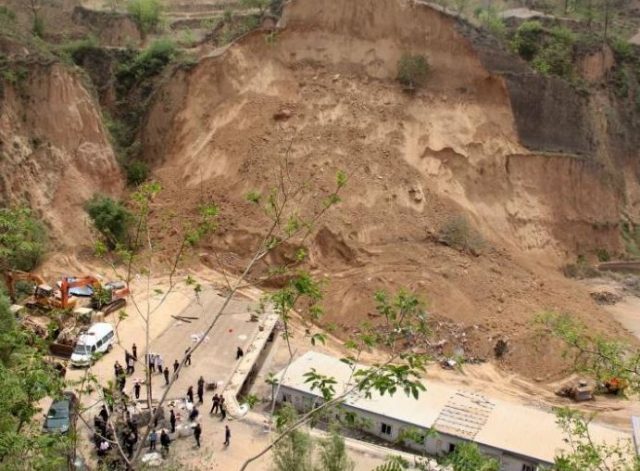
The cracking-sliding landslide at Caijiazhuang in China on 30th April, which killed nine people. Image via The Straits Times.
.
On the face of it this appears to meet the description of a cracking-sliding landslide, and the material appears to be loess or something similar. This image shows the landslide from a different perspective:-
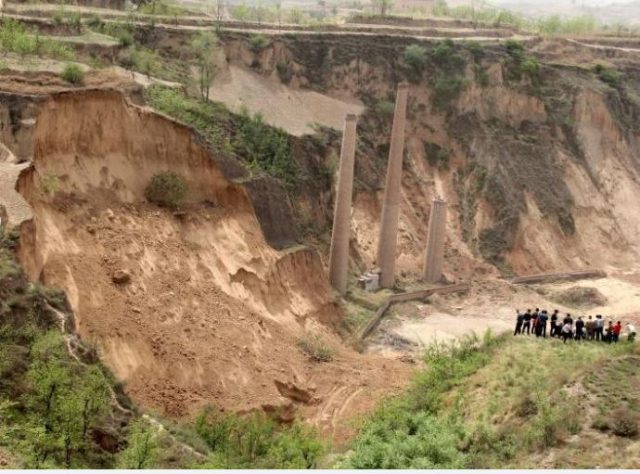
The cracking-sliding landslide at Caijiazhuang in China on 30th April, which killed nine people. Image via The Straits Times.
.
The presence of the chimneys suggests that this might have been a brick pit, which in turn might imply that undercutting of the slope might have been a factor in this instability, perhaps. There are certainly signs of instability in the adjacent slopes, though perhaps not on the scale of this landslide. Li et al. (2018) found that a very high proportion of these landslides were associated with slope disturbance of some type.
Reference
Li, Y., Mao, J., Xiang, X., and Mo, P. 2018 Factors influencing development of cracking–sliding failures of loess across the eastern Huangtu Plateau of China, Natural Hazards and Earth System Sciences, 18, 1223-1231, https://doi.org/10.5194/nhess-18-1223-2018.
30 April 2018
A surprising but important discovery on the timing of cracking-sliding failures landslides in China
A surprising but important discovery on the timing of “cracking-sliding failures” loess landslides in China
An interesting study has recently been published in the journal Natural Hazards and Earth System Science (Li et al. 2018 – available open access) that looks at, amongst other things, the timing of loess landslides in China. The paper presents an analysis of a dataset of what are termed as “cracking-sliding failures of loess” on the eastern Huangtu Plateau – often known as the Loess Plateau – in China. I haven’t heard of the term “cracking-sliding failure” previously, but in essence these are loess landslides that develop as a result of initial tensile failure, allowing sliding to develop. Li et al. (2018) point out that these landslides cause high levels of loss, noting that there have been over 1000 landslides of this type on China in the last two decades, causing an average of over 100 fatalities per annum.
The authors have compiled a database of 1176 cracking-sliding failures in a part of the Loess Plateau, all of which have occurred in the last 20 years. They have then looked in detail at the timing of failure – one part of the analysis examines the annual cycle of landslides. This diagram, from the paper, presents the annual cycle of cracking-sliding failures:
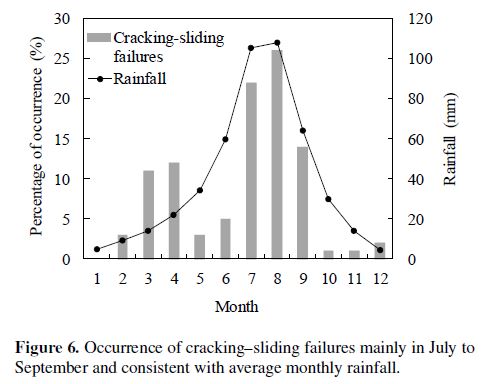
The annual cycle of cracking-sliding failures on the Loess Plateau in China. Figure from Li et al. (2018)
.
In general, the annual cycle closing matches the seasonality of rainfall, as expected. But note the secondary peak in March and April – this is interpreted as being the result of the rise in temperatures in the spring, when the upper portion of the frozen layer starts to thaw. They hypothesise that this thawing process drives both frost heave and weakening of the soil through a collapse of the pore structure.
Even more interesting is the time of day in which the landslides occurred:-
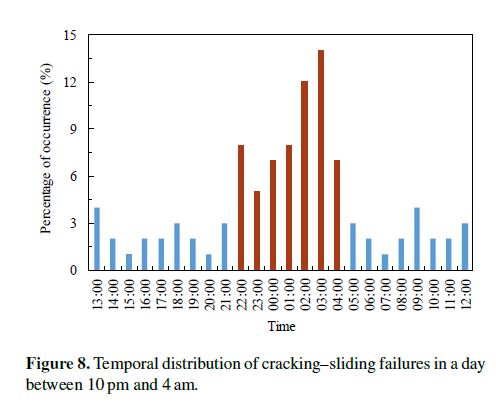
The time of day in which cracking-sliding failures occurred on the Loess Plateau. Figure from Li et al. (2018)
.
The data suggest that the failures occur preferentially in period between 10 pm and 5 am. The authors do not really explain why this should be the case, other than noting that there is a huge temperature change through the daily cycle, which drives thermal expansion and contraction, which might in turn drive weakening. I am not convinced by this explanation, given that most of the failures are driven by rainfall. Does the heaviest rainfall happen at night? But I think this daily cycle is a fascinating finding, which needs further research.
Of course 10 pm to 5 am is the very worst time for landslides to occur from a human perspective. The combination of darkness and the likelihood of people being asleep inevitably drives high levels of loss.
Reference
Li, Y., Mao, J., Xiang, X., and Mo, P. 2018 Factors influencing development of cracking–sliding failures of loess across the eastern Huangtu Plateau of China, Natural Hazards and Earth System Sciences, 18, 1223-1231, https://doi.org/10.5194/nhess-18-1223-2018.
27 April 2018
Shaking table tests of the Newmark displacement method for earthquake induced landslides
Shaking table tests of the Newmark displacement method for earthquake induced landslides
Earthquake induced landslides are probably the most difficult mass movement phenomena to anticipate, and thus management of these hazards is proving to be very challenging. The issue is urgent – landslides triggered by the large earthquakes in Pakistan in 2005 and China in 2008 killed over 20,000 people in each case, and many more people live in earthquake-prone high mountain areas. The next tragedy could come at any time.
Assessment of the potential for earthquake induced landslides is often based upon the Newmark displacement method, often known as the Newmark sliding block model. In this conceptual model, the landslide is considered to be a rigid block on an inclined slope:-

Conceptual model of the Newmark displacement method, via the USGS
.
This set up allows the stresses operating on the system to be calculated in both a static (i.e. non-earthquake) and dynamic (i.e. during an earthquake) state. The fundamental idea is that there is a critical acceleration at which siding will initiate, so an analysis is run to determine this value. The model allows the displacement to be calculated for the parts of the earthquake for which this acceleration is exceeded. An assumption is made that when the total displacement exceeds a critical value the slope will fail. There are some problems with this – it is very hard to know what this critical displacement might be – but that is a separate issue.
The Newmark displacement method can be applied to any slope. In recent years digital datasets have allowed it to be applied across an entire landscape, which creates the opportunities for a spatial hazard analysis. This approach has been developed by the USGS, and others, and has been taken up quite widely. But the question has always remained as to how good the Newmark Displacement method might actually be.
Recently, I was a part of a team that examined one aspect of this – wave phasing. We hypothesised that the phasing of horizontal and vertical accelerations might critically change the displacements. We ran a series of experiments using a highly specialised piece of lab equipment that was developed for us by GDS Instruments – the Dynamic Back Pressured Shear Box (DBPSB). These results were published a while ago (Brain et al. 2015) – they ask some quite key questions about the Newmark displacement method.
In a paper just published in the journal Landslides, Li et al. (2018) have looked at a different aspect of the Newmark approach. In their work, they have examined the behaviour of a simple physical slope model when exposed to earthquake accelerations delivered by a shaking table. This is their model set up:

The physical model of the Newmark displacement method used by Li et al. (2018).
.
They undertook several analyses of the behaviour of the model, and in some cases they compared the response to shaking with that predicted by the Newmark displacement method. They conclude the following:-
By comparing critical acceleration between the experimental and theoretical results, the results indicated that Newmark’s method overestimates critical acceleration during seismic-induced dip slope failure. In reality, slip planes along existing discontinuities develop much more easily and can lead to even greater disasters.
In other words, for reasons that are not clear the Newmark displacement method suggests that the critical acceleration value is too high. This means that the analysis will indicate that, in some cases, slopes are stable when in reality they may be unstable during a modeled earthquake. This does not mean that the approach should not be used, and indeed it remains a key tool, but it does indicate that great care is needed. And of course it suggests that further research is required to improve the technique, or to develop alternatives.
References
Brain, M.J., Rosser, N.J., Sutton, J., Snelling, K., Tunstall, N. & Petley, D.N. 2015. The effects of normal and shear stress wave phasing on coseismic landslide displacement. Journal of Geophysical Research: Earth Surface. 120, 1009–1022
Li, HH., Lin, CH., Zu, W. et al. 2018. Dynamic response of a dip slope with multi-slip planes revealed by shaking table tests. Landslides . https://doi.org/10.1007/s10346-018-0992-2
26 April 2018
Landslides and monsoon variation in India
Landslides and monsoon variation in India
As I have noted previously, the global landslide hotspot lies in South Asia, driven by rainfall associated with the annual summer monsoon. The patterns of the monsoon are complex, driven by the very dynamic climate system combined with the extreme topography and its resultant orographic effects. In a paper just published in Atmospheric Science Letters, and available Open Access, Mahmood et al. (2018) present a new long-term regional reanalysis of the Indian monsoon, covering the period from 1979 to 2016. The aims of the project are described as follows:
The prediction of the monsoon is notoriously difficult and there are many aspects of monsoon processes from the onset through the development and decay that are relatively poorly understood and represented in model simulations…The IMDAA reanalysis will produce a long‐term historical record of climate and extreme weather events over a region spanning the Indian peninsula and surrounding areas in the form of a high‐resolution data set, which can be exploited to better understand the characteristics of the monsoon.
At the time of writing of the paper, the reanalysis of monsoon variation was still underway, but it contains the data for 2008 and 2009. The graphs below show the average daily rainfall for India for the summer monsoon months (June, July, August, September; abbrieviated as JJAS) for four different datasets. The one generated by Mahmood et al. (2018) is labelled IMDAA:-
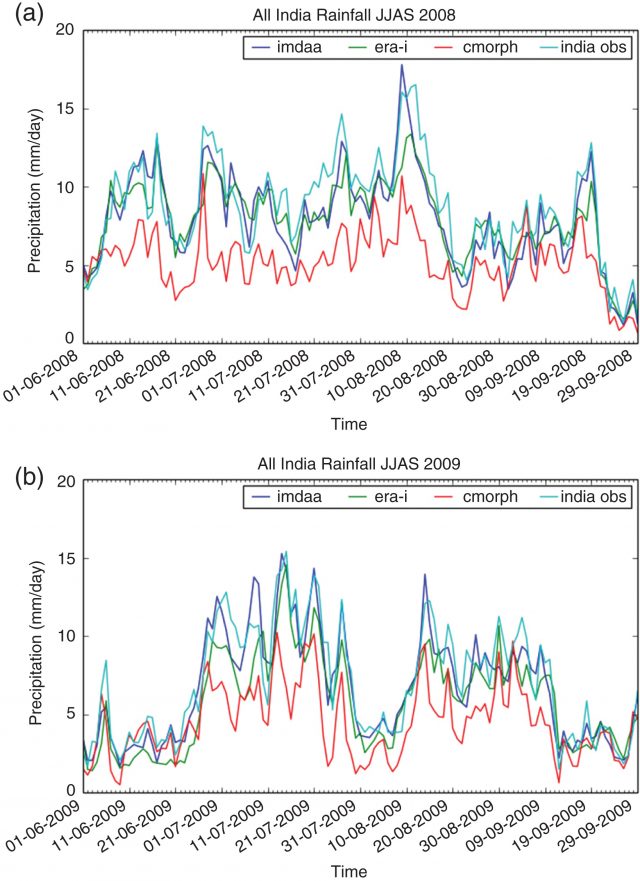
Daily monsoon variation in terms of precipitation for JJAS for 2008 and 2009, from Mahmood et al. 2018.
.
What is noticeable here is the quite different patterns of monsoon variation across the two years. In 2008 the monsoon starts quite early and peaks in mid-August. There is a second peak right at the end of the monsoon period. In comparison 2009 starts much more slowly, and there is a comparatively dry period in the first half of August, followed by a distinct wet phase. The main monsoon period ends in mid-September.
I have compared with this with the record of fatal landslides from my database for these two years. For this analysis I have used India and Nepal as in terrain terms they are effectively in the same domain. The graph below shows the cumulative number of fatal landslides for Nepal and India combined for 2008 and 2009:
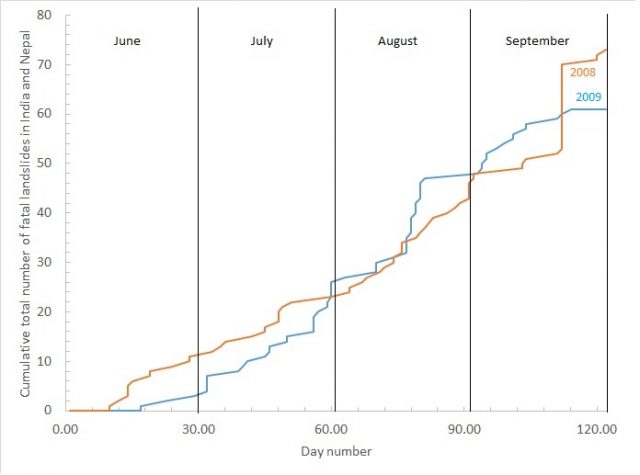
The cumulative number of landslides in India and Nepal in 2008 and 2009.
.
Interestingly, the slow start to the monsoon in 2009 is clearly evident in the landslide data, as is the wet phase in the middle of August. The much more consistent rainfall through the first half of the monsoon in 2008 is also clear in the landslide data, as is the late season rainfall pulse.
Whilst this is no more than a superficial analysis, I think that it does demonstrate the fascinating potential provided by this new reanalysis of the summer monsoon, and the potential to link it landslide patterns.
Reference
Mahmood S, Davie J, Jermey P, et al. 2018 Indian monsoon data assimilation and analysis regional reanalysis: Configuration and performance. Atmospheric Science Letters 19:e808. https://doi.org/10.1002/asl.808
24 April 2018
Boulder meets house: the power of landslides
Boulder meets house: the power of landslides
Boulder meets house: a video was posted on Youtube last week that dramatically illustrates the power of landslides. The limited accompanying text indicates that it was shot on the NH1A road between Udhampur and Srinigar in northern India, at Peerah. This location is easily identified on Google Earth – it appears to be hilly terrain with plenty of evidence of landslides:-
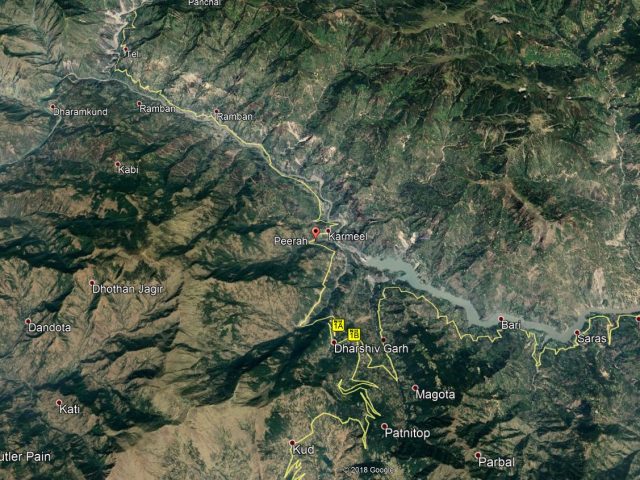
Boulder meets house: Google Earth image showing the location of Peerah in northern India.
.
The video shows a large boulder detaching from the slope and rolling down, striking and completely demolishing two small houses:-
.
The boulder does not move far, but it picks up speed very dramatically:-
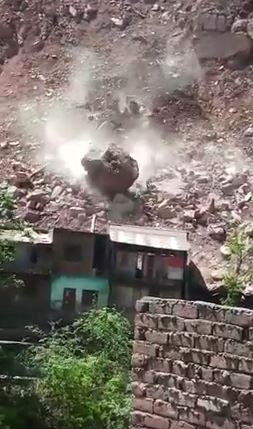
Boulder meets house: a still from a new Youtube video.
.
Unsurprisingly, the effect on the properties is catastrophic – in all probability an utter disaster for the owners of the buildings:-
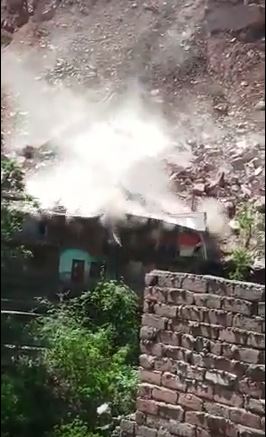
Boulder meets house: a still from a new Youtube video.
.
The text accompanying the video suggests that this landslide was caused by humans. I suspect that this is the location – the topography seems to fit and the powerlines can be seen in the video:-
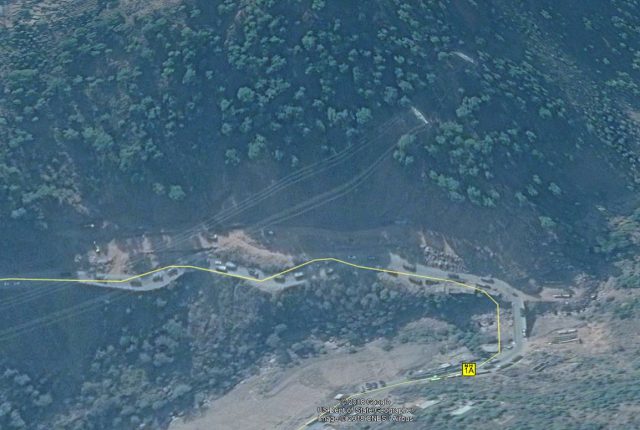
Boulder meets house – the location of the landslide at Peerah in northern India.
.
If so then it does appear that this has been the location of slope cutting, reportedly for road widening but in reality I suspect it has been excavation for construction materials. I think that the houses destroyed by the landslide are located in the bottom right of the image, close to the bridge. The Daily Excelsior has a news report of the event, which blocked the road for five hours:-
Official sources told the Excelsior that Jammu-Srinagar National Highway, the only all-weather road linking Kashmir with the rest of the country, was blocked by heavy boulders near Peera bridge in Nashri area of Ramban district at around 11.45 am today. He said road widening work is going on at this point and few weeks earlier also, there was heavy landslides in the same area. The highway suffered massive damage and it took long time to the National Highway authorities to partially restore highway and open it for one way traffic.
23 April 2018
The Sucun rockslide in Lishui, China in 2016
The Sucun rockslide in Lishui, China in 2016
The Sucun rockslide (also known as the Su Village rockslide) killed 27 people in Lishui, Zhejiang in China on 28th September 2016. Apart from the significant losses, this was a notable landslide for the fact that it was caught on video from two different perspectives:
.
I reported on the landslide at the time, and indicated that this was a site with substantial signs of instability well before the final failure event. This landslide has now been analysed and written up in the journal Landslides (Ouyang et al. 2018). The paper includes a detailed analysis of the rockslide, including this before and after image of the site, and analysis of the pattern of movement:-
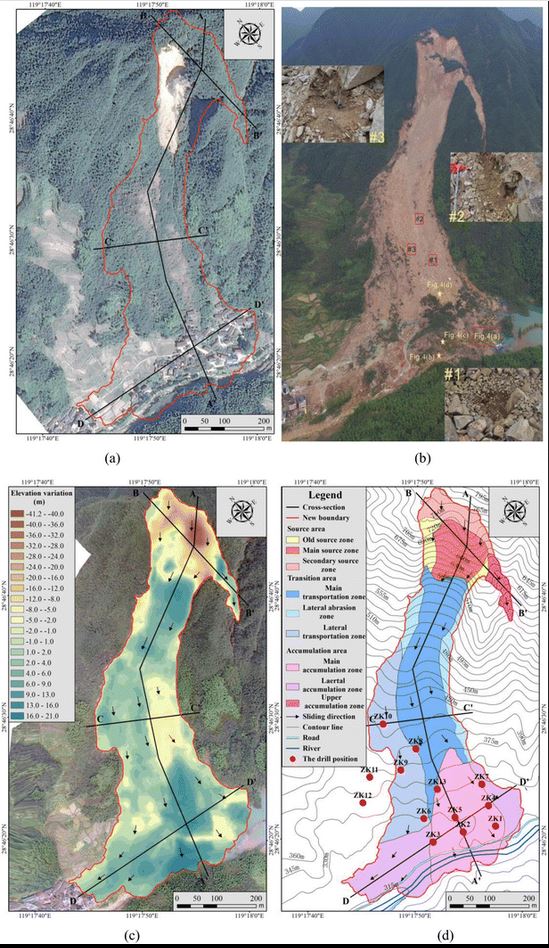
The Sucun rockslide in Chine in September 2016. Illustration from Ouyang et al. 2018 showing before and after imagery of the landslide, and detail on its pattern of movement.
.
The authors conclude that the rockslide occurred during a period of heavy rainfall – a nearby weather station recorded 114.6 mm of rainfall in the 24 hours leading up to the landslide, close to the average monthly total for September, brought by the remains of Typhoon Megi. They demonstrate using successive satellite images that the slope showed clear signs of deformation in the years leading up to the collapse, and that there were local reports of rockfalls. The day before the landslide a rockfall led to the evacuation of the village; sadly some of the residents returned to their homes prior to the rockslide.
The Sucun rockslide had a volume of about 400,000 m³. It is interesting to note that figure (c) in the image above indicates that the landslide deposited sediment along much of its track, which seems quite unusual. I am not quite sure how this squares with the description in the paper, which describes entrainment along the track.
Its good to see a detailed analysis of this important rockslide – there are many lessons to learn about the recognition of pre-failure evolution of a rockslope.
Reference
Ouyang, C., Zhao, W., Xu, Q. et al. 2018. Failure mechanisms and characteristics of the 2016 catastrophic rockslide at Su village, Lishui, China. Landslides. https://doi.org/10.1007/s10346-018-0985-1
 Dave Petley is the Vice-Chancellor of the University of Hull in the United Kingdom. His blog provides commentary and analysis of landslide events occurring worldwide, including the landslides themselves, latest research, and conferences and meetings.
Recent Comments