21 June 2011
Fatality-inducing landslides in 2011 – the scorecard at the summer solstice
Posted by Dave Petley
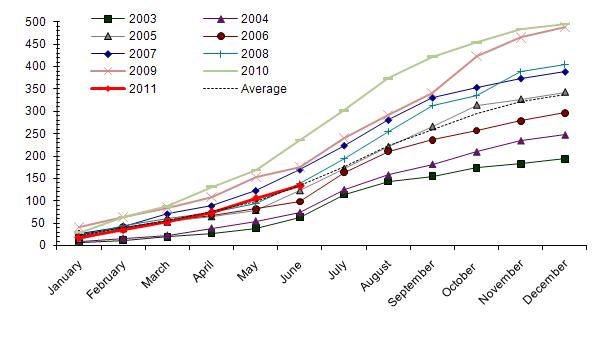
The summer solstice seems to be a good point to reflect upon landslides in 2011 to date. As of yesterday I had recorded 135 landslides worldwide that have caused loss of life, with 1867 victims. The graph below shows the cumulative total number of fatalities by month for the period 2003 to 2011. The average cumulative number is also shown:
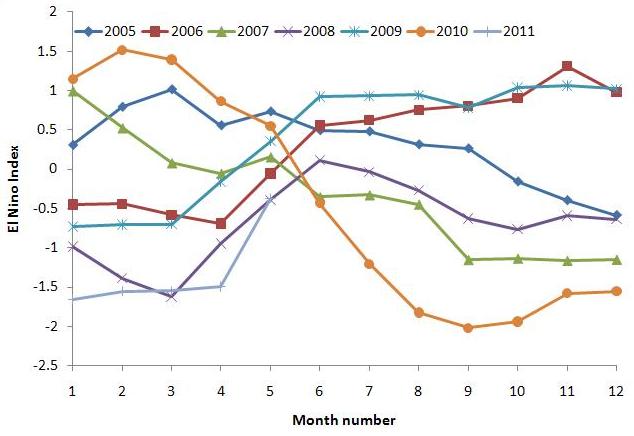
 Interestingly, and perhaps surprisingly, to date 2011 is a very average year in terms of fatality-inducing landslide occurrence worldwide, although the number of victims is higher than usual. In terms of overall trend it resembles very closely 2008. It is then interesting to look at a graph of the monthly NOAA El Nino index for all of the years shown above:

A quick note about this data – each month number represents two months – i.e. 1 = Dec-Jan; 2 = Jan-Feb, etc. Negative numbers represent La Nina conditions, positive El Nino. What is clear here is that 2008 and 2011 both had strong La Nina conditions at the start of the year, in stark contrast to, for example, 2010, which had strong El Nino conditions. It is not reasonable to argue that the landslide pattern in the early part of the year is controlled solely by the El Nino – La Nina cycle of course, but a good working hypothesis for further investigation would be that it does play a role.


 Dave Petley is the Vice-Chancellor of the University of Hull in the United Kingdom. His blog provides commentary and analysis of landslide events occurring worldwide, including the landslides themselves, latest research, and conferences and meetings.
On Father’s Day my daughters took me to a fancy beach hotel near Tofino. The extensive sand beach, called Crescent Beach is fairly homogeneous fine white sand. A small creek feeds onto the beach. At low tide the creek cuts a curved track through the sand which is reset to blank sand by rising tides and wave action.
I took a video with an iPod but I don’t know how to upload it.
The outer arc of the curve is constantly slumping and being washed down stream.
I had read about ” A Toppling Failure” here and thought you might be interested.
Great place for an international conference by the way
Dear Dave,
Thank you for two very interesting graphs! I take it that 2006 and 2009 were the years with the highest El Nino effect, however, overall only 2009 had very high numbers of landslides..interesting.
As I wrap up my thesis, I would love to know if you have posted recent stats on landslides in Nepal. Thank you, Karen
When was the second graph made?