23 January 2013
An analysis, based on Images and video, of the Mount Cook National Park landslide on Monday
Posted by Dave Petley
The large landslide on Mount Dixon in the Mount Cook National Park in New Zealand on Monday has now been photographed and videoed in some detail, providing a clearer picture of what happened. This is a very impressive landslide with a large fall height and long runout distance, although as far as I can see there is nothing surprising about its behaviour. A good starting reference point is the following Youtube video:
http://www.youtube.com/watch?v=s9G6aI49Le0
.
Landslide source
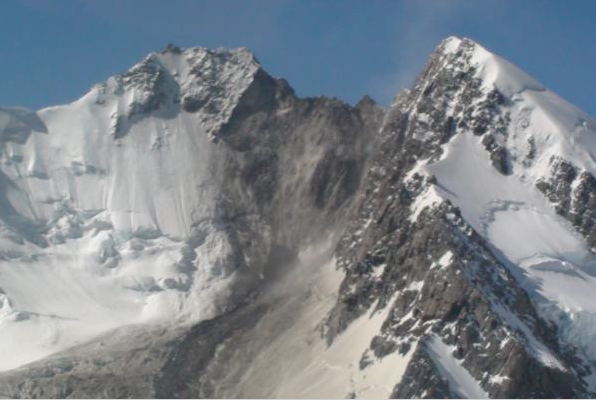
The mass appears to have fallen from a near vertical cliff on the west face of the southern flank of Mount Dixon, removing a section of the ridge-top in the process. The scar left by this section can be seen in the image below (from here):
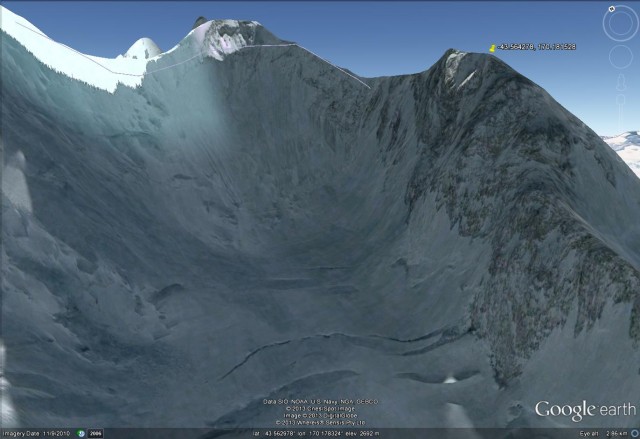
The area of detachment can be seen in the Google Earth perspective view based on imagery from 2007:
Fall height
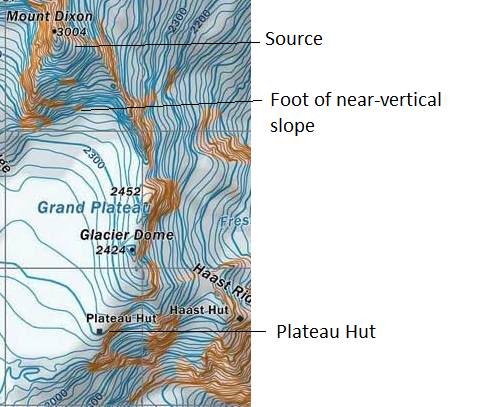
The map below (from here) shows the area affected by the landslide. This suggests a maximum fall height of about 450-500 metres from the ridge to the foot of the steep slope:
.
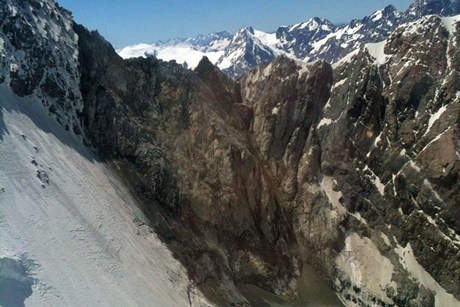
The photo above suggests that the topography of the slope may have concentrated the debris into a comparatively small initial impact zone. 3News has a better image of the source zone – it is not difficult to understand why this mass was unstable:
The landslide track
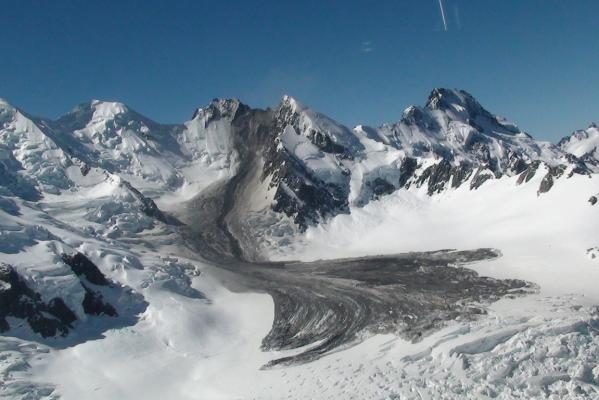
The landslide track is shown well in this image (from here):
The track appears to have two components – a concentrated main zone from the focused impact area at the slope toe, in which the landslide appears to have removed all of the surface layers of snow and ice, and a more dispersed zone on each side in which the landslide appears to have run across the snow without eroding it away. The landslide has clearly followed the topography. There is an interesting transition at the foot of the concentrated zone (just below and to the left of the centre of the image above) at which the landslide appears to have stopped eroding the snow and ice and to have started to deposit, but this is not clearly resolved on the photos. The landslide track is about 3 km with a total vertical change (from crown to toe) of about 800 metres.
The runout zone
The termination of the landslide has a quite beautiful structure, with a series of lobes containing flowlines. It is clear that the landslide ran out of energy when the slope gradient reduced. On the left of the image above the flow has started to travel downslope in two or so lobes as the glacier steeoened, but these appear to have been too small to maintain the flow. The deposit, shown in the image below (from here), is clearly a mixture of ice, rock and snow. Notice how the dust deposit (which provides a fuzzy edge to the landslide further upslope, appears to disappear in the lower reaches. In all cases at the toe of the landslide the edge of the lobes of the deposit seems to consist of bulldozed snow There seems to be more rock below the main track area (on the right of the image) below than in the other sections (especially to the left of the image below). The Plateau Hut, also shown on the map above, is circled. If nothing else it provides a good scale for the landslide.
A post on this link suggests that some of the climbers may have caught the video in action, but that they are still climbing at the moment. I am hoping that this might become available in due course.
Comments or thoughts welcome, and thanks to the many people who have provided links to this event.



 Dave Petley is the Vice-Chancellor of the University of Hull in the United Kingdom. His blog provides commentary and analysis of landslide events occurring worldwide, including the landslides themselves, latest research, and conferences and meetings.
Amazing photos in such perfect weather!
Looking at the topo map, it seems to me that the landslide originated from the west side of the arete between Mt. Haast and Mt. Dixon .
The NZ topo map overlay for Google Earth shows it much better.