
30 July 2019
The Mount Zandila (Valpola) rock avalanche
The Mount Zandila (Valpola) rock avalanche
This post was kindly provided by Fabio Luino of the Consiglio Nazionale delle Ricerche, Istituto di Ricerca per la Protezione Idrogeologica, Turin, Italy
Email: [email protected].
Introduction
The Mount Zandila landslide (also known as the Valpola rock avalanche) is possibly the most important landslide in Europe in the last 40 years. It occurred on 28th July 1987 in the valley of the Adda River (Valtellina) in the Central Alps, 130 km NE of Milan. The landslide, which involved about 34 million cubic metres of rock, killed 29 people in the valley below. This post is intended to provide a brief overview of this important event.
Geology and geomorphology
The slope of Mount Zandila affected by the rock avalanche is mainly composed of igneous and metamorphic rocks with limited superficial deposits. The outcropping rocks were predominantly diorite, gabbro and orthoquartzite, with lesser amounts of gneiss and amphibolite; moraine, debris and alluvial deposits are generally situated in the less steep areas. The rocks were heavily fractured and deeply etched by erosion and rockfall processes.
Like most Alpine valleys, Valtellina shows the typical features of a glacial valley with a superimposed fluvial morphology. In this zone, the average ridge elevation reaches 2500 to 3000 m, while the valley bottom lies roughly at 1000 to 1100 m.
Pre-existing instability
A prehistoric landslide, identified from archive aerial photographs dating from 1954 to 1981, had previously affected the upper part of the slope between 2100 and 2360 m elevation. This feeature, consisting of a steep unvegetated slope about 100 m long is easily recognisable on the imagery below. This appears to represent the sliding surface of a previous landslide on this slope:-
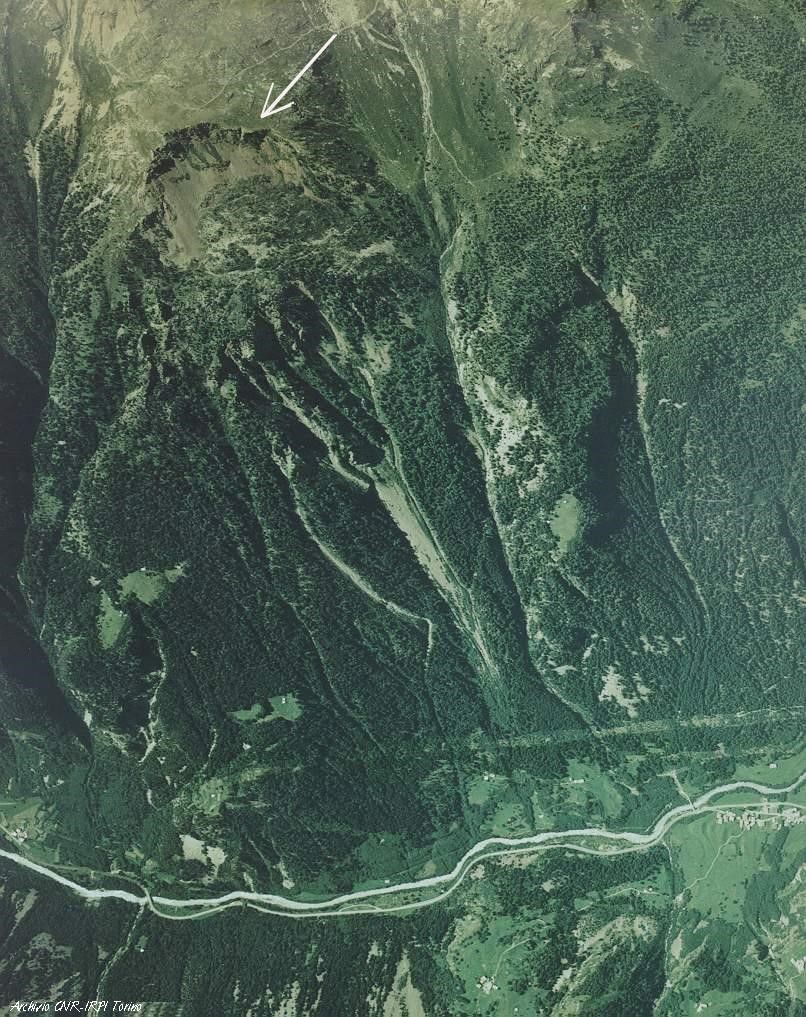
Archive image of the site of the Mount Zandila landslide. An unvegetated area (marked by arrow) was clearly present prior to the 1987 failure event. This is interpreted as being the scar from an earlier landslide event.
.
The period prior to the failure
Between 15th and 19th July 1987, rainfall in the Valtellina totaled 229 mm, of which 124 mm occurred on 18th July (Govi & Turitto, 1992). Several landslides, mostly soil slips, were triggered on the slopes in the tributary valleys. During the rainstorm of 18th July, the streams on the flanks of the landslide were affected by numerous debris flows, which continued to occur through to midday the following day. The displaced masses dammed the Adda River, creating a lake of almost 100,000 m² about 100 m upstream from the northern border of the incipient landslide.
Three days before the collapse, a discontinuous tension crack was sighted by a guide. The crack ran for about 600 m along the scarp at an altitude of 2200 m, coinciding with the slide surface of the old landslide on the eastern slope of Mount Zandila.
Between 25th and 27th July, several rockfalls on the eastern slope occurred, including 98 falls in only 24 hours the day before the collapse (Govi & Turitto, 1992). Inhabitants from the villages of Morignone, San Antonio, Poz and Tirindrè were evacuated in response.
The collapse event
At 7:23 a.m. on 28th July 1987, a large mass of rock, with a volume of about 34 million m³, detached from the eastern slope of Mount Zandila (Figure 2). The image below shows the source zone of the landslide:
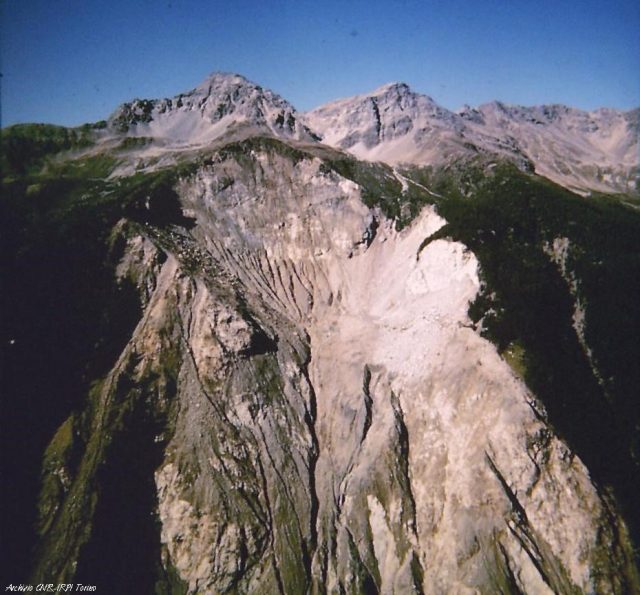
The source area of the 28th July 1987 Mount Zandila landslide.
.
The displaced mass, including the prehistorical slide and the bedrock, moved in two short phases: the first came down as a northward slide of the upper part of the slope (marked 6 in the diagram below), whilst the second occurred in a single rapid displacement towards the east into the Adda valley floor (marked 7 below). This failure inundated the village of Morignone:-
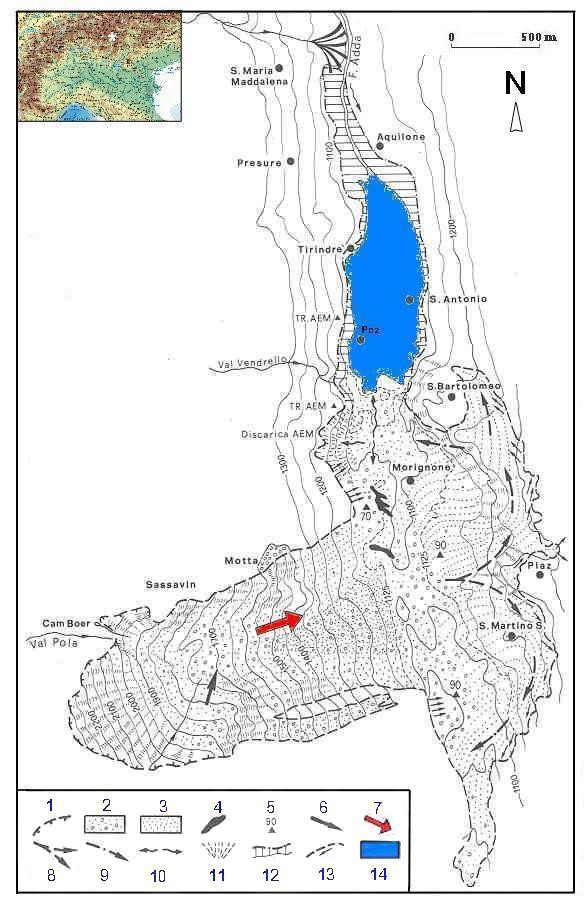
Figure 3 – Interpretative maps of the Mount Zandila rock avalanche. 1) Main scarp; 2) debris mostly coarse blocks; 3) debris mostly fine material; 4) strips of old clayey lacustrine deposits mixed with debris landslide; 5) places of maximum accumulation thickness; 6) falling direction of rock slide; 7) falling direction of rock avalanche; 8) climbing direction on the opposite slope and diversions of the displaced mass; 9) falling back directions; 10) muddy wave drifts; 11) cloudy waters tracks and throwing alluvial debris at AEM waste water; 12) muddy wave tracks at the foot of the slopes; 13) cutting down direction of the trees on the borders of the devastated area; 14) basin upstream the displaced mass (from Govi & Turitto, 1992, modified).
.
The mass roared up the opposite slope of the valley to about 300 m above the valley floor, then split into two parts, diverted upstream and downstream:
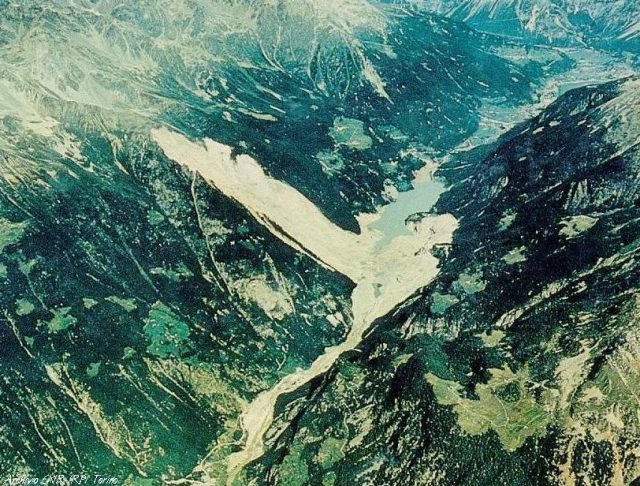
General view of the landslide area showing the 2100-m stretch where the valley was dammed. The flow of water in the channel generated a barrier lake. For this reason inhabitants living downstream had to be evacuated, due to the very high risk of an overtopping and breaching of the dam.
.
The mass that moved downstream travelled almost 1400 m from the impact point. The mass plunged into the small lake, displacing alluvial debris and muddy water to a height of 140 metres. The impact unleashed a large wave that moved quickly upstream. Eyewitnesses reported that the wave travelled 1,000 m in about 30 seconds (Govi & Turitto, 1992). Mud marks were surveyed at a maximum height of 95 m near the source, decreasing to 15 m northward at a distance of about 1,300 m. The villages of Poz, San Antonio and Tirindrè were destroyed. More than 2 km upstream, 27 people were killed in the village of Aquilone, which had not been completely evacuated:-
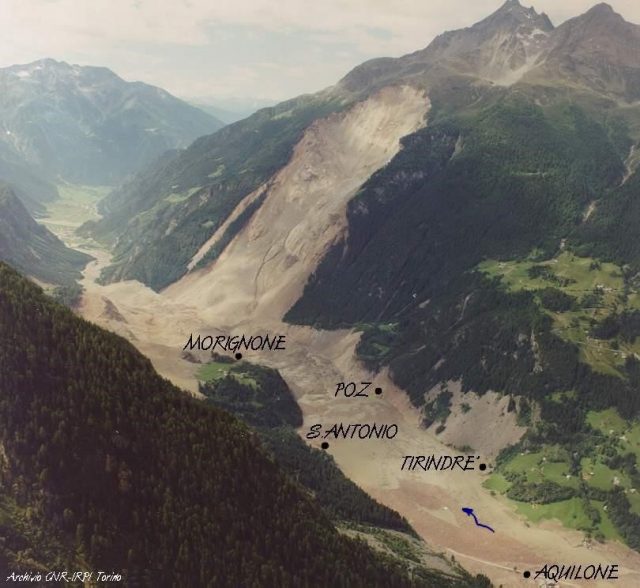
Extent of Mount Zandila rock avalanche. The mass rapidly fell towards the Adda valley bottom destroying Morignone. The material moving upstream fell into the small lake splashing the muddy water and the alluvial materials: a large wave moved very quickly sweeping away the other four villages.
.
Just before the wave impact, survivors saw the bell tower of San Antonio church shatter from the violent blast, which also blew down also the trees of the opposite slope over 300 m.
A dark dust cloud, extending up to 2 km elevation on the opposite side of the valley and upstream to Massaniga creek, was observed. It reportedly disappeared about 20 sec later (Azzoni et al., 1992).
No seismic activity was recorded before the collapse. The landslide generated a seismic signal recorded by instruments over 150 km away for a period of about 30 seconds, comparable to a M=3.9 earthquake (Govi, 1989). The seismograms indicate the detachment of the mass occurred in 18 seconds and the fall in 23 seconds.
The impacts and the remedial works
The valley was dammed by a estimated volume of about 40 million cubic metres more than 2 km long. The average thickness of the accumulation was 30 to 60 m, with a maximum of 90 m:-
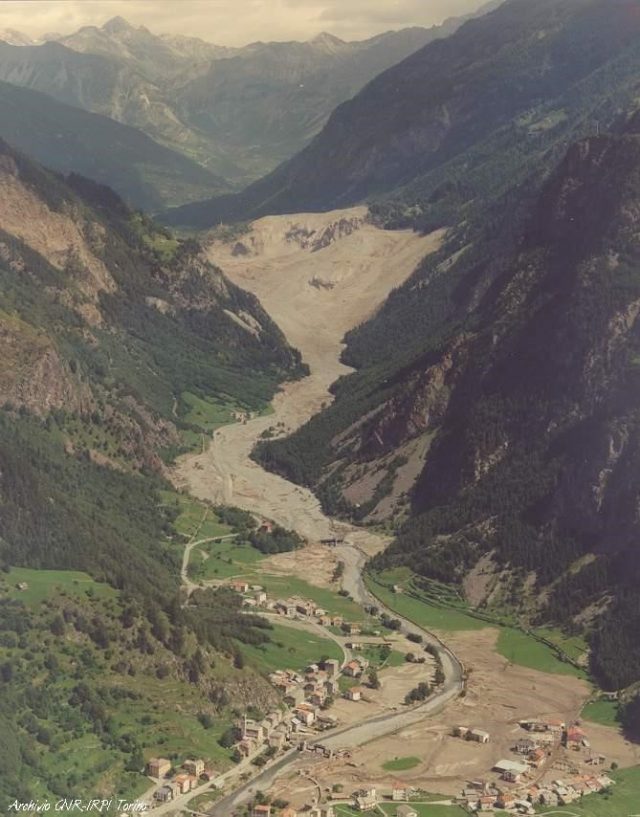
The Adda valley floor, looking downstream, after the landslide. The valley was dammed by a debris accumulation 2,100 m long and about 200-700 m wide: the great part of this mass was 30 to 60 m deep, with a maximum local thickness of 90 m. The displaced mass moved up to the opposite slope (on the right), attaining a height of 300 m above the valley floor.
.
It was made up of material ranging in size from fine debris to coarse blocks up to 10 m across (Azzoni et al., 1992), but mostly consisting of deposits from silt-sand to boulders 30 cm in diameter.
The flow of water in the channel upstream from the landslide dam formed a lake. After thirty days, following an intense rainstorm, the lake filled to a volume of about 20 million cubic meters. Downstream inhabitants had to be evacuated, due to the very high risk of an overtopping and breaching of the dam. As an emergency pumping system proved inadequate for reducing the likelihood of overtopping, a spillway was built at the top of the blockage to control the discharge and to evaluate the resistance of landslide dam to down cutting. The induced flow did not cause significant erosion of the dam, probably due to the gentle slope of the spillway. However, the downstream face of the blockage was reinforced and two diversion tunnels were fully opened the following year.
References
Azzoni A., Chiesa S., Frassoni A. & Govi M. (1992) – The Valpola landslide. Engineering Geology, Elsevier Science Publishers B.V., Amsterdam, 33, 59-70
Govi M. (1989) – The 1987 Landslide on Mount Zandila in the Valtellina, northern Italy. Landslide News, Japan landslide Soc., 3, 1-3.
Govi M. & Turitto O. (1992) – La frana di Val Pola del 1987 in alta Valtellina. In Vallario A. “Frane e territorio”, Napoli, Liguori Ed., 392-414.
Baikalsk: a horrifying example of a high risk waste storage facility in Russia
Baikalsk: a horrifying example of a high risk waste storage facility in Russia
In the wake of my recent posts on the high risks associated with tailings facilities, my friends at the Rivers without Boundaries coalition have contacted me to draw my attention to a really interesting, and deeply alarming, situation at Baikalsk in Russia, which sits on the banks of Lake Baikal. As you may be aware, Lake Baikal is the largest freshwater lake on Earth, containing about 22% of the World’s surface freshwater. As such, it is an immensely important resource.
The issue at hand is a set of waste storage ponds built on the banks of the lake on the edge of the town of Baikalsk. These waste storage facilities were built to deal with waste from the Baikalsk pulp and paper mill, which was shut down in 2013. Google Earth has good imagery of the site – the location is 51.480, 104.232:-
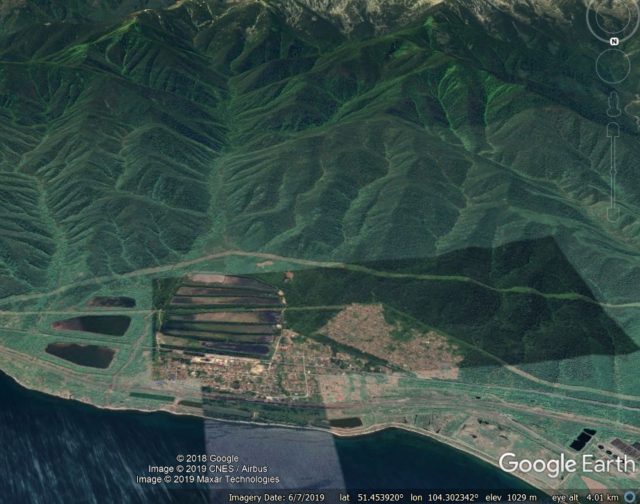
A Google Earth image of the waste storage facilities at Baikalsk. The image is looking towards the south.
.
The image shows at least 13 waste storage ponds in three clusters. Three are located very close to the bank of the lake, three larger facilities are located to the east and the remainder are situated upslope of the works in a staircase up the hillside. These can be seen more clearly below:-
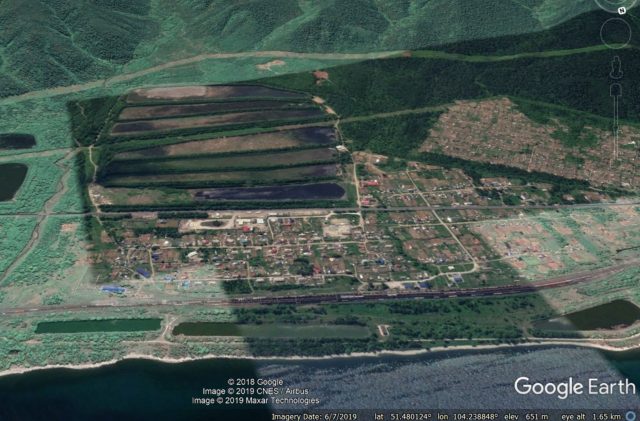
A Google Earth image of the major waste storage facilities at Baikalsk. The image is looking towards the south.
.
The potential threat here lies in the setting of the waste ponds. As the first image shows, the whole site is located on an active fan fed by the channel that emerges from the mountains. It is entirely reasonable, based upon the morphology, to assume that this channel is subject to flash floods and debris flows. In these systems, one would expect that high volume flows will overflow the channel and migrate across the fan. If so, the first waste pond in the staircase would be at high risk of being inundated. This threat is substantial – indeed there is a paper online (Stupin et al. 2018 – NB PDF) that has examined the behaviour of these systems, and noted that:
A special emphasis shall be placed on mudflow hazards caused by small river basins of the Bolshaya and Malaya Osinovka flowing into the Lake Baikal to the east of the Baykalsk city and the resulting destruction of settling basins and disposal of poisonous wastes to the Lake Baikal in case of extraordinary rise of water level (5 m and more)… This nearly happened during the flood in 1971 when emergency measures were only able to prevent the irruption of high waters into settling basins.
The potential consequences of such an event entering the highest waste storage pond should be clear – indeed, based on the image above the likelihood of a very large debris flow breaching the first waste pond looks to be very high indeed. This pond would probably fail, inundating the next one downslope, and so on. Thus, it is entirely feasible that seven or more storage facilities could fail, releasing the waste into the lake. Of course, the three ponds to the east are also vulnerable.
The 13 waste storage ponds are reported to store about 6.2 million tons of waste in total.
It is difficult to ascertain the true level of threat at this site, but it must be considered to be very high. The worst case scenario is the one that I have outlined above, but of course pollution could also be released by the failure of the retaining structures at any of the 13 ponds.
At the very least, it seems to me that this site needs an urgent assessment of the integrity of each of the retaining structures (if this has not already been undertaken), and works to manage the flows in the channel to minimise the potential for the ponds being breached. Stupin et al. (2018) note that:
Throughout the entire historical period the considered territory is characterized by numerous clearance of debris flows with high frequency, but unclear periodicity. The last disastrous mudflow took place in 1971 and 1973 and since then the given territory was quite standard, which is unfavorable since the longer the interval between mudflows, the stronger and more dangerous they are.
The risks at this waste storage site are clearly unacceptably high, and the consequences of a major failure into Lake Baikal at Baikalsk would be truly catastrophic. And it is worth noting that these are not the only waste storage ponds in this area.
Reference
Stupin, V.P. et al 2018. System of geo-information mapping of debris flows hazard in the southern Baikal region. IOP Conference Series: Earth and Environmental Science 194 102002.
28 July 2019
The Cobriza Mine tailings failure: a high resolution image from Planet Labs
The Cobriza Mine tailings failure: a high resolution image from Planet Labs
The kind folks at Planet Labs have generously collected a high resolution satellite image of the Cobriza Mine tailings failure in Peru, which happened on 10th July 2019. The image, collected with the high resolution SkySat sensor on 20th July 2019:
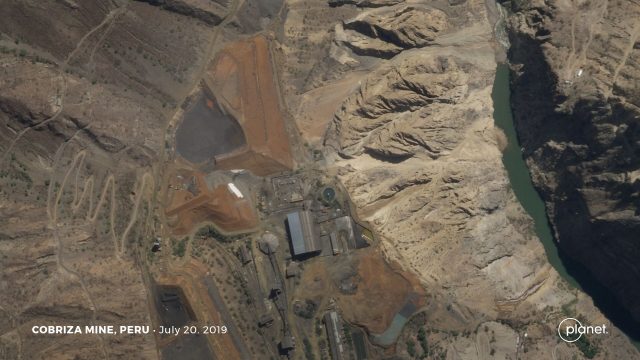
Planet Labs SkySat image of the Cobriza Mine tailings failure. Image collected 10th July 2019. Copyright Planet Labs, used with permission.
.
In the image below, I have highlighted the key features:-

Annotated Planet Labs SkySat image of the Cobriza Mine tailings failure. Image collected 10th July 2019. Copyright Planet Labs, used with permission.
.
The rupture in the tailings structure can be seen clearly. There appears to be tailings in a channel leading down from the mine terrace, which may well be the pathway followed by the tailings. In the river channel a small fan has formed, presumably consisting of tailings and slope materials. This deposit will mobilise and travel downstream in due course.
News reports suggest that the volume of tailings that was released by the breach was 67,000 cubic metres. Of this, 37,000 cubic metres entered the river channel. The impact of the heavy metal pollution downstream is still not clear, but in comparison with some other events, this is a comparatively small release of tailings. This does not make the failure of the structure any more acceptable, of course. The reports also suggest that the tailings damaged the electrical substation at the mine, interrupting power supplies to local communities.
I have yet to see an explanation for the failure of the tailings structure at Cobriza Mine; I’m sure that this will emerge in due course.
Reference and acknowledgement
Thanks to Robert Simmon for his help in acquiring and processing the image.
Planet Team (2019). Planet Application Program Interface: In Space for Life on Earth. San Francisco, CA. https://www.planet.com/
25 July 2019
The site of the Pingdi landslide, in Shiucheng County, China
The site of the Pingdi landslide, in Shiucheng County, China
It is now clear that the landslide in Shiucheng County in Guizhou Province, China, earlier this week occurred close to the village of Pingdi. As a result I shall call this failure the Pingdi landslide until a formal name emerges. News reports indicate that 15 bodies have been recovered but that a further 30 people remain missing. Assuming that they were involved in the landslide there is little hope that they have survived.
I have been able to locate the landslide from the images – it is at 26.256, 104.668. There is good imagery of the site on Google Earth. This oblique image, from Google Earth, shows the site in November of last year:-
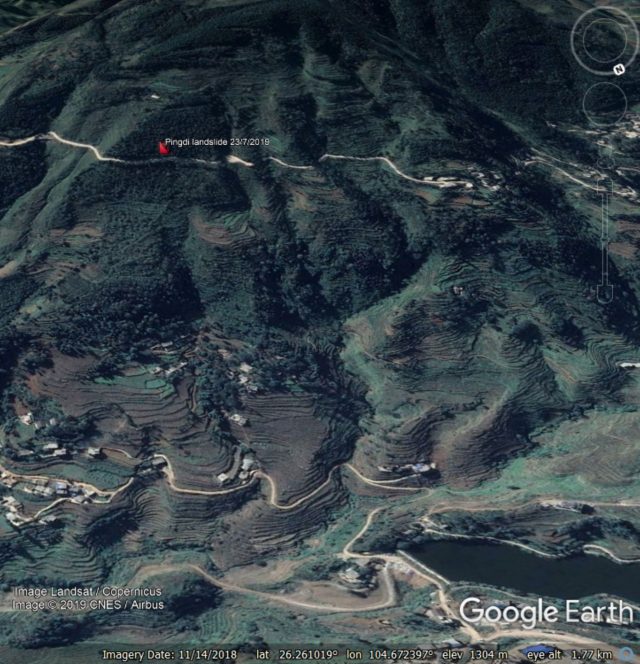
Google Earth image of the site of the Pingdi landslide in Guizhou, China. The image was collected in November 2018.
.
With hindsight this site looks problematic, with a lobate form, areas of deep incision and some very steep slopes. It is interesting that the upper reaches of the area that failed have not been terraced, and remain forested. I wonder why this was the case. There is also quite an interesting structure right of the crown of the slope that failed. This can be seen as a linear form across the slope near to the top of the forested area. It shows up more clearly in Google Earth images from 2017:-
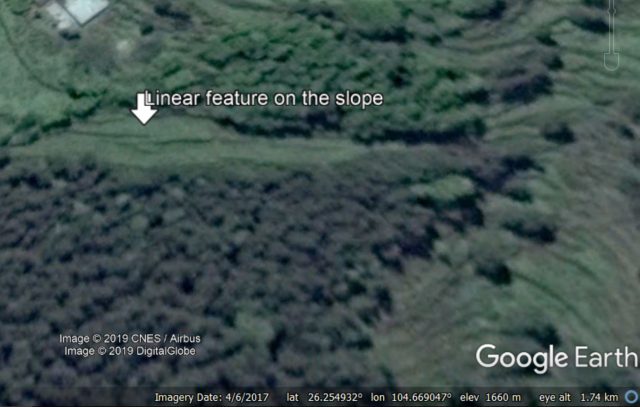
Google Earth imagery from 2017 showing the site of the Pingi landslide in China. I have highlighted a linear feature at the crown of the slope that failed.
.
I suspect that this is most likely to be a terrace rather than a tension crack from the Pingdi landslide, but it is worthy of more detailed investigation. However, I do not think that failue at this site could have been anticipated on the basis of the images and morphology alone.
But there is one other, probably more important aspect to note here. The figure below shows two Planet Labs PlanetScope images of the site of the Pingdi landslide, from 2018 and 2019:-
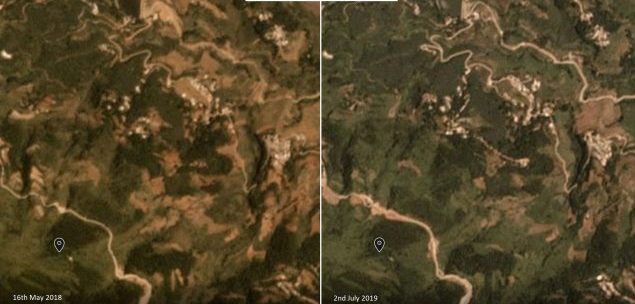
Planet Labs images showing the location of the Pingdi Landslide in 2018 and 2019. Image copyright Planet Labs, used with permission
.
I have marked the approximate location of the crown of the landslide on the two images. The failure was towards the northeast. There is a very obvious change between them – sometime between May 2018 and July 2019 the road towards the top of the slope has been widened, and there are cut slopes above the road.
Thus, a sensible initial hypothesis here is that the block upslope was destabilised by the roadcut, and failed in the early part of the monsoon. The initial failure may have been small, but the debris loaded the slopes below the road, causing a large-scale failure that entrained and became reasonably mobile.
If this interpretation is correct then it would be similar to the 1998 Sarno landslides in Italy.
Reference
Planet Team (2019). Planet Application Program Interface: In Space for Life on Earth. San Francisco, CA. https://www.planet.com/
24 July 2019
Shuicheng County: a very large, fatal landslide in Guizhou Province, China
Shuicheng County: a very large, fatal landslide in Guizhou Province, China
A very large landslide occurred in Shuicheng County, in Liupanshui City, Guizhou in China on the evening of Tuesday 22nd July 2019. Xinhua is reporting that the known loss of life totals 13 people, but that about 32 further people remain missing. Eleven people have been rescued. In terms of losses this is the largest landslide of the 2019 Asian monsoon to date.
TVNZ has the best image of the landslide that I have seen so far:-
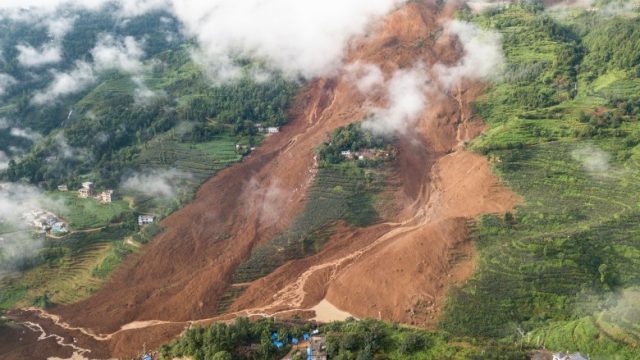
The landslide in Shuicheng County, Guizhou on 22nd July 2019. Image by Associated Press via TVNZ.
.
Xinhua estimates that the landslide has a volume of about 2 million cubic metres, which feels about right. The landslide appears to be primarily in deeply weathered regolith and soil rather than bedrock. Note the complex runout behaviour, which has followed existing drainage lines, leaving an island of unfailed material (with at least one building) in the middle of the slide.
There is a decent gallery of images from this landslide on the Caixin Global website. It includes this image of the upper regions of the landslide:-
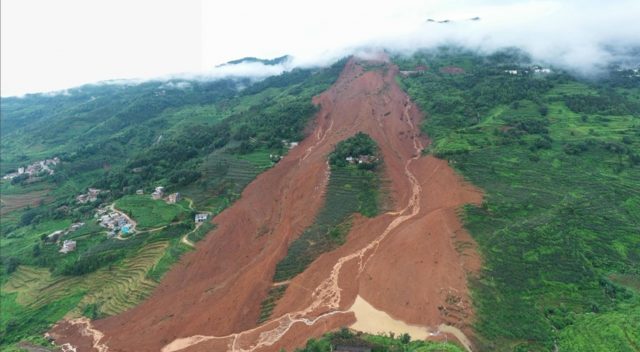
The landslide in Shuicheng County, Guizhou on 22nd July 2019. Image by Caixin Global and CCTV.
.
In form this landslide resembles the May 2016 Aranayake landslide in Sri Lanka, which killed 127 people. In that case the landslide started as a comparatively small planar slide in the crown area, which then triggered failure and entrainment on the lower slopes. I would suggest that this might well be the case here.
The images appear to show the presence of reasonable amounts of water, although none of the reports that I have seen to date explicitly link the event to rainfall.
A further landslide occurred in Guizhou Province yesterday, in Hezhang County. This event is reported to have killed up to seven people.
19 July 2019
Chamoson: a dramatic debris flow video from last year in Switzerland
Chamoson: a dramatic debris flow video from last year in Switzerland
This morning I stumbled across a really interesting debris flow video, apparently dating from 7th August 2018. The reports suggest that it was shot at the village of Grugnay in Chamoson in Switzerland:
.
The video shows a highly mobile flow. The mobility is demonstrated by the effects of the impact of the upper part of the flow with the bridge:-
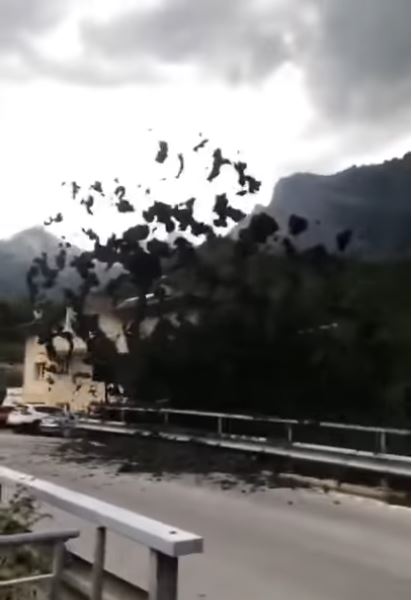
The extreme mobility of the Grugnay debris flow in Chamoson, Switzerland in August 2018. Still from a video posted on Youtube
.
There are other views of this event online. This compilation video from the Guardian also shows the effects of the debris flows striking parts of the village. The final sequence is particularly dramatic:-
.
Geoengineer has a report about this event:-
A huge mudslide triggered by an overflowing flood caused by heavy storms struck the village of Grugnay in Switzerland on Tuesday night, 7 of August.
Fortunately, no injuries were reported as the slide provoked only material damage mostly concerning cars and houses. Swiss media reported that the incident started in a stream just above the village of Grugnay. People, that did not panic, opened road for the debris mass to follow its route downstream. According to local radio station Rhone FM, some buildings have been evacuated and two roads leading to the villages of Mayens de Chamoson and Ovronnaz were also closed.
The last months, the region has suffered extreme weather conditions. Snow, stored in the winter, is rapidly melting due to the high temperatures of the present summer. Thus, a vast amount of water is released into local rivers that have become raging torrents.
The landslide left a dramatic deposit, but fortunately caused no loss of life:
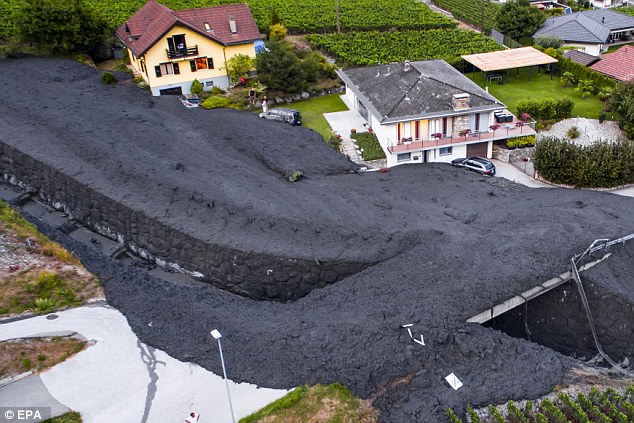
The aftermath of the debris flow at Grugnay in Chamoson, Switzerland on 7th August 2018. Image via EPA.
17 July 2019
The start of the 2019 South Asia monsoon
The start of the 2019 South Asia monsoon
Last week the summer monsoon arrived in South Asia with a vengeance, with heavy rainfall across the upland areas of Nepal, India, Bhutan, Pakistan and Bangladesh. Reports suggest that losses across these regions have been high, with floods and landslides both causing significant loss of life. As usual I have been trying to keep abreast of those landslides that have caused loss of life.
The graph below shows the cumulative number of fatal landslides that I have recorded in the South Asia region to date in 2019, up to and including 16th July 2019:-
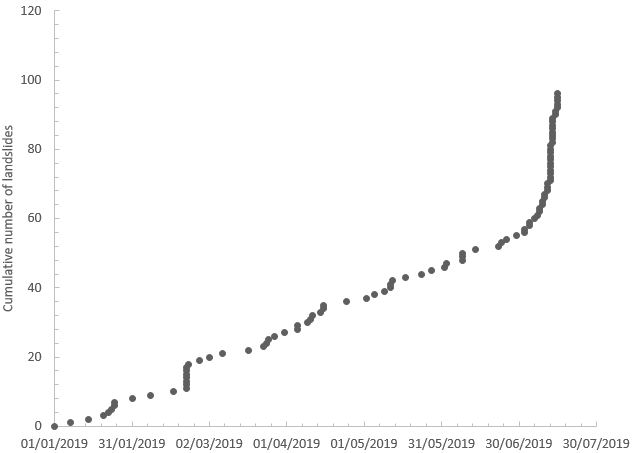
The cumulative total of fatal landslides in South Asia, showing the impact of the summer monsoon. Data correct to 15th July 2019.
.
The graph shows the steady accumulation of landslides through the first half of the year, with a jump in late February with a flurry of landslide events in northern Pakistan. From about the end of June the effects of the monsoon started to become apparent as the incidence of landslides increases. However, the impacts of the very heavy monsoon rainfall in the last week is very clear.
By way of comparison, this is the same data plotted for SE. Asia, which does not have a strong monsoon signal:-
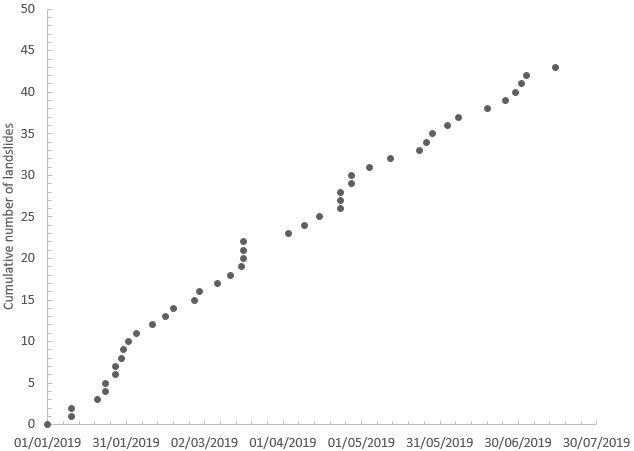
The cumulative total of fatal landslides in South- East Asia, which does not have a strong monsoon signal. Data correct to 15th July 2019.
.
The SE. Asia signal tends to be strongly affected by wetter periods around the turn of the year, but in general the landslide rate is relatively constant.
The recent exceptional monsoon rainfall event started to appear in the landslide record on about 11th July 2019. The image below shows the 7 day accumulated rainfall from the NASA GPM mission. The 7 day period ends on 16th July 2019 at 14:30 UTC:-
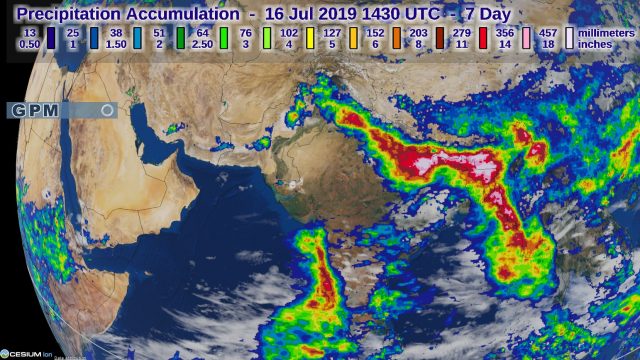
NASA GPM 7 day rainfall data showing the start of the S. Asia summer monsoon.
.
Interestingly, the rainfall record suggests that there was also a significant rainfall event in northern Burma / Myanmar, but I have seen no reports of impacts there. I suspect that this means that I have some missing data. The S. Asia summer monsoon lasts through to September, so there are many more landslides to come in this region this year.
You can find out more about the data that I collect on fatal landslides, which forms the basis for this post, from Petley (2012) and Froude and Petley (2018).
References
Froude, M. J. and Petley, D. N. 2018. Global fatal landslide occurrence from 2004 to 2016. Natural Hazards and Earth System Sciences, 18, 2161-2181, https://doi.org/10.5194/nhess-18-2161-2018.
Petley, D.N. 2012. Global patterns of loss of life from landslides. Geology 40 (10), 927-930.
16 July 2019
Cobriza, Peru: another significant tailings dam failure
Cobriza, Peru: another significant tailings dam failure
Another significant tailings dam failure occurred at Cobriza in Peru on 10th July 2019. Cobriza is a copper mine – interestingly, some reports indicate that “the concentrator was operated at a rate quite below its capacity due to lack of mine ore and lately (2016 and 2017) due to lack of capacity in the tailings dam“. The plant is also subject to a privatisation, originally planned for 2018 but now expected this year. The site is at -12.58, -74.37 if you want to take a look.
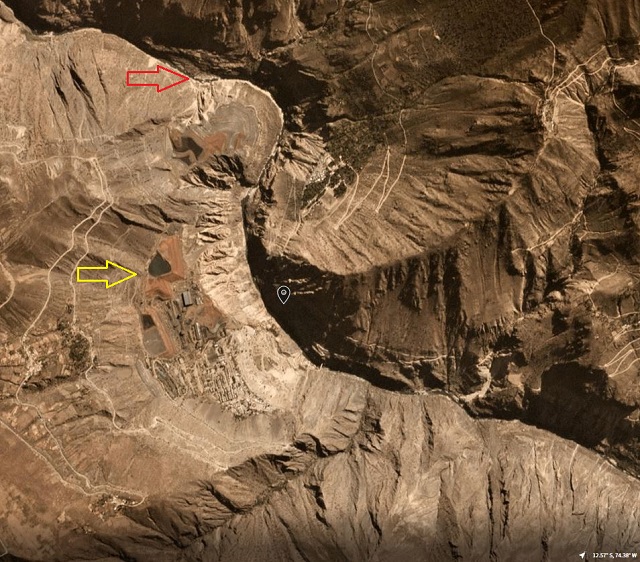
The failure is quite clear in Planet Labs images of the site, collected over the last few days. To get an understanding of the site, take a look at this Google Earth image of the mine and the tailings facilities. The view is taken looking towards the west:-
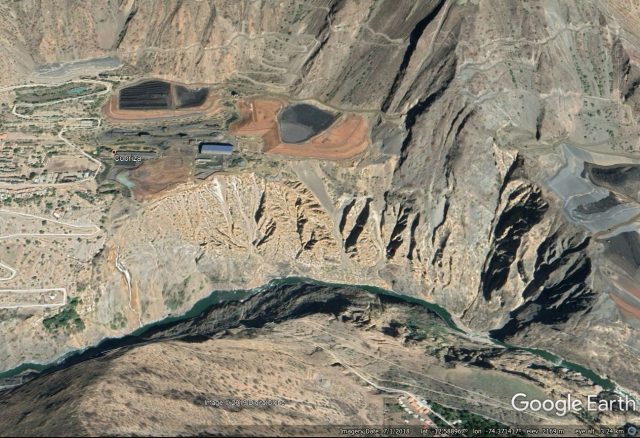
A Google Earth image showing the site of the Cobriza mine in Peru. Note the two tailings facilities.
.
The two tailings facilities are larger than they might first appear – the one on the right (which failed last week) is about 500 metres x 300 metres.
This is a Planet Labs image from 9th July 2019, before the failure, with north at the top of the image:-
Planet Labs PlanetScope image, dated 9th July 2019, showing the Cobriza mine. Image copyright Planet Labs, used with permission.
.
I have highlighted two locations. The yellow arrow indicates the tailings facility that underwent failure last week. The red arrow indicates the bed of the river downstream of the site – note that the water was clear when the image was collected.
The image below, dated 12th July 2019, shows the mine after the failure:-
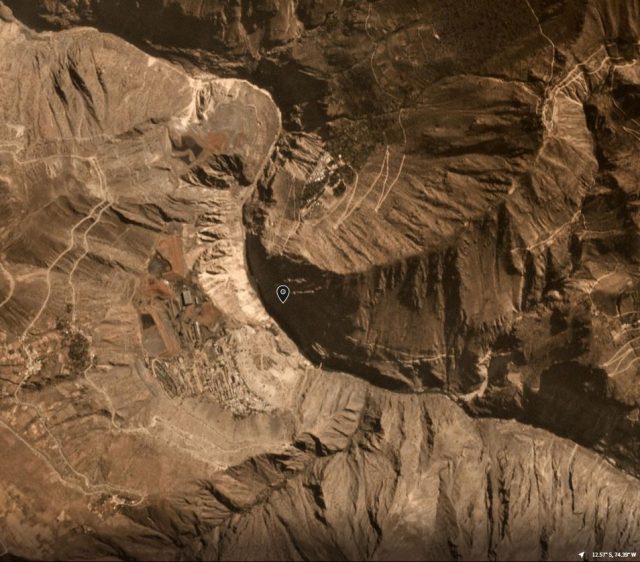
Planet Labs PlanetScope image, dated 12th July 2019, showing the Cobriza mine. Image copyright Planet Labs, used with permission.
.
The change in the geometry of the tailings facility is apparent, marking the site of the failure. The water downstream is obviously contaminated. Note that the water upstream of the mine (bottom right side of the image) is still clear (i.e. unpolluted).
I have provided further detail in the Planet Labs image below:-
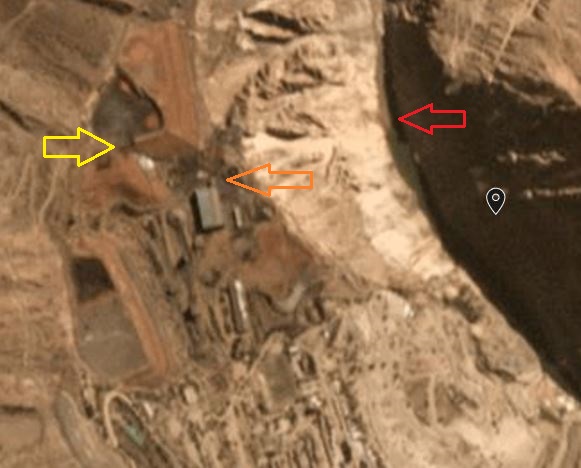
Planet Labs PlanetScope image, dated 9th July 2019, showing the Cobriza mine. Image copyright Planet Labs, used with permission.
.
In this image I have highlighted the breach of the tailings dam with the yellow arrow. The orange arrow indicates clear tailings contamination of the bench around the mine facilities. The red arrow marks the point at which the tailings are entering the channel – note the distinct change in the water colour.
The escape of the tailings has generated a serious pollution incident in the Rio Mantaro. There are fears that a stretch of the river extending for 375 km has been contaminated with cyanide. This video on Youtube reportedly shows the contamination in the Rio Mantaro:-
.
At risk of sounding like a scratched record, I once again emphasise that the failure rate of tailings dams is utterly unacceptable.
Reference and acknowledgement
Thanks to David Reid for spotting this one.
Planet Team (2019). Planet Application Program Interface: In Space for Life on Earth. San Francisco, CA. https://www.planet.com/
15 July 2019
Godre’r Graig: risks to a school from a spoil tip landslide
Godre’r Graig: risks to a school from a spoil tip landslide
At the end of last week, Godre’r Graig Primary School, near Pontardawe in South Wales, was temporarily closed due to the risks of a spoil tip landslide. The decision was taken after a survey by Earth Science Partnership, commissioned by Neath Port Talbot Council, determined that there a medium level risk from a quarry spoil tip near the school. The decision to close the school temporarily is understandable in light of the terrible history of spoil tip landslides in South Wales, including of course the appalling Aberfan disaster in 1966.
This Google Earth image, from 2006, shows the site of the school and the hillslope above it:-
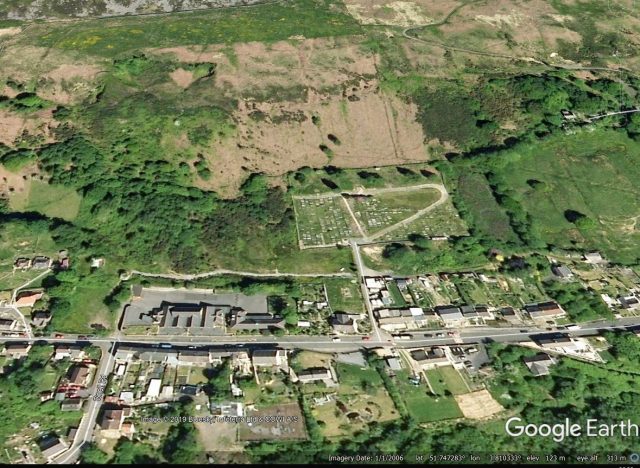
Google Earth image of the Godre’r Graig Primary School, showing the potentially unstable slope above
.
The heavily modified topography, the legacy of mining and quarrying, is clear. According to news reports, “the risk identified is linked to springs and ground water near the school. Officials said that if a stream was blocked during bad weather, rising water levels and pressures in the tip could cause material to flow downhill.”
This is the Ordnance Survey six inch map of the site, from 1948 (accessed via the National Library of Scotland archive). The school is marked Sch., with the buildings outlined in black:-
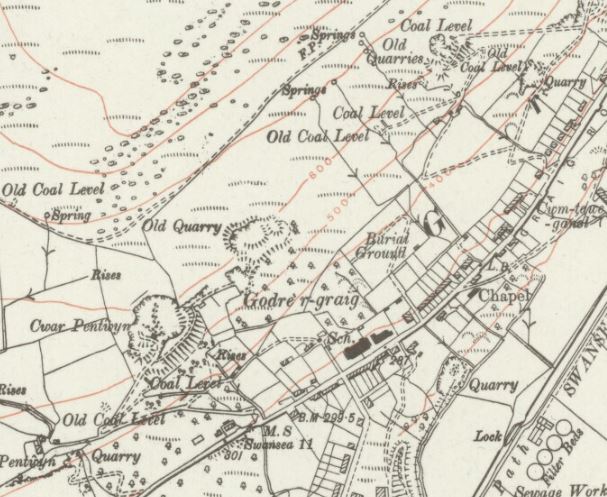
Ordnance Survey six inch map of Godre’r Graig, showing the location of the school and the mining sites on the hillslopes above. Map accessed via the National Library of Scotland.
.
Note on this sheet the multiple sites marked “Coal Level”, the quarries (including the Old Quarry directly above the school) and the “rises”, which are springs. There are also indication of made ground (i.e. fill) to the west of the school, below another quarry.
Perhaps most interestingly, there is a Jacobs report online from December 2013 that provides some detail about landslides at Godre’r Graig. However, this large landslide complex appears to be just to the east of the site that is now causing concern.
The summer school holidays were due to start this week. The local authority will have until early September before the school is due to reopen.
9 July 2019
The Budhiganga River landslide: just one of many landslide challenges in Nepal as the monsoon develops
The Budhiganga River landslide: just one of many landslide challenges in Nepal as the monsoon develops
The monsoon is developing rapidly in South Asia now, with landslide fatalities being recorded in India and Bangladesh in the last few days. The forecast for the east of Nepal and parts of North India is quite concerning over the coming week; we should expect to see some serious disruption. To illustrate the magnitude of the challenges, The Himalayan Times has an article about a landslide on the Budhiganga River, in Bajura District in Nepal. This landslide, which is just one of many such slides across Nepal, has developed rapidly in the last couple of years. The Himalayan Times describes the situation as follows:-
Risk of Budhiganga River blockage has increased due to incessant rainfall following landslide at Dwari of Bajura district….Locals have been terrified as the risk of landslides from Paima of Tribeni to Akkot of Budhiganga has increased. Mayor Ram Singh Rawal of Tribeni Municipality said the landslides occurred with the onset of monsoon. “Landslides have been occurring continuously in big river areas,” he added. Rawal informed that Budhiganga might be blocked anytime if the situation remained the same. He said the villagers were warned to remain alert after the risk of the river blockage increased.
This landslide was highlighted earlier this year as being a location that poses substantial levels of hazard. The article included this overview of the site:-
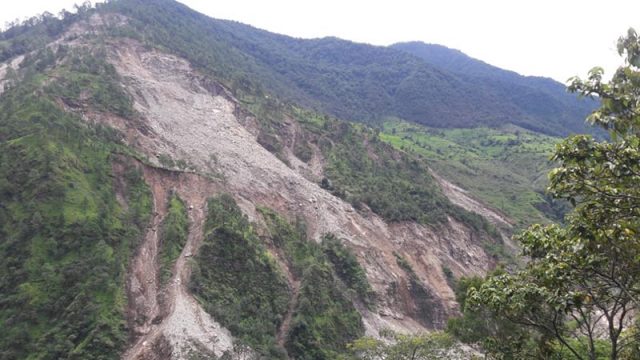
The landslide on the Budhiganga River landslide in Nepal. Photo: Prakash Singh via The Himalayan Times.
.
The state of the site has developed substantially since. The Himalayan Times article this week includes this image of the lower part of the landslide, illustrating the fears of the river becoming blocked:-
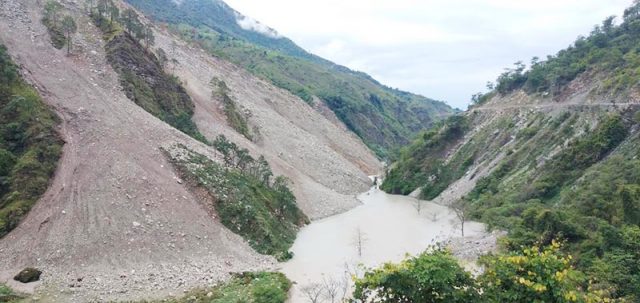
The Budhiganga River landslide in Bajura, on Sunday, July 7, 2019. Photo: The Himalayan Times.
.
This landslide, which is located at 29.393°, 81.399°, can be seen on recent Planet Labs images:-
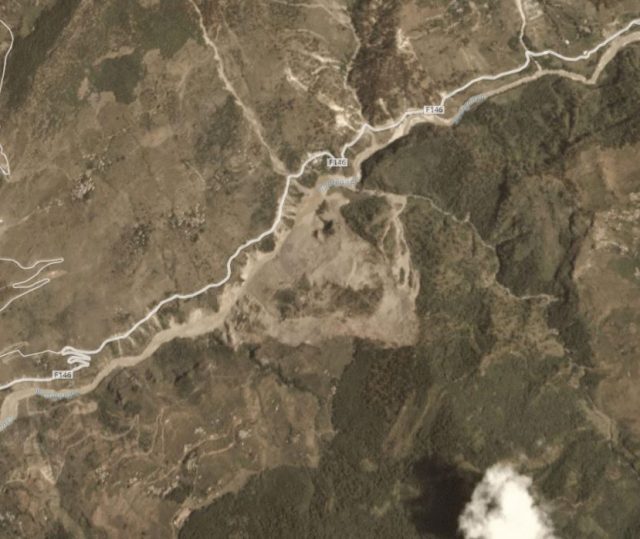
Planet Labs image of the Budhiganga River landslide in Bajura. PlanetScope image collected on 3rd July 2019.
.
This is just one of many landslide challenges that Nepal will face in the next three months or so.
Reference
Planet Team (2019). Planet Application Program Interface: In Space for Life on Earth. San Francisco, CA.
 Dave Petley is the Vice-Chancellor of the University of Hull in the United Kingdom. His blog provides commentary and analysis of landslide events occurring worldwide, including the landslides themselves, latest research, and conferences and meetings.
Recent Comments