
24 December 2011
The Philippine Tropical Storm Washi (Sendong) disaster may have been due to the collapse of landslide dams?
The disastrous floods in the Philippines that resulted from the intense rainfall associated with the passage of Tropical Storm Washi a week ago has rapidly faded from the headlines. However, the death toll continues to rise relentlessly as more bodies are found. The latest report from the MDRRMC in the Philippines now lists 1,100 fatalities and a further 1079 people as missing, though cautions that there is considerable uncertainty associated with the latter statistic. The majority of the losses (674 known deaths, 626 people reported missing) are at Cagayan de Oro, with 332 deaths and 406 missing at Lanao del Norte.
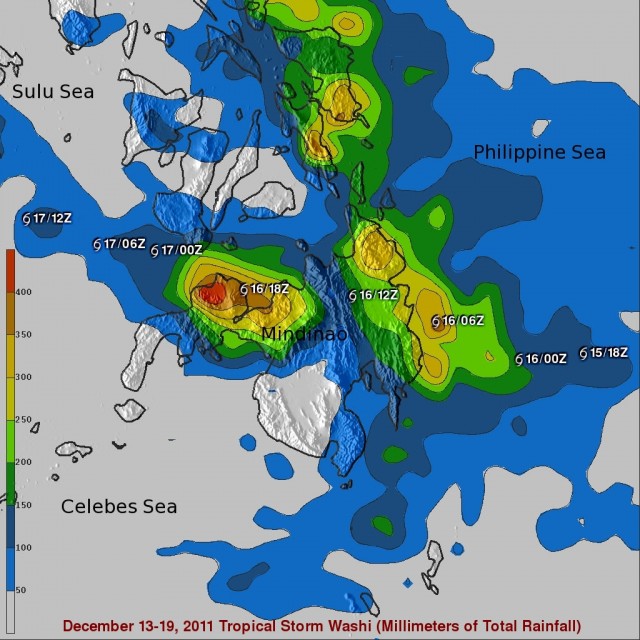
An interesting question is why the floods were so devastating when the tropical cyclone was quite modest in size and intensity. NASA TRMM data has been used to compile a rainfall map:
http://trmm.gsfc.nasa.gov/
These data suggest that the rainfall totals in the coastal area were large – over 400 mm in total as the storm passed through. However, by tropical cyclone standards even this is not particularly remarkable. Undoubtedly a key factor was the location of the communities in a highly vulnerable location, but reports that the floods occurred as a series of catastrophic, very rapid mudflows might suggest that an additional mechamism was at play. According to this article, PAGASA are now suggesting that the key factor may have been the collapse of landslide dams. This quote is from a news conference given by DoST Secretary Mario G. Montejo:
“PAGASA had been doing its job conscientiously,” Montejo said. “In fact, places such as Bohol, Surigao, and Camiguin that heeded PAGASA’s warning and took appropriate actions had mitigated the effects of Sendong.” Montejo, who was with President Benigno “Noynoy” Aquino III when he visited areas severely flooded by “Sendong,” also said that the flashflood that killed and harmed hundreds of people in Northern Mindanao and southern Visayas as was aggravated by the reported collapse of dams along the Cagayan de Oro River.
“It is most likely that the flashfloods in Cagayan de Oro were caused not only simply by the big volume of rain that fell in the watershed of rivers in those places, but essentially of the reported collapse of dams in the upper parts of the rivers,” Montejo said.
Reports from the field that reached the presidential party on the collapse of the dams are being investigated, per instructions of the President, he said. Montejo said that the continuous rains may have caused the accumulation and build-up of water upstream of the dam.
“At some point, the dams may have collapsed when the trapped water filled with debris overtopped the dam. This could have led to dam breakage and failure,” he said.
“When the large volume of water trapped behind the landslide debris dams was released, it triggered the flashfloods. The landslide dam-break mechanism caused the flash floods, which would explain the sudden surge of water reported by survivors in Cagayan de Oro,” Montejo said.
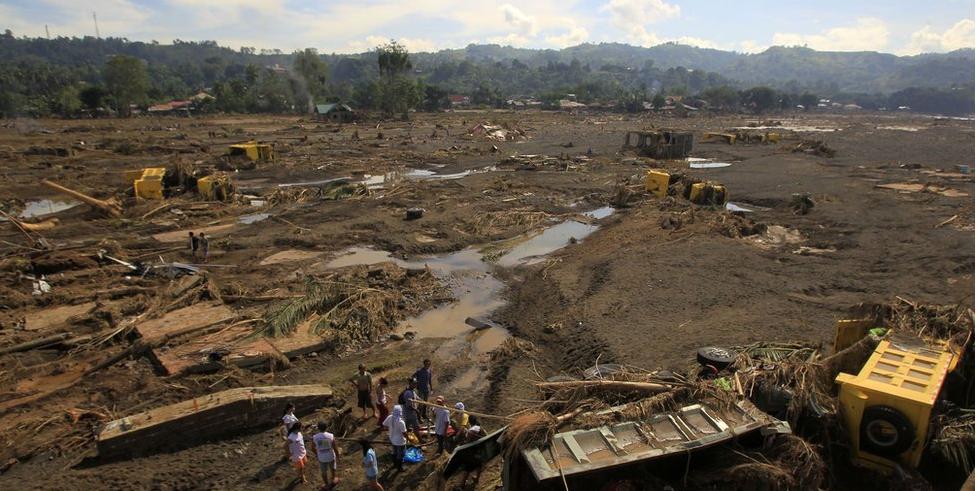
Montejo pointed out that survivors described the flashfloods as “sudden surge”, while post-disaster pictures showed large amounts of mud and debris, including trees, carried by the raging flashfloods. He also clarified that although the rainfall dumped by “Sendong” was not like that of typhoon “Ondoy” that generated 181 mm of rain for one day that caused the disastrous flashfloods in 2009. The landslide dam break that happened in “Sendong” had happened in 2004 in Infanta, Quezon and in 2008 in Iloilo, he said.
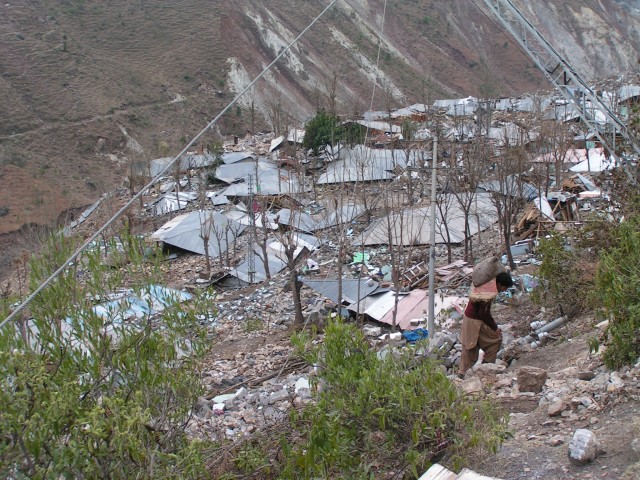
This is interesting news that fits with the observed behaviour. If true, it should be comparatively easy to identify the landslide scars and remains of the lakes, even though they were short-lived. Although there is now a NASA image of the affected area, this unfortunately does not extend up to the headwaters, where the scars will be located. A landslide process would be consistent with the observation of large amounts of wood debris, as this image demonstrates:
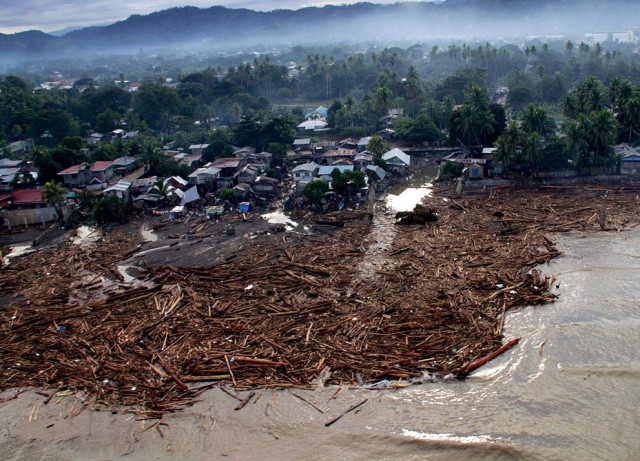
http://theatlantic.tumblr.com/post/14569747625/deadly-tropical-storm-washi-on-december-16th
I shall await further news on this with great interest. If confirmed it will mean that the Tropical Cyclone Washi disaster was in fact primarily a landslide-induced event.
23 December 2011
The latest events in the Christchurch earthquake sequence
This morning has seen the next series of events in the now 16-month long Christchurch Earthquake sequence in New Zealand. The GeoNet map below shows the location of this series of events, which have occurred to the east of Christchurch:
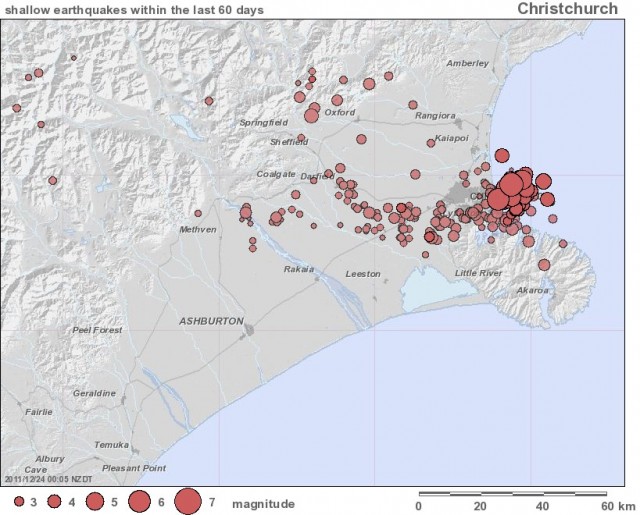
Although one of these events were large earthquakes (the largest is M=6.0), the shallow depth (6 km for the largest), proximity to the city and vulnerable materials will have combined to make this a significant series of events once again. Chris Rowan at High Allocthonous has en excellent post on the earthquake focal mechanisms, so I won’t repeat that here. However, it is worth looking at the above data alongside this map of the early events, produced by the ever-impressive people at GNS Science:
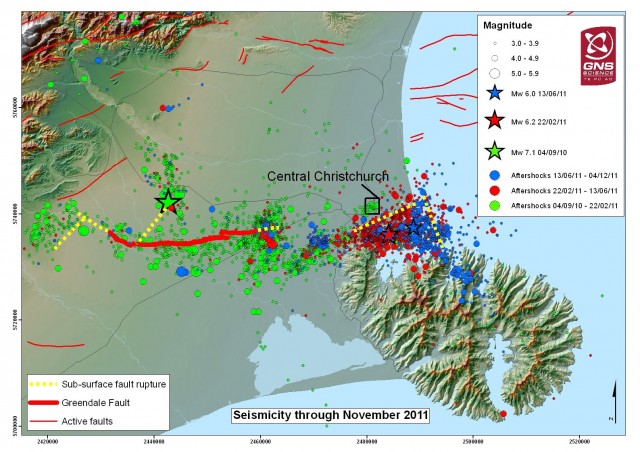
Note that the first event (the Darfield earthquake) and aftershocks (in green on the map) occurred to the west of the city. The Feb 2011 events (red) were further to the east, and the June 2011 to the east once again. This most recent sequence is further east again.
For the most recent events, Geonet also have a map of provisional strong motion data online:
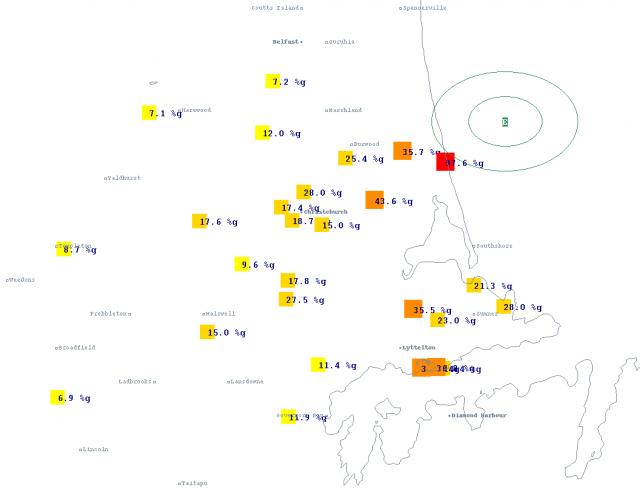
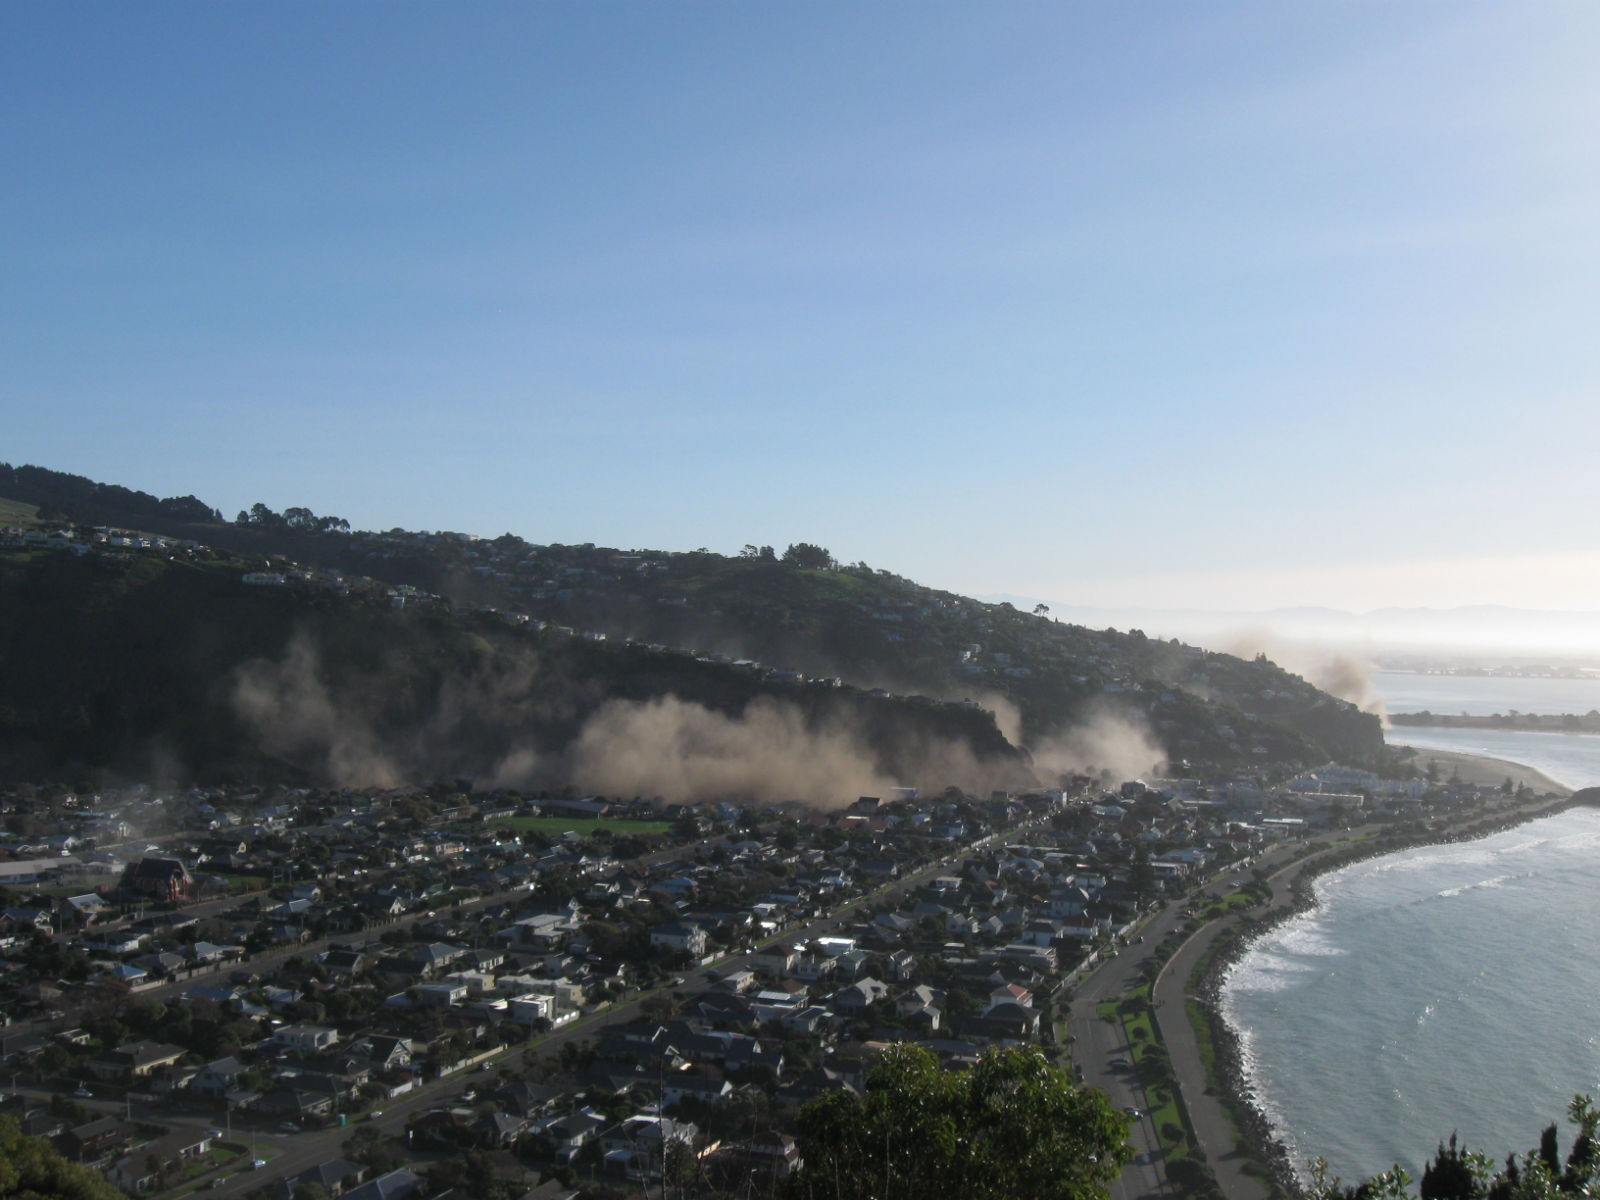
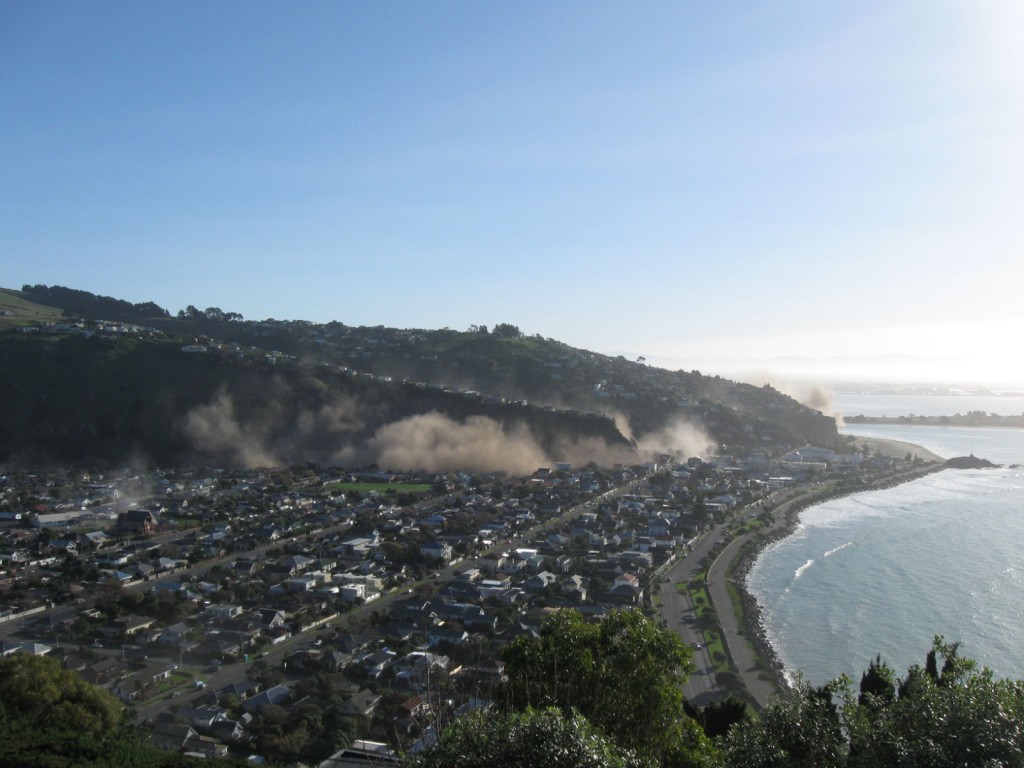
These are really high peak ground motions, suggesting that liquefaction, structural damage and rockfalls will again be a problem. Yahoo News reports that rockfalls have occurred in the bluffs to the east of the city (this is the area that I visited in the summer – and indeed I will be back there in three weeks time) and has this image, which is almost certainly the dust generated by rockfall events (compare it with these images from the earlier events):
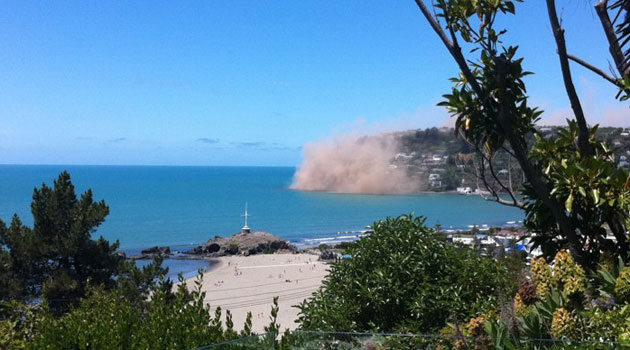
http://au.news.yahoo.com/world/a/-/world/12446120/5-8-earthquake-felt-in-christchurch
Aside from the very obvious short-term impacts of this event, I suspect that there are a number of longer term effects, which might include:
1. Increased short-term seismic activity. This brilliant GNS Science graph shows the decay of seismic activity with time since the initial event:
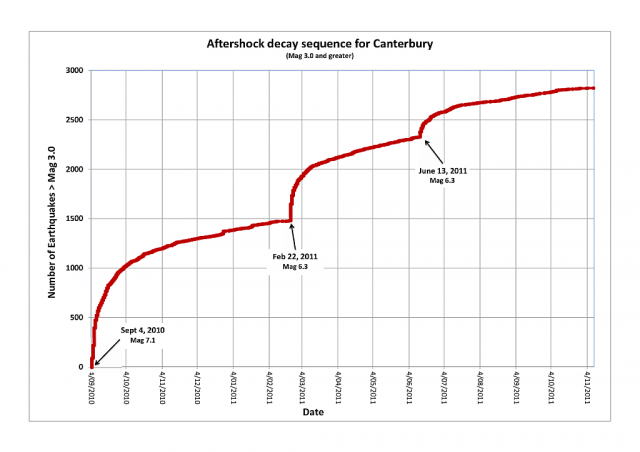 The effect of this most recent event is probably to induce another step in this graph and thus to extend the timeline over which seismic activity will continue. It will reduce to background levels in due course, but it is hard to know exactly when this will occur.
2. Further challenges for risk assessment. A major issue in Christchurch is risk assessment for liquefaction and in particular rockfalls. This continued earthquake activity will be complicating these calculations, which of course have major implications for the people who live in those areas;
3. Increased pressure on the Earthquake Commission (EQC). The Christchurch event has placed substantial strains on EQC, which is a government-backed residential earthquake insurance pool. These most recent events may well mean additional claims, which will further deplete their resources, and will also have an impact on the reinsurers who provide some of the cover. I am not in any way suggesting that EQC cannot meet these claims – they can of course – but rebuilding the fund in the aftermath of this sequence must be a key priority.
4. Psychological impacts on the local population. Last and by no means least, the earthquakes are likely to have at least some impact on the local population. There has already been a net out-migration from the city. These repeated events are making the return to normal life difficult, which places a strain on everyone.
20 December 2011
No! No! No! Misconceptions about seismic hazard in Kashmir (and what the literature said about earthquake hazard in Haiti)
![]() One of the stories that emerged from the AGU Fall Meeting was this report about the potential for a further large earthquake in the Kashmir region of the Himalayas. This is work by the eminent seismologist Roger Bilham warning that Kashmir remains a region of high seismic hazard. The news reports, of which there were several, was based on a paper presented at the AGU Fall Meeting, for which the abstract is as follows:
One of the stories that emerged from the AGU Fall Meeting was this report about the potential for a further large earthquake in the Kashmir region of the Himalayas. This is work by the eminent seismologist Roger Bilham warning that Kashmir remains a region of high seismic hazard. The news reports, of which there were several, was based on a paper presented at the AGU Fall Meeting, for which the abstract is as follows:
| ABSTRACT ID: T54B-06 |
| TITLE: Velocity Field in the NW Himalayan Syntaxis: Implications for Future Seismicity |
| SESSION TYPE: Oral |
| SESSION TITLE: T54B. Earthquake Geology and Seismotectonics in South and East Asia IV |
| AUTHORS (FIRST NAME, LAST NAME): Roger G Bilham1, Walter Szeliga1, Bikram Singh Bali2, Asif Khan3, Abdul Wahab3, Faisal Khan3, Sufyan Qazi3 |
For the past eight years we have monitored crustal deformation in Ladakh, the Karakoram, Kohistan, Zanskar, Salt Range and Pir Pinjal, using a combination of fixed and campaign GPS measurements, to provide quantitative constraints on the rates of convergence in the NW syntaxis of the Himalaya. We find a 13-17 mm convergence rate with maximum SSW velocity gradients NE of the Kashmir Valley beneath the Zanskar range, and maximum SSE directed gradients NW of the Peshawar basin beneath the Kohistan range.
The inferred locking line appear to follow the 3.5 km contour as it does elsewhere in the Himalaya, however, this results in a 200 km wide décollement, twice the width of the central Himalaya. The SSE velocity of the Potwar Plateau is 3 mm/yr, significantly slower than the 6-12 mm/yr inferred from geological offsets along the Kalabagh fault in the past 10 My, and hence an inferred slip deficit exists between the Kohistan Range and the Salt Range. No great earthquakes are known in this area, and it is unclear whether the deficit is annulled by accelerated salt-decollement creep or by seismic rupture. A brief period of accelerated creep followed the 2005 Kashmir earthquake.
Velocities across the Kashmir Valley and Pir Pinjal are suggestive of a locked décollement (no creep) implying possible SE translation of the entire Kashmir Valley in great earthquakes. Were the segment of the Himalaya between the 2005 Kashmir Earthquake, and the Mw7.8 Kangra earthquake to slip 20 m in a single earthquake, it could do so in a Mw=9. No earthquake of this severity is known, although the historical record includes several earthquakes that may account for partial slip of the decollement. Slip on the Reasi fault north of the frontal Pir Pinjal range front can account for less than half the observed convergence at this longitude, and although no surface slip has been detected in the ranges fronting the Punjab plains, we deduce that the frontal folds, and associated blind thrusts, may absorb convergence of 5-9 mm/yr.
Note a few things here. First, this is based on geodetic measurement – i.e. real data. Second, the abstract says (my emphasis): “were the segment of the Himalaya…to slip in a single earthquake, it could do so in a MW=9.”.
In the article linkled to above, this is translated into a quite measured piece about the potential for a large earthquake, and the likely consequences of such an event. This earthquake risk is very real, and urgently needs addressing through preparedness and measures such as improved building codes. This is not an issue that can be ducked.
Today, two Pakistan newspapers (here and here) are reporting a response from “the director of the Pakistan Meteorological Department, Director General Arif Mehmood that seeks to “downplay” the fears. The longer of the two articles has a report of an interview with the Director General, including a direct quote from him (note both articles have essentially the same take on this topic):
“Talking to this scribe PMD Director General Arif Mehmood played down the findings about any major earthquake in the Kashmir region and said the recent earthquake in Haiti is a grim and embarrassing reminder that seismologists cannot predict earthquakes.
He said if anyone predicts major earthquake anywhere in the world it means he tries to over-simplify a much complicated issue because there is no evidence in the recorded history that anyone was able to rightly predict any earthquake before its occurrence. “The researchers have been doing hectic work and may be sometime in future we are able to rightly predict earthquakes but at the moment I am not ready to believe any such prediction because no science or methodology is yet available to do so,” he said.”
So where does one start with this stuff? Well, note that the Director General builds a strawman argument: “recent earthquake in Haiti is a grim and embarrassing reminder that seismologists cannot predict earthquakes”. Correct! However, Professor Bilham did not predict an earthquake – and indeed nor would he try. What he has done is to measure strain patterns, which are an indication of earthquake potential, and thus has estimated seismic hazard. And indeed Haiti provides a chilling warning to Kashmir, as two years before the earthquake Manaker et al. (2008) wrote:
“Similarly, the Enriquillo fault in Haiti is currently capable of a M(w)7.2 earthquake if the entire elastic strain accumulated since the last major earthquake was released in a single event today”
This was not a prediction of an earthquake, but geodetic measurements being used to highlight seismic hazard. Note that the earthquake that occurred in 2010 was Mw=7.0, although it is now thought that it occurred on a different (parallel) fault system. So, this “downplaying” of the warning from Bilham is based on an entirely false premise.
In the aftermath of the 2005 Kashmir earthquake I visited the area twice. So I finish this post with two pictures that I took of the aftermath of the earthquake. It is this that we are trying to prevent here . Rejection of legitimate, science-based warnings of seismic hazard do the population of potentially affected areas a huge disservice:
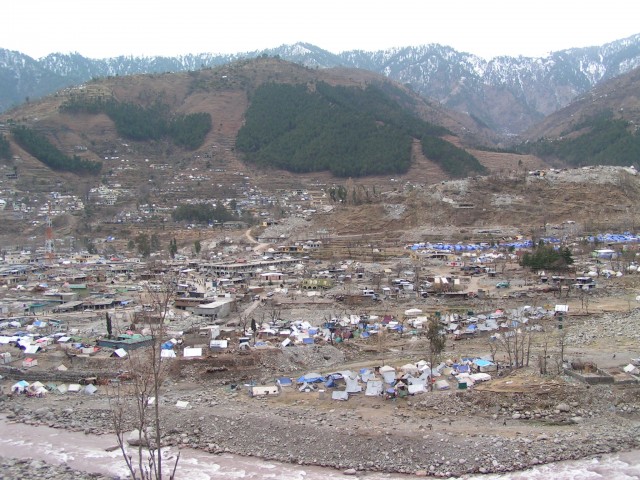
Balakot
Nhelum Valley
Reference:
Manaker, D., Calais, E., Freed, A., Ali, S., Przybylski, P., Mattioli, G., Jansma, P., Prépetit, C., & de Chabalier, J. (2008). Interseismic Plate coupling and strain partitioning in the Northeastern Caribbean Geophysical Journal International, 174 (3), 889-903 DOI: 10.1111/j.1365-246X.2008.03819.x
19 December 2011
Impacts of Tropical Storm Washi in the Philippines
The devastating impacts of Tropical Storm Washi (locally known as Sendong) in the Philippines this weekend have been widely reported. The BBC News website has a good gallery of images of the impact of this event, of which the following is the best I think:
The NDRRMC in the Philippines publishes remarkably detailed reports on the impacts of natural disasters, and the efforts to manage their aftermath. This is the best place to get realistic figures on the impact of the disaster. In terms of the number of missing people at the time of writing, this is somewhat lower than some international agencies are reporting. The statistics are however shocking – 632 killed, 16 injured and 82 people reported missing, 6917 houses damaged. At the end of the report they list the names of the victims, but what is quite worrying here is the number of unidentified bodies – for example in Lanao del Norte 227 bodies are unidentified.
Unsurprisingly, the inquest into why this event had such a large impact has already started, with “a freak storm, poor warning systems, flimsy buildings and human folly” all being blamed. All of these may well be true – it would be interesting to see some detailed aerial imagery of the areas affected, and some details about the rainfall. However, two things should be kept in mind here. The first is that this storm is really unseasonal for the Philippines – the map below shows the tracks for all of the tropical cyclones in the Western Pacific in December from 1978 to 2010 (data and map from Digital Typhoon):
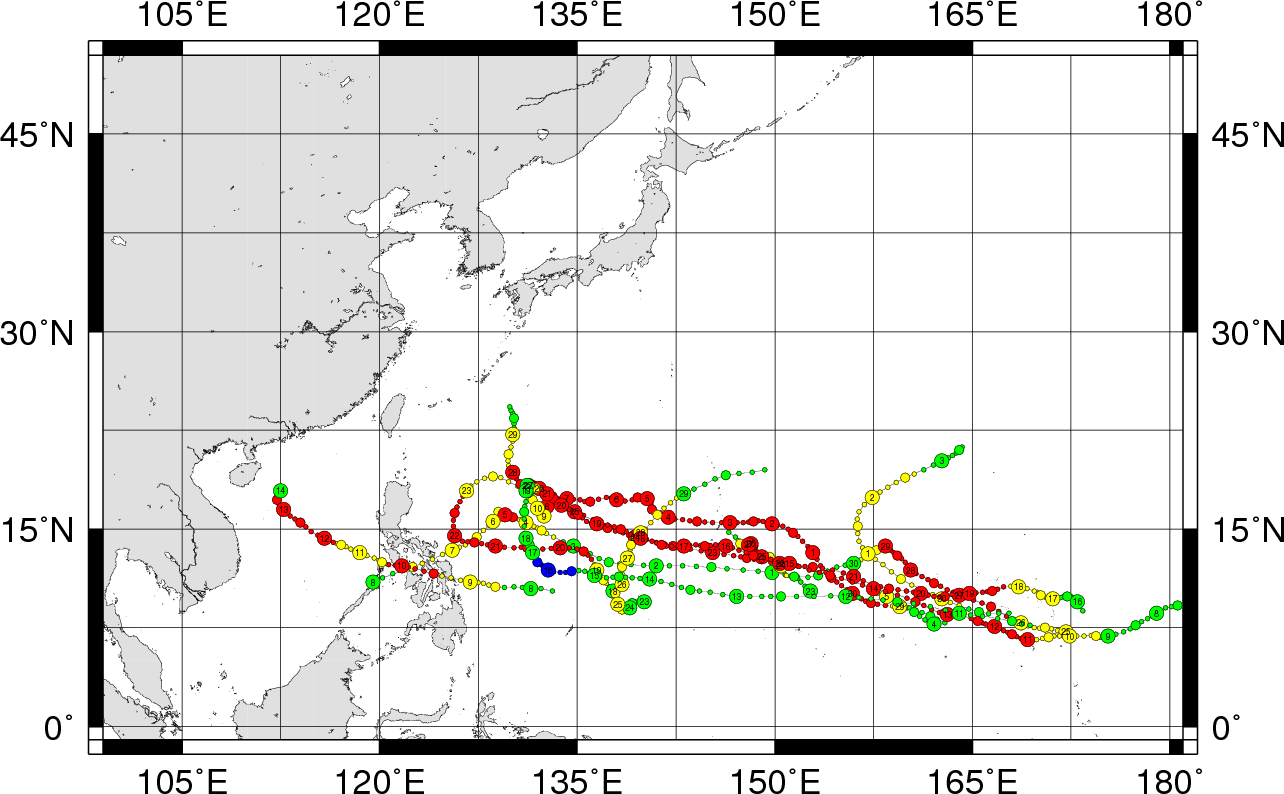
There are only 15 events in December in the entirety of this period, and only two of these made landfall. Thus, the event in itself was quite unusual. A further complicating factor may well have been that the worst of the rainfall, and hence the floods, seems to have been at night, when people are more vulnerable.
The second is that once again this highlights that our classification of tropical cyclones is not fit for purpose, as I have previously noted. The current classification of tropical cyclones is undertaken on the basis of wind parameters, but most of the damage is done by water (floods, storm surges and landslides). So all I can do is repeat my observation made earlier this year:
“So, there seems to me to be an urgent need to do two things. The first is to improve understanding of the range of impacts associated with tropical cyclones, and in particular with respect to rainfall induced disasters. Second, it really is time that we improved the Saffir-Simpson scale to encompass more than wind speed, such that the potential impacts of an impending tropical cyclone can be properly assessed. This is clearly not a trivial task, but it would seem to be an urgent research need.”
Proper classification and forecasting of this hazard is an essential first step towards reducing the consequences associated with it.
16 December 2011
A spate of landslides in Nelson, New Zealand
Apologies for the lack of posts this week – the first week back after a trip away is always busy, and this one seems to have been particularly manic. So this is a quick post about an event this week in New Zealand. Here, heavy rainfall during the week in the Nelson area of South Island triggered several landslides (thanks to Garth Williamson and Nick Dunlop, who tipped me off about this – much appreciated). There is an interesting set of images here and a more detailed news report of the aftermath here. The image below shows one of the many landslides:
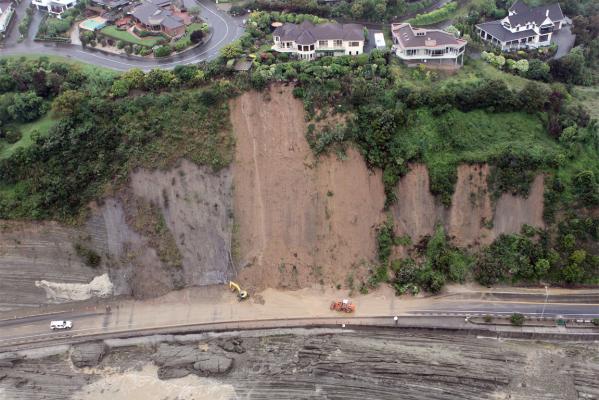
http://www.stuff.co.nz/nelson-mail/photos/6143627/Nelson-flood-gallery
This report suggests that this was the heaviest rainfall in this area for 40 years, and that 185 landslides occurred in the Nelson area alone.
14 December 2011
New landslide(s?) in Colombia – 15 people reported killed
Over the last 18 months rains in Colombia have extracted a very high toll, with widespread landslides and floods. Unfortunately, the start of the next rainy season appears to be continuing this pattern. LAHT reports that:
“At least 16 people may have been buried in three mudslides in an isolated part of the southwestern Colombian province of Nariño, an official told Efe on Tuesday. The number of missing people corresponds with reports from residents of the village of Moncayo, where the landslides occurred on Monday night, the provincial government secretary, Fabio Trujillo, told Efe by telephone.”
And Colombia Reports is stating a similar impact, although note the different area:
“Families living in three houses in La Cruz, in the Atlantico department, northern Colombia, have been buried by a landslide, Colombian media reported Tuesday. Emergency services are trying to reach the 16 people who are trapped but landslides have also blocked roads. Heavy rains are further hampering the rescue attempt. La Cruz mayor Alexander Realpe said the situation in the town remained critical, and it was not appropriate to expose rescue workers to such extreme risk. He warned the town’s Mayo River was close to overflowing, which could cause more avalanches.”
At the moment the latter report appears to be more credible, as it is backed up by a more detailed description (in Spanish) in El Tiempo, which suggests that the landslide did indeed occur at Moncayo in La Cruz, which is in the north of the country. It appears that this site had undergone a series of landslides over the last few weeks, such that many people had been evacuated. It is unclear as to whether these victims chose not to leave the site, or had returned after being evacuated.
10 December 2011
A stunning new landslide video: Paz de Río, Boyacá, Colombia
Liveleak has a new landslide (actually a debris flow) video from Paz de Río, Boyacá, Colombia. The accompanying text reports [sic]: “Habitants of the village of La Chapa, in the town of Peace River, Boyaca , Colombia captured an impressive video of the avalanche cut off leaving the area with the rest of the country.” The footage is chaotic (understandably) and should be visible below. If not, click here.
9 December 2011
Away from AGU – images of rockfalls as they occurred during the June 2011 Christchurch earthquake
As AGU 2011 draws to a close (and I still have some blog posts to write about the meeting), I need to try to catch up on a substantial backlog of landslide news. So, to start off, Monica Gowan from the University of Canterbury in Christchurch has sent these two pictures of the rockfalls as they occurred in the Sumner area of New Zealand on 13th June. Please note that she is the owner and copyright holder of the images, which I reproduce with her permission:
Copyright: Monica Gowan
Copyright Monica Gowan
If you look carefully at the images you will see several interesting things. First note the dust being generated on the cliffs as well as the cliff toe. Second, note that on the right side of the image there is also rockfall activity, as shown by the dust, out of the picture. Thirdly, on the left side there is dust being generated, probably from structural damage to the church.
The aftermath of these cliff collapses can be seen in my earlier posts here and here.
AGU days 2 and 3: some notable talks

The sharpest amongst you will have noticed that I have fallen badly behind with blogging. Unfortunately I have found myself so busy from dawn into the evening that reserving time to blog has been a struggle.
So to try to address that here are some notable talks that I have attended in the last two days:
Thorne Lay gave a really excellent keynote talk on great earthquake ruptures in the age of seismo-geodesy – an event that was perhaps slightly marred by extreme over-crowding in the room, and some slightly heavy-handed treatment by the convention centre staff of those without a seat. Thorne’s thesis was that the combination of high-resolution (both in terms of time and space) geodetic measurements and excellent seismological data is starting to allow us to really get an understanding of the nature of great (i.e. M>8 earthquakes). Nonetheless, he emphasised that every great earthquake of the last decade (and he noted that this has been a period of a high rate of large events) has generated a scientific surprise. I guess we will start to really understand earthquakes when this is no longer the case. The component that I found most interesting was a set of observations about coupled earthquakes – i.e. events where one seismic shock triggers another, sometimes with quite a different fault mechanism. Thereseem to be more of these than one might expect.
One of the first questions after the presentation was whether Thorne felt that there was a possibility of a Magnitude 9 earthquake in the Himalayas. The answer was short – yes. This is interesting in the context of this news report about work being undertaken by Roger Bilham in this region – the paper will be presented tomorrow. The message is clear about N. India and Pakistan:
…The zone likely to rupture when a quake eventually happens could be 200 kilometres wide, rather than about 80 kilometres, as was previously thought. The zone would encompass the Kashmir Valley – including the city of Srinigar, home to some 1.5 million people. If slippage occurs over a length of 300 kilometres, as is possible, a megaquake of magnitude 9 is the likely result. Given building codes and population in the region, that could mean a death toll of 300,000 people. What Bilham can’t predict from his GPS results is when such a disaster might happen.
It is interesting that Bilham is emphasising rightly the threat posed by landslides in such an earthquake:
Worse still, Bilham fears that such a major quake is likely to trigger landslides that could dam the Jhelum River, which drains from the Indian-controlled Kashmir Valley into Pakistan. That could put the Kashmir Valley under water within three months – and would also threaten disastrous flooding in Pakistan if the waters were released too quickly.
All the warning signs are there for a major catastrophe in the Himalayas at some unknown point in the future. I wonder whether we are heeding the warnings?
Later in the day it was on to a lecture by Tad Pfeffer, less well-attended (but far from empty), on delivering predictions of sea level change. He rather nicely pulled together the a range of estimates of future sea level rise associated with melting land ice (not from other sources). There are several things to note here. First that Antarctica, Greenland and alpine type glaciers are all losing ice mass quite rapidly, and that this is contributing to sea level rise. Second, he noted that whilst the last IPCC report rather hedged on this component of sea level rise, simply because the data was not good enough at that time, the picture is now much clearer due to improved science. Interestingly though, the resulting estimates ae very similar to the very first IPCC estimates from 20 years ago, which shows that actually people knew what they were doing back then. Third, he noted that planners want shorter term estimates than we normally provide as scientists, but that it is incumbent upon us to provide that data.
Tad also highlighted the really shocking imagery and videos of ice loss that have been collected by James Balog and his colleagues, which are online here. Unfortunately I cannot embed the video, but if you do nothing else today take a look at this clip – it is only a minute and is narrated by Tad. I challenge you not to be shocked by just how rapid the rate of ice loss actually is on this clip. Sadly this is being repeated in many other glaciers. In my view ice loss is the canary warning us about the magnitude of the climate change problem. I should say that at this meeting, I have not seen one presentation or one poster that suggests that anthropogenic climate change is a reality. There are about 20,000 scientists at this meeting.
Yesterday, there was another landslide session, which was mostly good. One of the invited lectures, about the SAFELAND project, was somewhat marred by the fact that neither of the two authors turned up. A colleague, Carl Fredrik Forsberg gave the presentation in their stead, and did an admirable job in the hardest of circumatnces. It was clear that he was deeply uncomfortable though, and he could not answer questions about the analysis (for obvious reasons), which makes the whole process of giving a paper a mockery. Frankly if authors are going to choose not to attend to present a prestigious invited paper then they should withdraw and allow someone else the opportunity. There was so much good stuff that was given only as a poster that this is at best deeply regrettable.
On a more positive note, I would like to highlight a couple of really interesting presentations. First Naoki Sakai presented an amazing paper on their large landslide model tests, using an artificial slope and a rainfall simulator. This was essentially an investigation of the validity of the so-called Saito effect for landslide prediction – and he could show that it worked. Amazing data were accompanied by videos of the landslides occurring. Dr Sakai is keen to collaborate on this work, and their facility is genuinely unique. Second, Brian Collins of the USGS presented an initial monitoring dataset for shallow landslides in the San Francisco bay area. This work is in an early stage but looks likely to generate an amazing dataset. Personally I’d monitor ground displacement as well hydrology and weather – they just might catch a collapse event, but that is a minor quibble.
At the end of the day yesterday I also attended a lecture by Michael Manga on the ways in which earthquakes promote changes in hydrology, even at quite large distances from the rupture. These changes include increased river discharge, increased water levels in boreholes and increased spring discharges. He argued strongly that these changes are mainly due to increased vertical permeability caused by the earthquake shaking. He then went on to look at the LUSI / Sidoarjo mud volcano in Indonesia (if you do not know about this then take a look at the Wikipedia page – it is incredible). In the Wikipedia image below, the ruined houses were all destroyed by the flow; the steam in the centre is the area of the vent, and the levees have all been built to try to hold in the erupted mud.
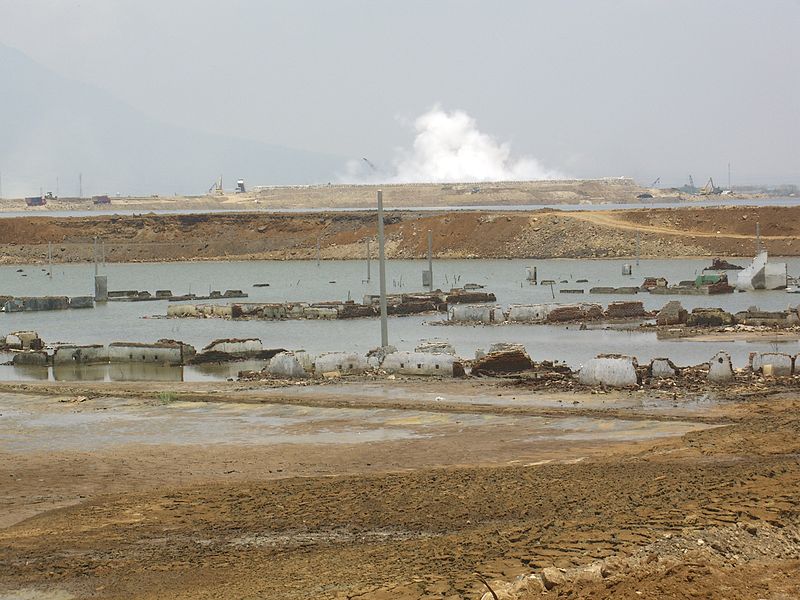
Controversy has raged about whether this was triggered by a gas well that was being drilled near to the site when the eruption started or by a moderately large earthquake about 240 km away. Manga argued strongly that the cause was the drilling, and in my view this is the most probable explanation (though that is contested by others). Interesting, he also estimated the likely duration of the eruption, and concluded that there is only a 50% chance that it will stop in 50 years!
I should add that this summary covers about 20% of the presentations that I have seen – there is just too much going on!
6 December 2011
AGU 3: Great Disasters of the 21st Century
 Yesterday (Monday) morning I also attended a session run by the Natural Hazards division on Great Disasters of the 21st Century. First up was Mark Bove from Munich Re, who talked about two different aspects of natural hazards. The first was to highlight the increasing levels of loss associated with natural disasters – in particular financial losses in the first decade of the 21st Century were equivalent to those of the 1980s and 1990s combined. Whilst he attributed this primarily to increased vulnerability, he used the Munich Re disaster catalogue to explore whether there might be an increase in occurrence of meteorological hazards as a result of an increasingly warm world. He presented two lines of evidence to support this – first, he showed that increasing occurrence of weather-driven hazards is far exceeding that of tectonic hazards. Second, he reported work they have undertaken to develop a measurement driven index of thunderstorm potential in the USA. This shows a clear increase with time, suggesting that the climate is changing. Of course this is not necessarily human induced, but in my view (and that of the mjority of scientists) this is by far the most likely cause.
Second was Chris Field, presenting a brief summary of the results of the IPCC study on climate and extreme events. As expected, he was very measured in the way that he presented the outcomes of this work. The core message was that there is evidence that extreme events are becoming more common and more extreme, and that this is likely to continue with time. The message was positive though in that he emphasised that it is possible to mitigate many hazards, and concerted effort could have a big impact, especially where it involves local actions.
Third up was Gordon McBean of the University of Western Ontario, talking about risk assessment for coastal cities. I thought that this was a disappointing presentation using less than perfect graphics, so will move on to a highly provocative presentation by Max Wyss of WAPMERR in Switzerland, who presented an extremely challenging talk on the value of the GSHAP seismic hazard map to local officials. His methodology was I suspect controversial. He looked at earthquakes that have killed more than 1000 people since the GSHAP map was produced, and compared the size of the event with the size of an event that a local government official might expect from the GSHAP dataset. The outcomes were stark – for Kashmir for example GSHAP dataset suggests an earthquake of magnitude 6.1, whereas actually it was 7.7, which represented an energy release 1000 times greater than the model implies. In terms of losses this means that GSHAP implies 3,800 fatalities against an actual number of 86,000. The author suggested that the GSHAP map underestimates every earthquake disaster in this sort of way.
I am not convinced that GSHAP is meant to be used quite like this, but the point about the difference between the ways that scientists view risk and the way that people on the ground do so is well made. It suggests we need to find much better ways to present hazard data. One can only hope that the successor to GSHAP, which is called GEM, is taking this message on board.
The room then rapidly filled (to bursting point) for a talk by Kenji Satake of the University of Tokyo on the Tohuku earthquake and tsunami. This was a fascinating review of the causes of this dreadful event. There were two startling elements to the presentation. First, he suggested that in effect the model of the earthquake cycle for this fault was wrong. The conventional earthquake cycle model suggests that stress builds until slip occurs, generating an earthquake. Stress then builds again until the next event. Satake suggested that in fact there may be two cycles occurring simultaneously on this fault, with the longer cycle generating very large events about every 700 years. If true, this would have major implications for seismic hazard on other major fault systems.
Second, he showed that the tsunami had two distinct elements – a initial slow rise of water level, and a sudden, very rapid pulse. That was I think caught by this amazing video of the tsunami, which shows a slow rise for about 8 minutes and then the very rapid increase:
http://www.youtube.com/watch?v=a-iRFUUkcIU
The explanation for this is that the tsunami was in effect generated by two slip types on the same fault – a shallow slip event and a deep slip event, which generated the two wave patterns. In effect this earthquake was a composite of two known earlier tsunami generating earthquake events – the 869 AD Jogan earthquake, which is thought to have resulted from slip deep on the fault, and the 1896 M=7.2 earthquake , which generated a big tsunami due to large amounts of shallow slip. In both cases there is geological evidence of the earlier tsunami events.
The final talk was Satoko Oki of the University of Tokyo, who presented on changed perceptions of risk in tsunami prone areas. The conclusions were deeply uncomfortable, suggesting that the perception of risk from smaller tsunamis has decreased in the aftermath of this very large event. Put another way, people are less likely to evacuate for a small event now, even though such an event still presents a very real risk. This serves to show just how complex our understanding and perception of risk is, and just how hard it is going to be to continue to reduce disaster impacts.
 Dave Petley is the Vice-Chancellor of the University of Hull in the United Kingdom. His blog provides commentary and analysis of landslide events occurring worldwide, including the landslides themselves, latest research, and conferences and meetings.
Recent Comments