9 November 2015
Big news on the Tonzang landslide in Burma – probably the largest non-seismic landslide for a decade?
Posted by Dave Petley
The Tonzang landslide in Burma
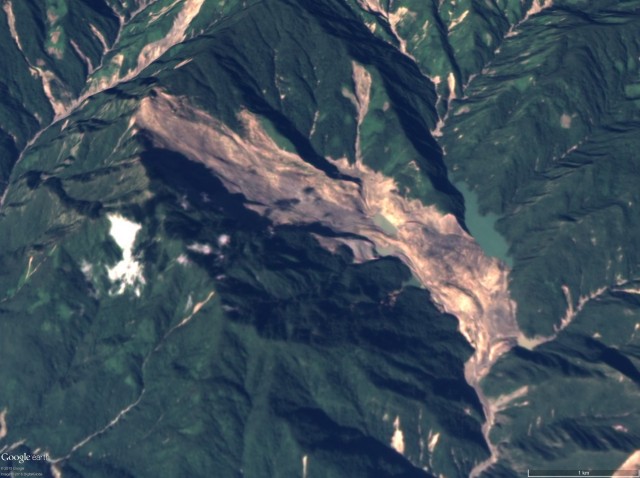
On 29th October I posted about the Tonzang landslide cluster in Burma, which was triggered by exceptional rainfall at the end of July / early part of August this year. There seems to have been at least three exceptional landslides, of which the largest, which I am calling the Tonzang landslide, is very large indeed. This is a NASA satellite image, compiled by Colin Stark, of the landslide:

s
The Tonzang landslide, from the NASA EO-1 image. Courtesy of NASA and Colin Stark.
This landslide is 5.9 km from crown to the toe of the deposit. Colin and Goran Ekstrom have gone back to the seismic data and have now found the signal that this landslide generated, which they have then inverted to generate the statistics (see my post about their paper in Science on this for further details). And the results are amazing – the data indicate that the landslide had a mass of 395 million tonnes, which, assuming a density of 2.5 tonnes per cubic metre, yields a volume of about 160 million cubic metres. I believe that this is the largest non-seismic landslide since the 2004 Mount Bawakaraeng landslide in Indonesia (can anyone think of a larger non-seismic landslide in the interim?). By contrast the enormous Bingham Canyon landslide was 65-70 million cubic metres, less than half as large, for example.
Other statistics from the inversion, courtesy of Colin and Goran:
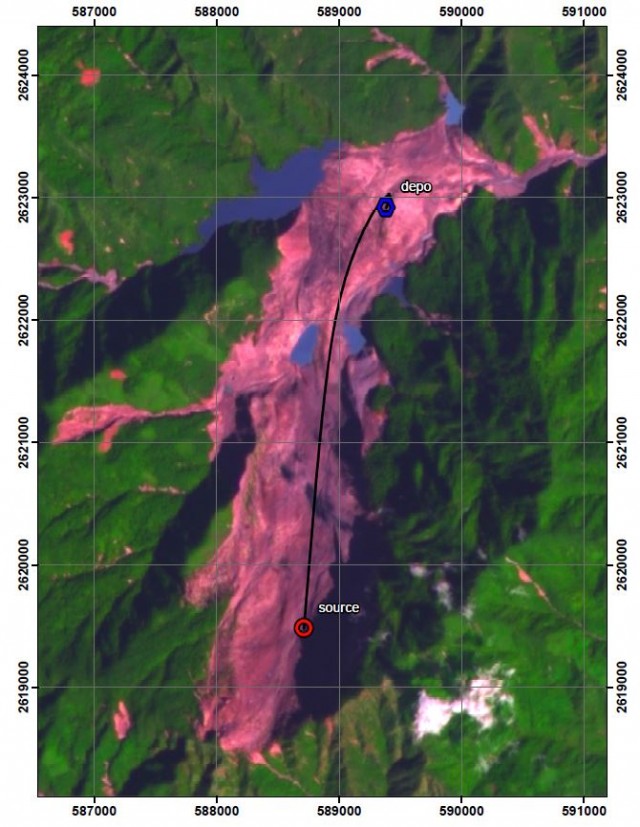
- Mass displacement (source to deposit): ~3.5 km (see the image below)
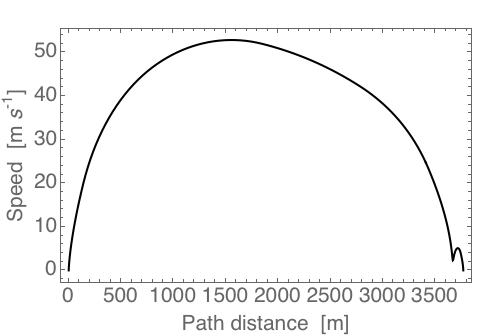
- Main runout duration: ~160 seconds
- Maximum acceleration: ~2m/s^2
- Maximum speed: ~ 50 m/s
This is the mass displacement record from the seismic inversion, overlain onto a NASA EO-1 image of the Tonzang landslide:
.
This is the velocity profile of the Tonzang landslide:
.
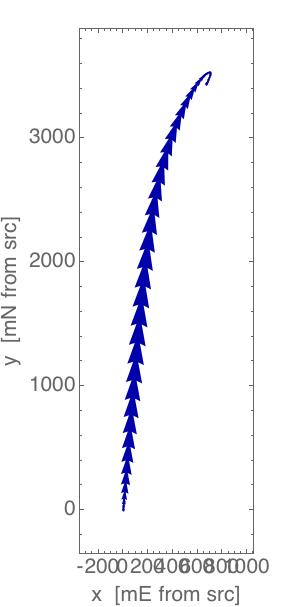
And this is the velocity – trajectory plot:
.
This is a truly exceptional event, quite remarkable in many ways. There really is an urgent need for someone to go to do some fieldwork to take a look at the Tonzang landslide, it is such a golden opportunity to learn more about very large rock avalanches.
Acknowledgements
To be able to break the news of the largest non-seismic landslide for a decade is an honour. Thanks to Colin Stark and Goran Ekstrom for providing the data and the analyses, and to Stuart Frye and Jesse Allen of NASA for providing the imagery.


 Dave Petley is the Vice-Chancellor of the University of Hull in the United Kingdom. His blog provides commentary and analysis of landslide events occurring worldwide, including the landslides themselves, latest research, and conferences and meetings.
What does the “fish hook” on the end of the Velocity/Trajectory plot signify?
run-up and “slide-back” from a topographic “ramp” in the deposition zone?