
8 May 2017
The Mocoa landslides: new satellite images
The Mocoa landslides: new satellite images
ReliefWeb has posted online a set of satellite images showing the Mocoa landslides of 1st April 2017 in Colombia. These images were collected by the RapidEye system and made available via Planet Labs Germany GmbH and DLR-RESA. The set consist of an image before the disaster, taken on 21st November 2013:
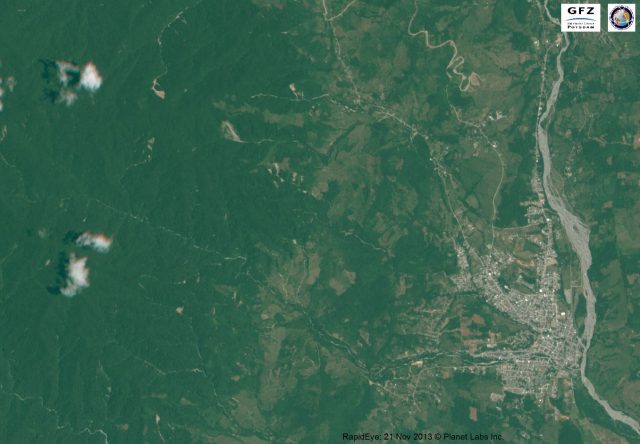
Before image of the area affected by the Mocoa landslides, via GFZ Potsdam and Planet Labs
.
An image showing the aftermath, collected on 10th April 2017:
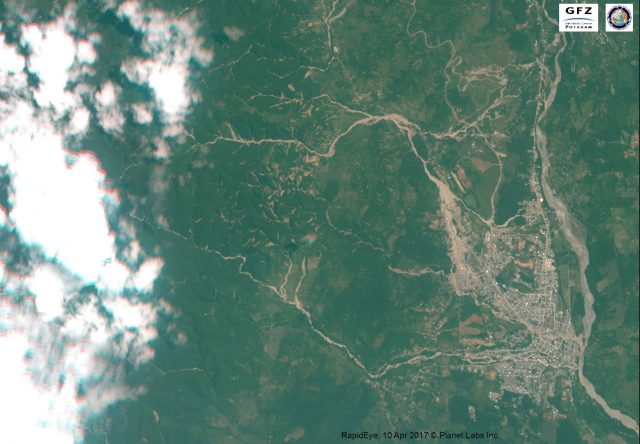
Image showing the aftermath of the Mocoa landslides, via GFZ Potsdam and Planet Labs
.
And an interpretative map that highlights the areas affected by the landslides and debris flows:
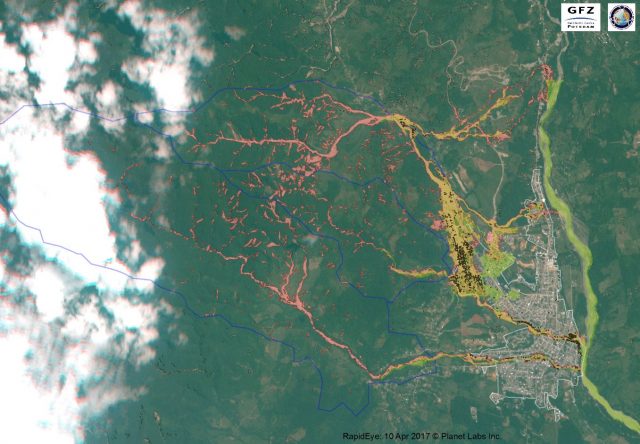
Interpretative map of the area affected by the Mocoa landslides, via GFZ Potsdam and Planet Labs
.
This work was undertaken by Dr Robert Behling in the Remote Sensing section of GFZ Potsdam. The maps are very interesting. The ReliefWeb article notes that the map depicts over 600 landslides and debris flows. These are widely dispersed across the landscape in a pattern that is commonly associated with a an extreme rainfall event. These landslides have then sent debris into the channels, where they have combined to generate a large volume, which has then entrained debris from within the channels to provide the enormous debris flows that struck the town. The vulnerability of the buildings in the channel of the Quebrada Tarnquita is very clear, and of course this is where the majority of the losses occurred.
Wikipedia now has a good article about the landslides, noting that about 130 mm of rainfall fell during the disaster, which killed 314 people and left a further 106 missing. In total about 45,000 people were reported to have been affected. Incidentally, this analysis also suggests that the interpretation of the Sentinel image of the Mocoa area, which was released in the immediate aftermath of the disaster, was not correct.
5 May 2017
The Van Zandt landslide: another great example of landslide mapping using LIDAR
LIDAR: another great example of landslide mapping in difficult terrain
I recently came across another great example of the use of LIDAR for mapping landslides in difficult terrain. The Washington Geological Survey has a wonderful mapping tool online that gives the user the ability to look at a range of geological data. The Bellingham Herald has a nice article about the LIDAR dataset, which can be accessed through the portal, in which they highlight the example of the Van Zandt landslide on the Nooksack River. This landslide is located at 48.803, -122.151 if you want to take a look on Google Earth. Imagery of the location suggests that there might be a landslide here – below is a Google Earth perspective of the site showing a huge scoop out of the ridge and a river that may have been pushed over to the opposite side of the valley. However, the area between the ridge is densely forested in places, with vegetation of various types covering almost all of the landscape. It is extremely difficult to map a landslide deposit in these circumstances:
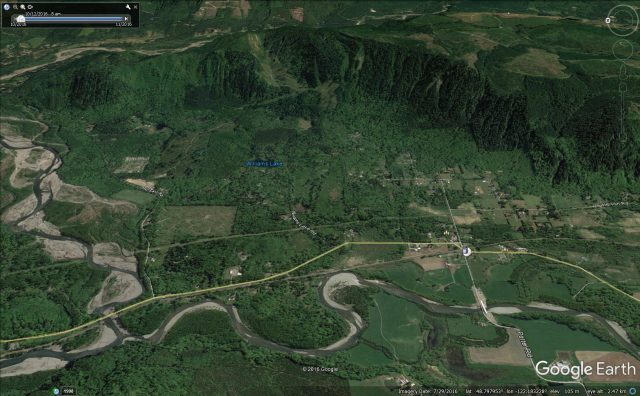
Google Earth image of the site if the Van Zandt landslide on the Nooksack River. Whilst the scoop out of the hillside might indicate a landslide here, the deposit cannot be mapped.
.
A topographic map of the area does not help much. The possible landslide scar can be seen, but the data does not provide the resolution to understand what might sit on the valley floor:
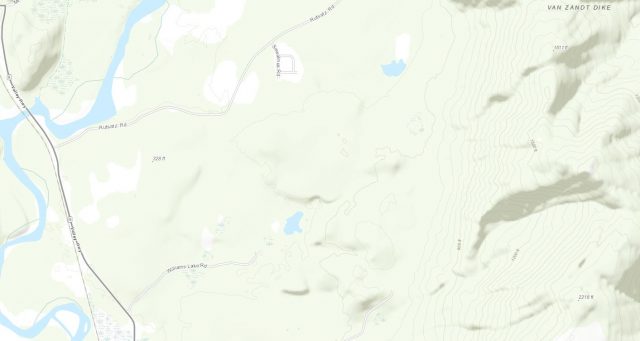
Shaded relief topographic map of the Van Zandt landslide on the Nooksack River, via the Washington Geological Survey
.
Unprocessed LIDAR data does not seem to add much to the interpretation. Each individual tree can be seen, and the area of stripped vegetation suggests very hummocky terrain (often a hint that an old landslide is present), but it would be impossible to map a landslide from this:
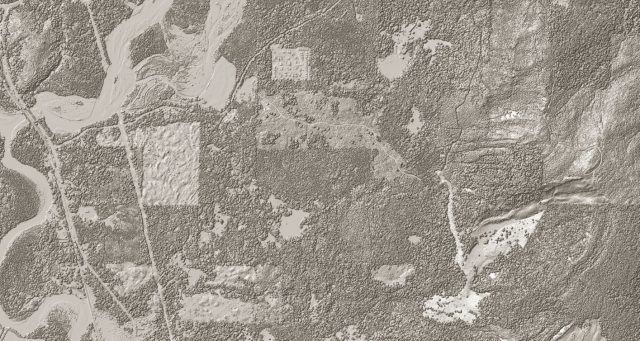
Raw LIDAR data of the site of the Van Zandt landslide on the Nooksack River in Washington State, via the Washington Geological Survey
.
But a LIDAR system fires many pulses of laser energy at the ground in the process of mapping. Even in a forested area a few of these make it through the vegetation canopy to strike the ground before being reflected back to the instrument. Whilst the proportion of laser pulses that make this journey is small, the high density of pulses sent by the laser means that these can be used to map the underlying terrain. So the pulses that have reflected off the tree canopy are removed through processing, leaving just those that reached the ground. These are then combined to produce a bare earth LIDAR hillshade. The spatial resolution of this is less good, but the ability to capture the underlying relief is amazing. Here is the bare earth hillshade for the Van Zandt landslide:
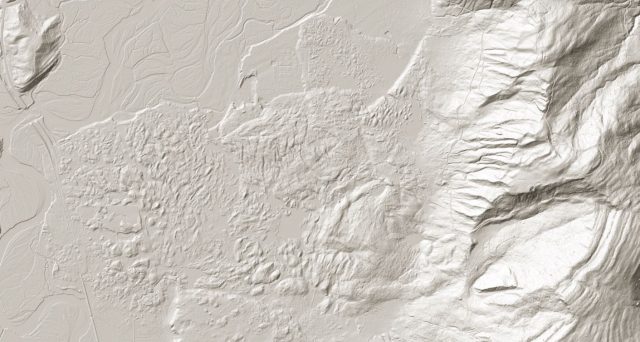
Bare Earth LIDAR imagery of the landslide on the Nooksack River, via the Washington Geological Survey
.
And suddenly the hummocky topography of the landslide deposit is plain to see, and is easily mapped. And what becomes evident from this is that this was another highly mobile landslide with a long runout. Interestingly, a back of the envelope calculation suggests that the H/L ratio for this landslide is about 0.132, close to the supposedly extraordinary mobility value of 0.105 for the Oso landslide.
Close examination suggests that there is real complexity in this deposit – is that another smaller but still highly mobile landslide deposit at the top of the image for example? And if so, from where did it originate? Detailed analysis of the Lidar imagery could reveal a great deal. But the example demonstrates once again the amazing ability that LIDAR provides to map landslides in difficult terrain.
Dan McShane has a short article on the Van Zandt landslide on his excellent blog. This thesis proposal also provides some detail.
4 May 2017
Community Slope SAFE: vote for a low cost landslide warning system
Community Slope SAFE
Community Slope SAFE is a landslide early warning system that has been under development for some years by Professor Neil Dixon and colleagues at Loughborough University. I have covered this work before – in essence it uses technology to listen to acoustic emissions generated when a landslide moves, and then uses electronics to process that information to provide a warning. Of course that very simple description hides a great deal of complexity – how to collect the signal and not background noise, and how to interpret that signal as indicating that the slope is on the move, for example. One aspect of this work has been the development of a low cost system designed to be used in vulnerable communities in less affluent countries, called Community Slope SAFE. The team have just installed their first system in Malaysia, working with an NGO FHI 360 and various other partners.
There is a youtube video online highlighting the strengths of this system, which shows great promise. As the spate of recent landslides in for example Kyrgyzstan shows, there is a real need to develop techniques that can protect communities when neither relocation nor mitigation are an option.
.
The project also has a detailed website that provides details of how it operates and of the potential applications of the system. This image, from the site, shows an installed Slope Alarms system:
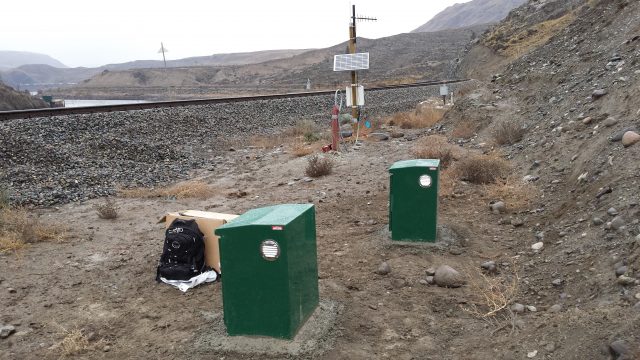
An installed Slope Alarms system, via the Slope Alarms website
.
The project has been submitted for an Enterprise Award at Loughborough University. The outcome will be decided by a public vote – you can vote on the right hand side of this page. In my view it would be terrific to see a landslide project win this award. Developing systems that effectively protect communities against landslides in poor countries is a holy grail of landslide work. This system shows real promise.
3 May 2017
Kurbu-Tash and Ayu: the location of the two large landslides in Kyrgyzstan this weekend
The Kurbu-Tash landslide
Yesterday I highlighted a huge landslide that occurred in Kyrgyzstan on Sunday. KABAR has a report today that provides details of its location, which is the village of Kurbu-Tash in Uzgen Region. Google Earth has good quality imagery of this area, which reveals why this area was prone to such an event:
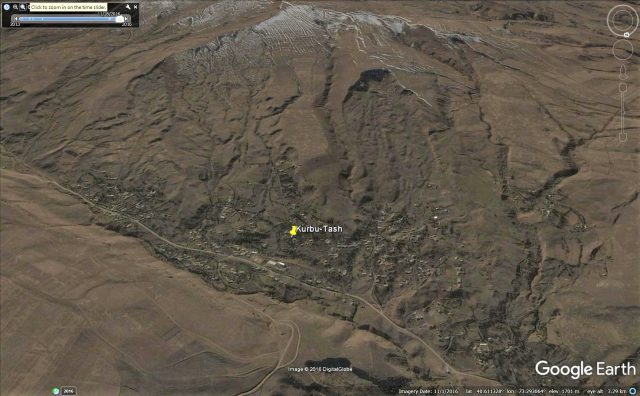
Google Earth image of the site of the Kurbu-Tash landslide in Kyrgyzstan
.
From this perspective, to the right of the village of Kurbu-Tash there is a huge landslide scar extending two thirds of the way up the slope. Interestingly very little of the deposit from this landslide is evident on the imagery, suggesting that the debris has vacated the slope. This may imply a high mobility slide. To the left of the village is another landslide scar, which is much larger but possibly more degraded. The landslide on Sunday, shown below (image from KABAR) appears to have come from the left side of this area:-
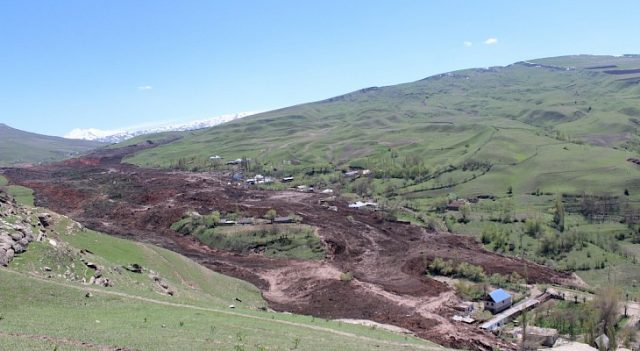
The Kurbu-Tash landslide in Kyrgyzstan. Image from KABAR
.
The location of the Ayu landslide
Meanwhile, Elena Nikolaeva kindly contacted me to point out the location of the Ayu landslide, which killed 24 people in Kyrgyzstan on Saturday morning. This appears to be the area shown below, but sadly the image quality of Google Earth is too low to pinpoint it precisely:-
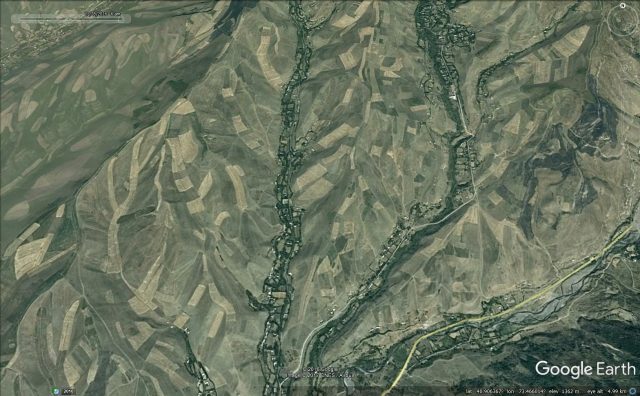
Google Earth imagery of the location of the Ayu landslide in Kyrgyzstan
.
This is an area that appears to be quite intensively farmed, but it is unclear as to whether this might have been a factor in the tragedy.
The government response to these landslide disasters
KABAR also reports that the President of Kyrgyzstan has ordered a long term response to the tragedy:
He noted that the causes and consequences of the disaster indicate that the emergency department needs to strengthen preventive measures, and local authorities to review methods of resettlement of people living in potentially dangerous areas in order to ensure their safety and avoid the severe consequences of natural disasters.
This is undeniably sensible, but requires a committed, scientifically-based hazard and risk analysis. That is not a trivial task.
2 May 2017
Ayu in Osh, Kyrgyzstan: a large landslide has killed 24 people, and another large flowslide in Uzgen region
Ayu in Osh, Kyrgyzstan: a large landslide has killed 24 people
At 7 am local time in Ayu in the Osh region of Kyrgyzstan a large landslide swept away and buried 11 houses, killing 24 people. The best image of the landslide is available on the KABAR website:
The large landslide at Ayu in Osh, which killed 24 people on Saturday. Via KABAR
.
Once again this looks to be a large, deep-seated landslide in loess. Interesting the main scarp appears to be predominantly translational, but with an unusually deep shear surface. KABAR also has a decent image of the deposit:
The deposit of the Ayu landslide in Osh, Kyrgyzstan. Via KABAR
.
This image suggests that this landslide may have been less mobile than many others that we have seen in Kyrgyzstan of late. The trigger for this landslide was apparently heavy rainfall. Reuters reports that the local people had been warned of the risks of landslide at this location.
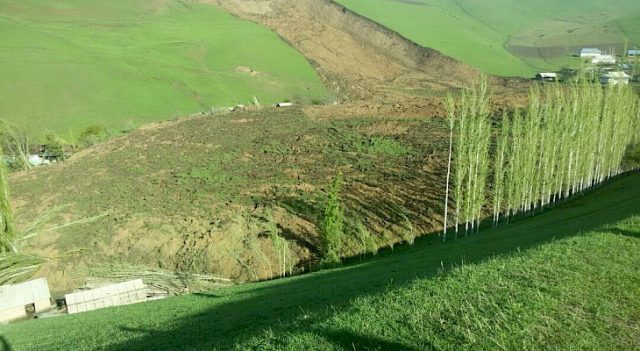
A massive flowslide in the Uzgen region on Sunday
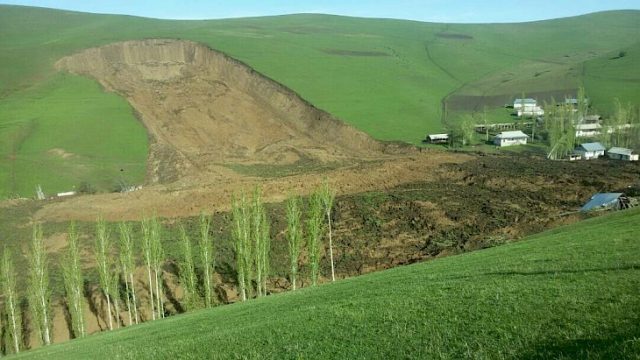
Meanwhile an even more impressive, though fortunately less deadly, landslide occurred in the Uzgen region of Kyrgyzstan on Sunday, according to KABAR. Details are sketchy at present – 11 houses were apparently buried, together with a school, a kindergarden, a mosque and a medical facility – but with no human losses. The images are impressive:
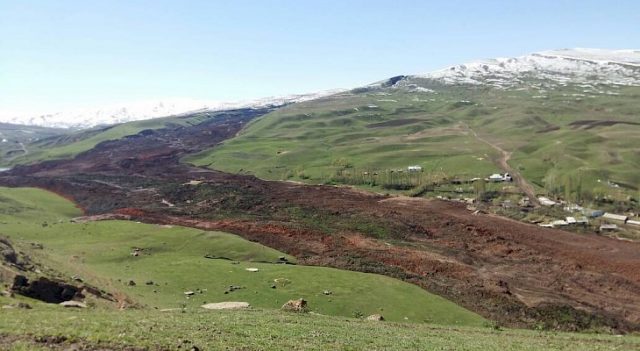
The huge flowslide in Uzgen region of Kyrgyzstan on Sunday, via KABAR
.
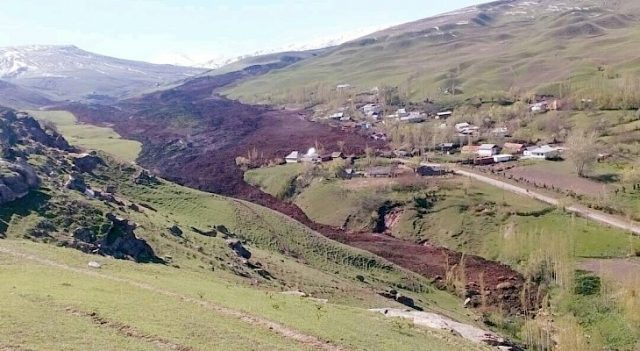
The huge flowslide in Uzgen Region of Kyrgyzstan on Sunday, via KABAR.
.
This appears to be a very large and very mobile landslide, but with a peculiar flow path. Again, the trigger is not described – it would be interesting to see the headscarp area,
Kyrgyzstan appears to be suffering a spate of large landslides this year; the reasons are unclear. They beautifully illustrate the role of material properties in defining the behaviour of the landslide. In the case of these slides in Kyrgyzstan, the presence of loess leads to these repeated flowslide events that show high mobility, with resultant heavy losses.
30 April 2017
Highway 101, Vietnam, Turkey and others: a selection of new landslide videos
Highway 101, Vietnam and others: a selection of new landslide videos
In the last two weeks a range of landslide videos have appeared on Youtube, including examples from Highway 101, Vietnam, India and Turkey. This is a summary:
A rockslide on Highway 101 in California
I think it’s fair to say that this one developed a little faster than the Caltrans workers had expected:
.
A rather beautiful snow and soil avalanche from the Kackar Mountains
This one occurred in Turkey on 23rd April:
.
And a similar event (perhaps with less rock and soil) in Canada
A rockslide at Drabshala on Nathional Highway 244 in northern India, between Kishtwar and Batote
.
A small landslide toppling a house in Aizawl, northern India
This property is built on an incredibly steep slope:
.
A major riverbank collapse on the Nam Vao River in Vietnam
.
28 April 2017
The Oso landslide: a new paper on the material properties and failure mechanism
The Oso landslide: a new paper in the material properties and failure mechanism
There continues to be considerable discussion in the literature about the mechanisms and processes that led to the dreadful Oso landslide of 22nd March 2014, which killed 43 people. The debate has raged on the sequence of events that led to the landslide, and on the processes that controlled both the initial failure and long runout. This issue is revisited in a paper just published in the the Journal of Geotechnical and Geoenvironmental Engineering (Stark et al. 2017). In my view this study provides clarification on the likely sequence of events, and in particular shows that some of the previous ideas do not fit with observations.
Stark et al. (2017) propose a two phase mechanism, in common with some others. However, they also propose that most of the damage was caused by a complex first phase of movement in which an initial slip on a compound (i.e. non-circular) surface impacted upon colluvium deposits further down the slope. These deposits underwent liquefaction, and flowed across the valley to create the huge damage, and loss of life. The colluvium behaved as a classic flowslide. The main elements of this are shown in my sketch below:
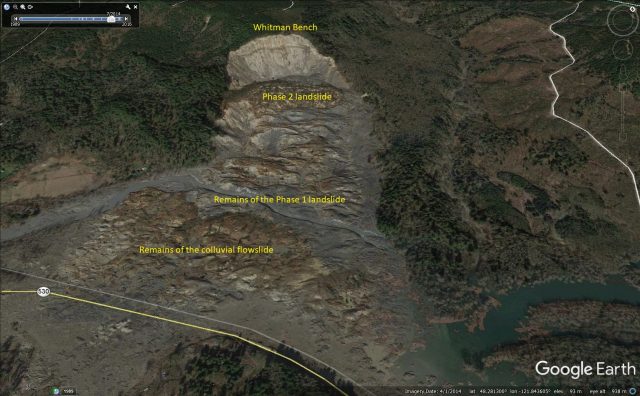
Google Earth image showing the main elements of the Oso landslide
.
This was followed by a second failure, also shown in the schematic diagram, that results in the morphology that we see at the site today. This was compound shear surface landslide from the so-called Whitman Bench, consisting of unsaturated sands, glacial till and clays, which show a much higher level of friction, meaning that this slide was much less mobile than the first phase. The cause of this second landslide was debuttressing by the phase one slide. I have made a quick sketch of this sequence below:-
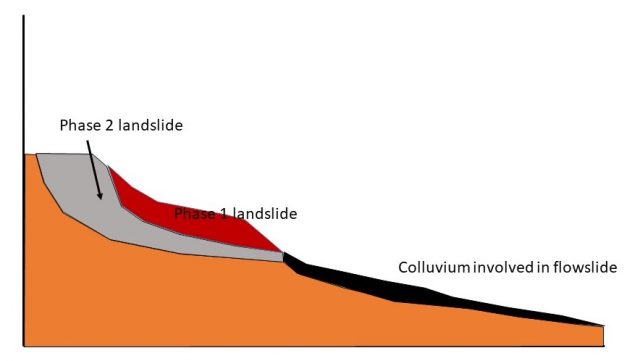
A sketch of the Stark et al. (2017) sequence of events at the Oso landslide
This explanation is, in my view, consistent with the available evidence, including the morphology of the site, the eye witness descriptions of what happened, the seismic data and the properties of the materials. Other explanations, such as those that propose an initial failure in the lower portion of the slope, do not seem to be consistent with the evidence.
In essence this is a more conventional explanation for the landslide than some of those that have gone before. It is reassuring that the slide behaviour fits with that observed from elsewhere.
Reference
Stark, T.D., Baghdady, A.K., Hungr, O. and Aaron, J. 2017. Case Study: Oso, Washington, Landslide of March 22, 2014—Material Properties and Failure Mechanism. Journal of Geotechnical and Geoenvironmental Engineering, 143 (5).
25 April 2017
The 2015 Gorkha earthquake in Nepal: two years on
The 2015 Gorkha earthquake in Nepal: two years on
Today is the second anniversary of the 2015 Gorkha earthquake in Nepal, which killed almost 9000 people and set back the development of the country significantly. Kunda Dixit has written a nice piece in the Nepali Times about the disaster. He concludes that:
And speaking of funds, Nepal has actually received less than a third of the $9.38 billion the NRA estimated it needed to rebuild homes, public buildings and infrastructure. Of the $4.1 billion pledged by donors in 2015, only $2.73 billion has actually materialised (most of it in loans). This is not even enough for the housing grant of Rs 300,000 per family, which itself is inadequate to rebuild. The National Reconstruction Authority has come up with a new affordable design, but there seems little interest.
The main takeaway on the second anniversary is: International help has fallen far short of pledges and is much less than the amount actually needed, a lot of it is not going through the National Reconstruction Authority, and (as in other spheres of development) the government has failed in coordination.
This is of course a depressing story; one can only imagine what would have happened had the earthquake fulfilled its potential in terms of damage and loss. Worst is yet to come in a future earthquake; we know not when. There is an urgent need to prepare.
Of course one of the most significant impacts of the earthquake was the landsliding, especially in the north of the area of the fault rupture zone. I have highlighted previously that the number of landslides was far lower than we had anticipated might be the case. This is investigated by a paper recently published in the Journal of Earth Science by Xu et al. (2016). This paper, which is open access, compares the landslide distributions of the 2008 Wenchuan earthquake and the 2015 Gorkha earthquake. Although similar in size, the landslide impact was vastly different. For example, Xu et al. (2016) note that the 2008 Wenchuan earthquake generated 25,580 large landslides over an area of 44,000 square kilometres, whereas the 2015 Gorkha earthquake generated 2,064 large landslides over an area 35,600 square kilometres. That is an order of magnitude difference. This is illustrated beautifully by the landslide inventory maps for the two events:
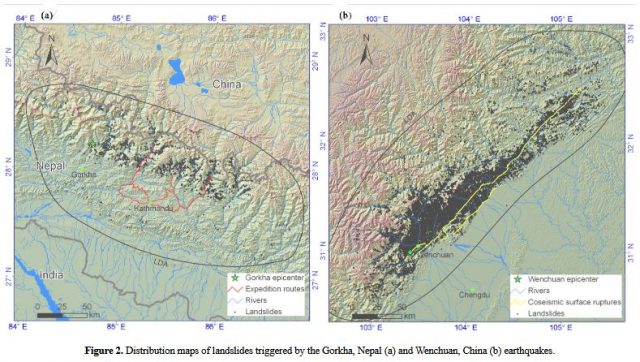
Inventory maps for the Gorkha and Wenchuan earthquakes, from Xu et al. (2016)
.
Most interestingly, Xu et al. (2016) try to understand the difference, and in particular why the 2015 Gorkha earthqake appears to have been relatively inefficient in generating landslides. Interestingly, they find that the key issue was not topography nor peak ground acceleration – in both cases the Wenchuan earthquake generated far more landslides than did the Gorkha earthquake for any given slope angle or peak ground acceleration value. Xu et al. (2016) note that:
The landslide numbers and density related to the Wenchuan Earthquake are much higher than those of the Gorkha Earthquake in any combinations of slope angle and PGA. Both slope steepness and PGA cannot explain the low number of Gorkha earthquake-triggered landslides.
They ascribe the difference to the angle of the fault that generated the earthquake. In the case of the 2015 Gorkha earthquake, the fault dips at about 10 degrees, whereas for the 2008 Wenchuan earthquake it dips at about 40 degrees. Xu et al. (2016) suggest that this is important because it causes a different level of deformation in the hanging wall block, and because it causes a different pattern of peak ground acceleration. In particular, as they put it:
Because the Wenchuan Earthquake occurred along a high-angle reverse fault, the area of the surface directly overlying the fault surface was relatively small, concentrating the surface energy and resulting in many large, intense landslides. In contrast, the Gorkha Earthquake occurred along a low-angle fault, so the overlying surface area was wide, the surface energy less concentrated, and fewer smaller landslides were triggered. In short, we suggest that that these two effects determine the capability of an earthquake to trigger landslides because the dip angle of the seismogenic fault controls the manner of earthquake energy release, and thus influences the deformation of the hanging wall bedrock.
I think this conclusion is of vital importance if we are to understand the potential distribution of landslides from future earthquakes. It will be fascinating to see how the landslide distribution maps out for the 2016 Kaikoura earthquake in this context.
Reference
Xu, C., Xu, X., Tian, Y. et al. 2016. Two comparable earthquakes produced greatly different coseismic landslides: The 2015 Gorkha, Nepal and 2008 Wenchuan, China events Journal of Earth Science 27: 1008-1015.
24 April 2017
The Wellington earthquake landslide problem
The Wellington earthquake landslide problem
The Wellington earthquake landslide problem was the front page story in one of the local papers 10 days ago. The article is online. The crux of the piece is summarised in the first few sentences:
“Up to 10,000 Wellington homes could be damaged by landslides if a major earthquake strikes close to the city. But while landslides may pose the greatest threat to those living in the capital when the big one hits, it could be years before residents know which slopes across the city pose the highest risk.”
The article also highlights a study being undertaken by GNS Science to try to understand the risks associated with the Wellington earthquake landslide problem:
GNS engineering geologist Sally Dellow said earthquake-induced landslides were usually bigger than those caused by rain. A research project was already under way looking at modified slopes in the Wellington region, she said. Homeowners could expect slopes around them to be evaluated, but it would take extra funding of about $5 million for the work to be completed in four years. “GNS Science has been working on this problem for many years, but only recently has the work started to be funded to the level required to deliver the detail needed to give information that can be acted upon.”
A part of the issue here is that the Wellington Fault runs at the foot of a series of steep slopes very close to the city centre. The Leapfrog blog has a rather lovely image that captures this efature well:
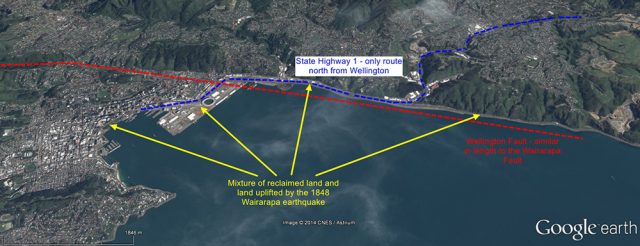
The Wellington fault from the Leapfrog blog
.
As the image above shows, there are many houses built on the slopes around the city. I snapped a couple of pictures before I left on Saturday:
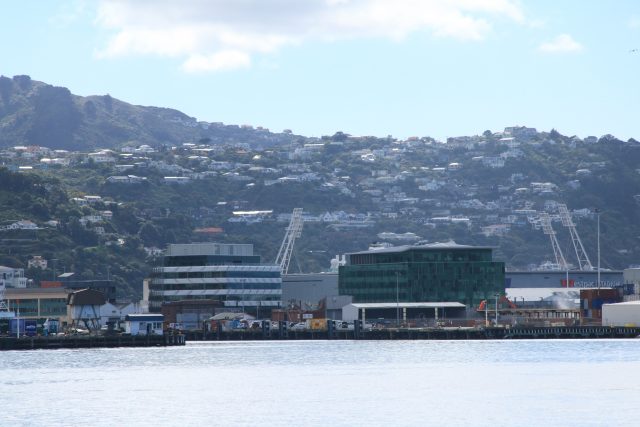
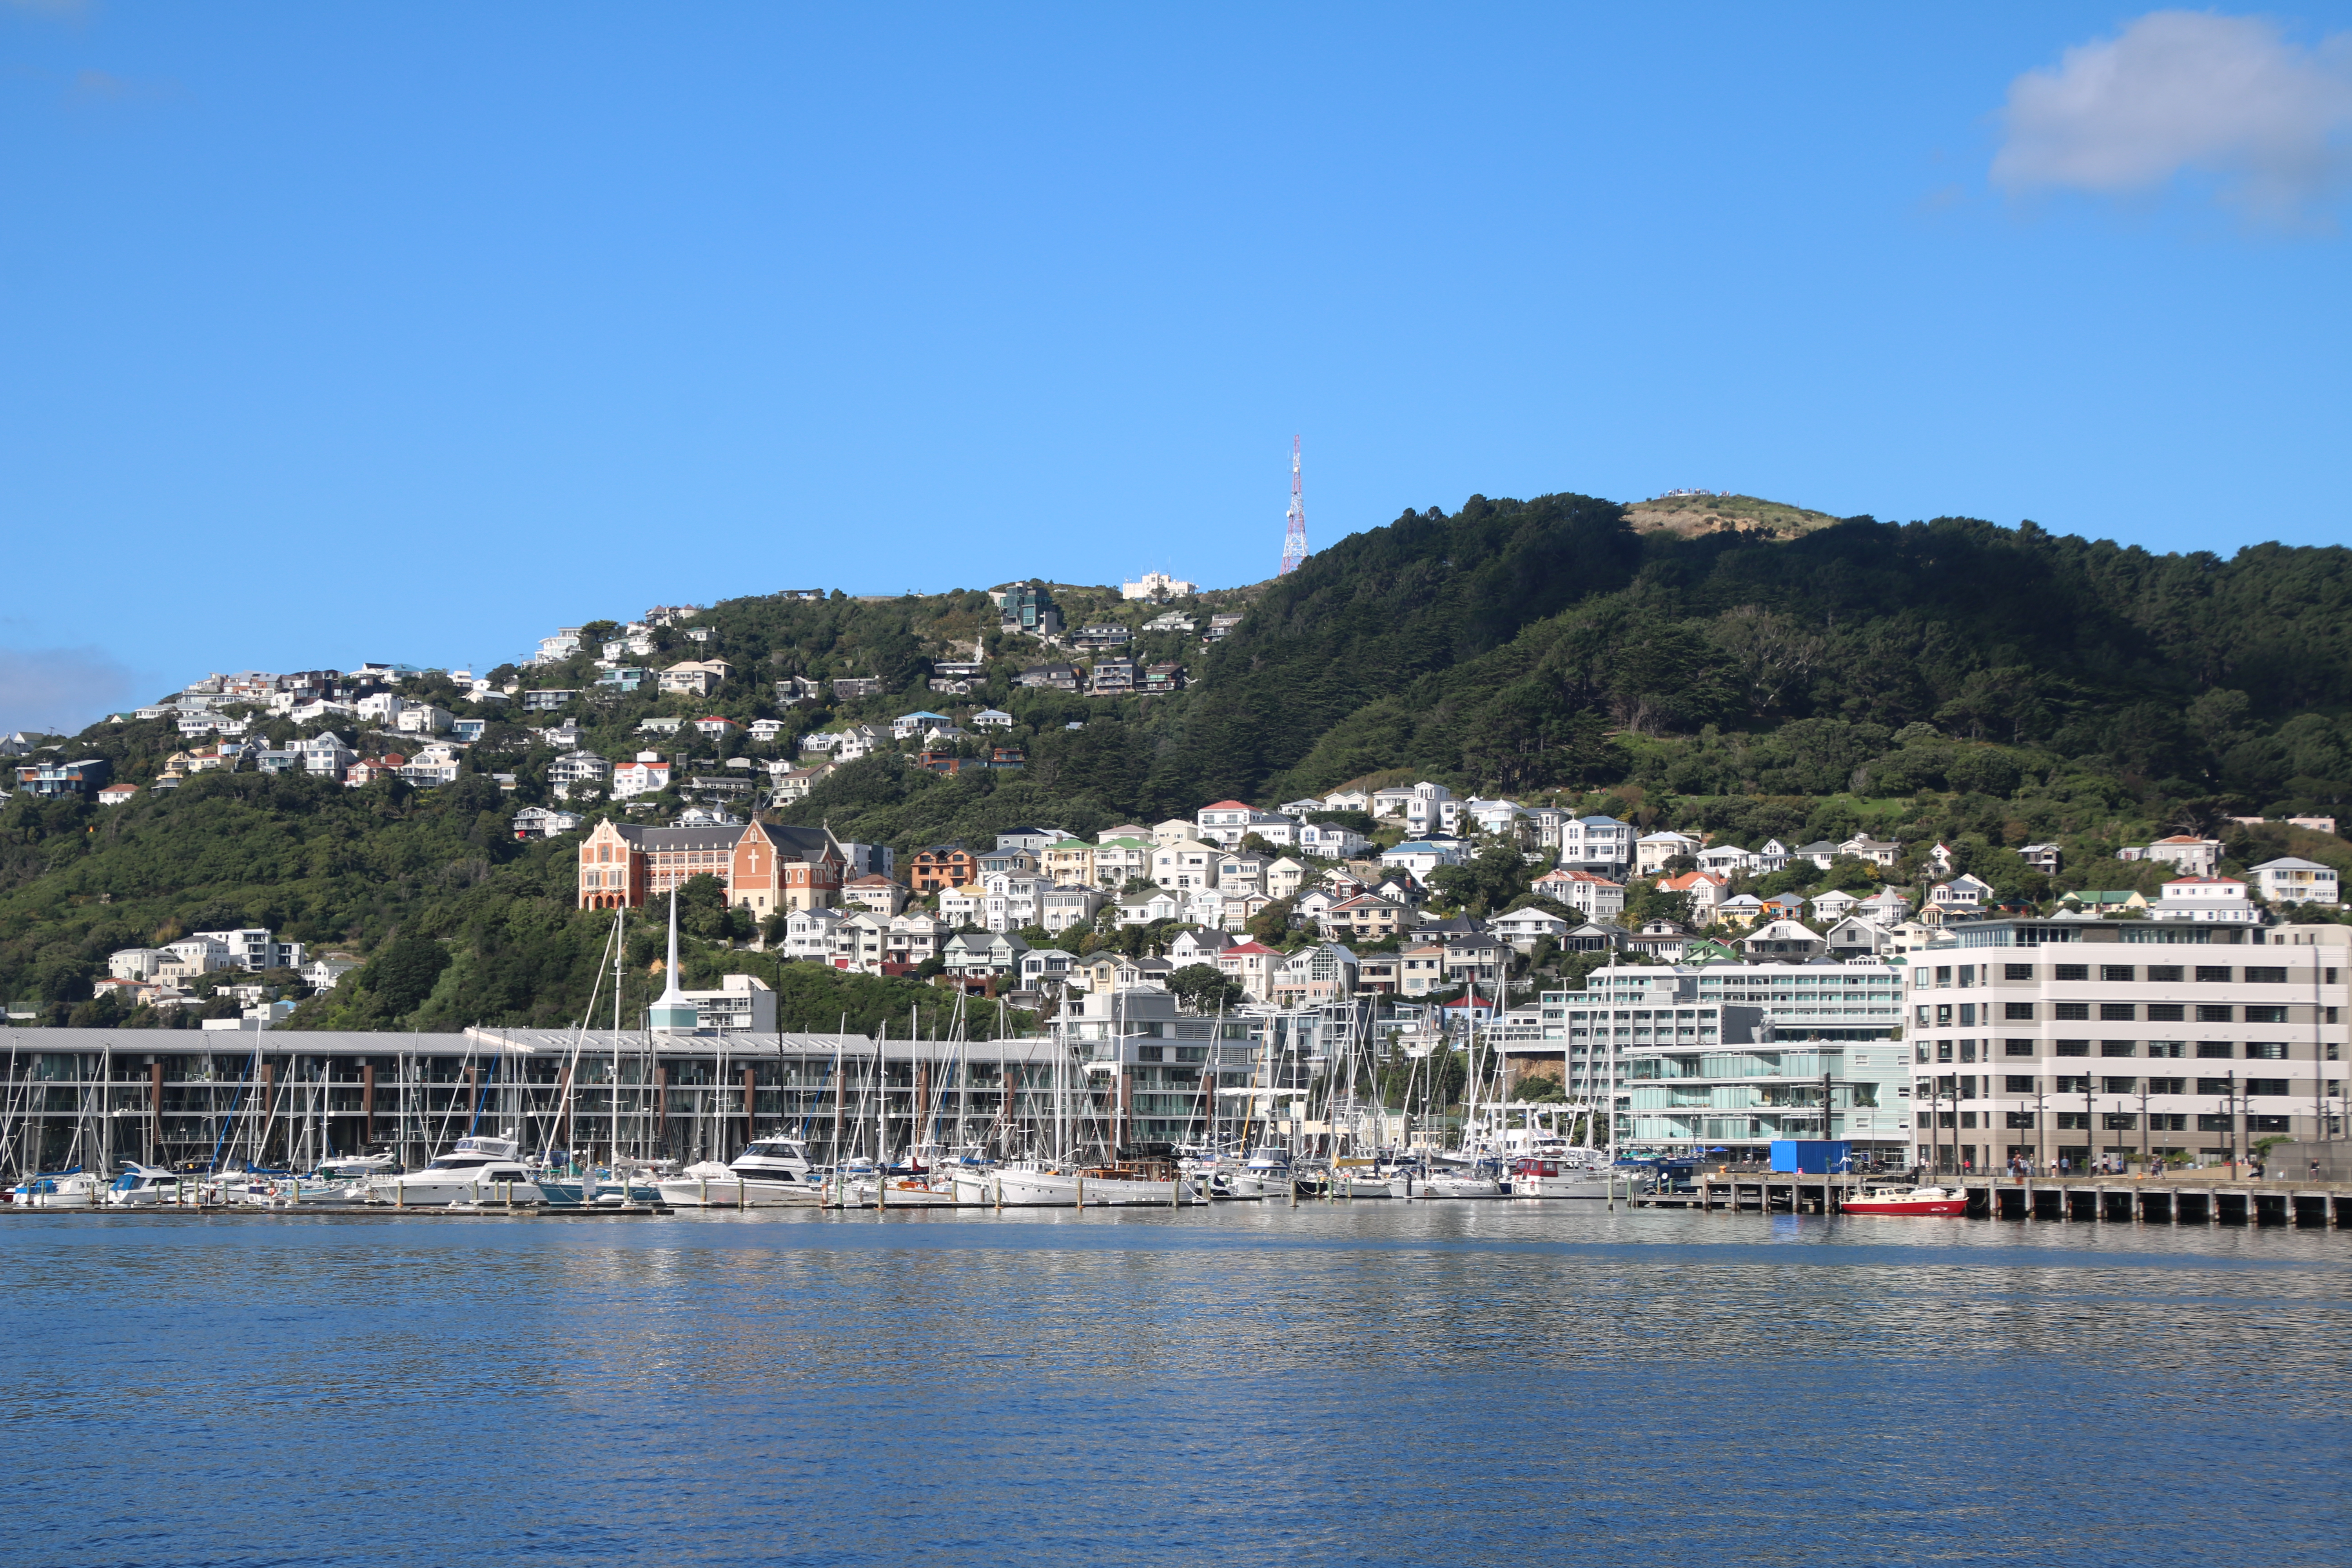
.
We know from experience elsewhere in New Zealand and further afield that, in general, slopes close to the surface traces of faults perform badly in earthquakes. The Kaikoira earthquake illustrates this quite well. This is a Google Earth image of the terrain close to the fault for example:
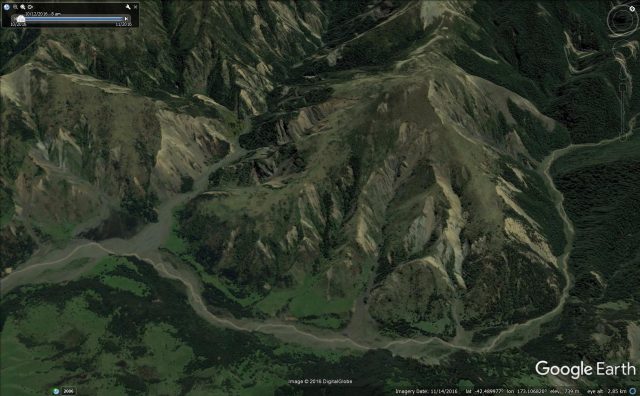
Google Earth image of landslides triggered by the Kaikoura earthquake
.
Sometimes after a large earthquake, there are large numbers of cracked and deformed slopes close to the fault that have not transitioned to full failure. These deformations are sufficiently large to damage houses very badly though. This is an image I took from a helicpter after the 2005 Pakistan earthquake:
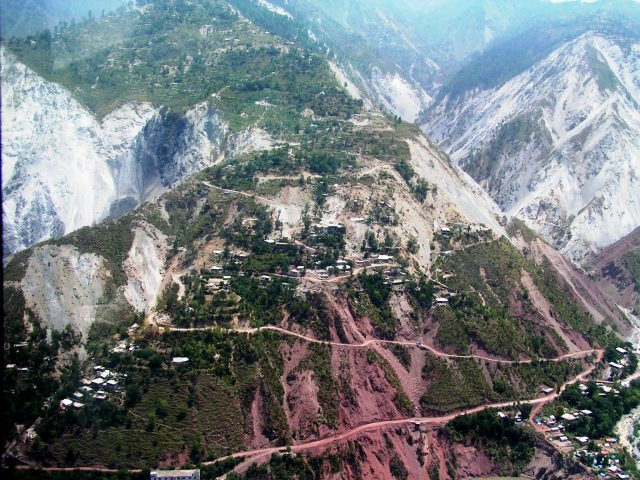
The aftermath of the 2005 Pakistan earthquake. The change in colour in the rocks that is so obvious in the image marks the line of the fault. The terrible landslide problem close to the fault is very clear.
.
It isn’t possible to say how the slopes will behave in an earthquake in Wellington, and no-one is suggesting that any particular property is at risk. But it is clear that the work that GNS Science and others are doing on the Wellington earthquake landslide problem is both timely and important.
22 April 2017
March for Science: Wellington, New Zealand
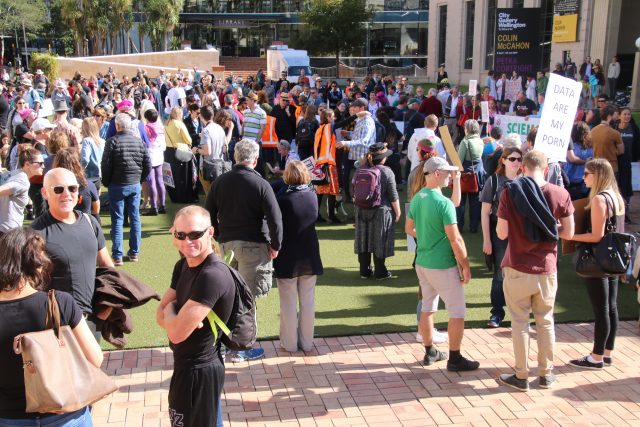
March for Science: Wellington, New Zealand
Today, my last day in New Zealand for this visit, I was honoured to be able to attend the Wellington March for Science. Its geographic position means that New Zealand has kicked off a global series of events – I think over 600 are planned. The Wellington March for Science was one of the three that happened this morning; Auckland follows this afternoon. The event was well-attended in glorious, fabulous sunshine – Wellington was at its very best. The crowd initially assembled at the Civic Square:

.
Before marching over to the National Museum at Te Papa:


.
And then five short speeches, all good natured and well received:

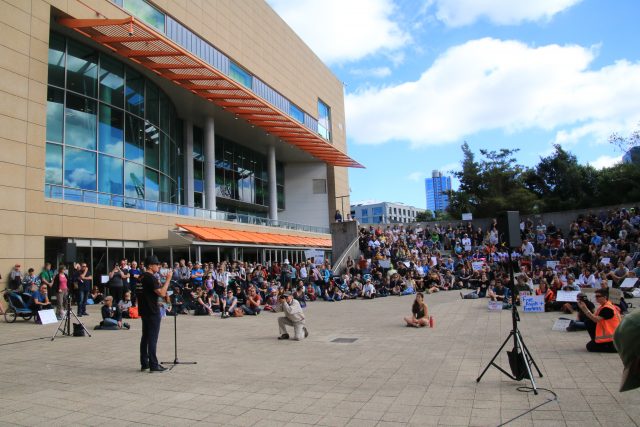


.
There were some brilliant placards:


.
Of course different people were there for different reasons 😉

.
But thank you to everyone who was there for a happy, well-organised, positive and uplifting day. I wish everyone who is marching today my best wishes. This is so very important.

 Dave Petley is the Vice-Chancellor of the University of Hull in the United Kingdom. His blog provides commentary and analysis of landslide events occurring worldwide, including the landslides themselves, latest research, and conferences and meetings.
Recent Comments