5 May 2017
The Van Zandt landslide: another great example of landslide mapping using LIDAR
Posted by Dave Petley
LIDAR: another great example of landslide mapping in difficult terrain
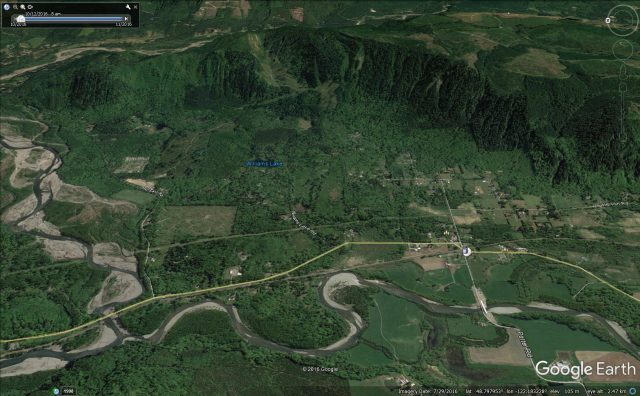
I recently came across another great example of the use of LIDAR for mapping landslides in difficult terrain. The Washington Geological Survey has a wonderful mapping tool online that gives the user the ability to look at a range of geological data. The Bellingham Herald has a nice article about the LIDAR dataset, which can be accessed through the portal, in which they highlight the example of the Van Zandt landslide on the Nooksack River. This landslide is located at 48.803, -122.151 if you want to take a look on Google Earth. Imagery of the location suggests that there might be a landslide here – below is a Google Earth perspective of the site showing a huge scoop out of the ridge and a river that may have been pushed over to the opposite side of the valley. However, the area between the ridge is densely forested in places, with vegetation of various types covering almost all of the landscape. It is extremely difficult to map a landslide deposit in these circumstances:

Google Earth image of the site if the Van Zandt landslide on the Nooksack River. Whilst the scoop out of the hillside might indicate a landslide here, the deposit cannot be mapped.
.
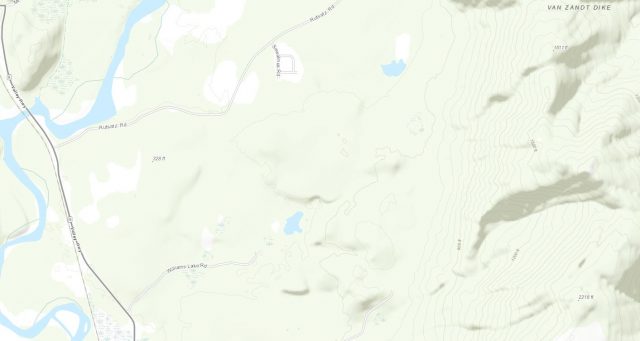
A topographic map of the area does not help much. The possible landslide scar can be seen, but the data does not provide the resolution to understand what might sit on the valley floor:

Shaded relief topographic map of the Van Zandt landslide on the Nooksack River, via the Washington Geological Survey
.
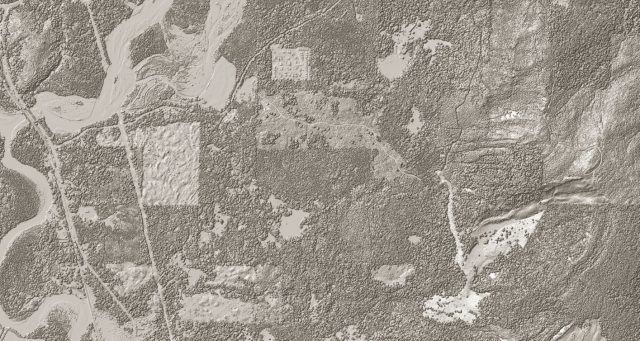
Unprocessed LIDAR data does not seem to add much to the interpretation. Each individual tree can be seen, and the area of stripped vegetation suggests very hummocky terrain (often a hint that an old landslide is present), but it would be impossible to map a landslide from this:

Raw LIDAR data of the site of the Van Zandt landslide on the Nooksack River in Washington State, via the Washington Geological Survey
.
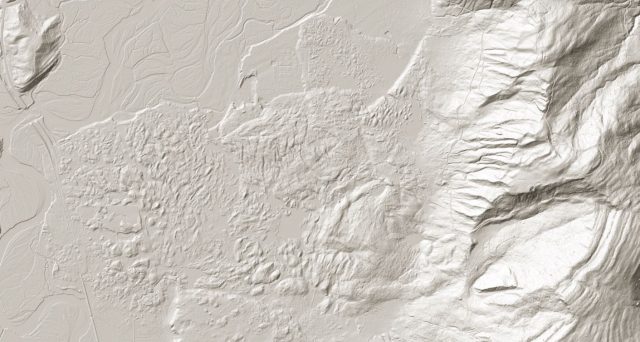
But a LIDAR system fires many pulses of laser energy at the ground in the process of mapping. Even in a forested area a few of these make it through the vegetation canopy to strike the ground before being reflected back to the instrument. Whilst the proportion of laser pulses that make this journey is small, the high density of pulses sent by the laser means that these can be used to map the underlying terrain. So the pulses that have reflected off the tree canopy are removed through processing, leaving just those that reached the ground. These are then combined to produce a bare earth LIDAR hillshade. The spatial resolution of this is less good, but the ability to capture the underlying relief is amazing. Here is the bare earth hillshade for the Van Zandt landslide:

Bare Earth LIDAR imagery of the landslide on the Nooksack River, via the Washington Geological Survey
.
And suddenly the hummocky topography of the landslide deposit is plain to see, and is easily mapped. And what becomes evident from this is that this was another highly mobile landslide with a long runout. Interestingly, a back of the envelope calculation suggests that the H/L ratio for this landslide is about 0.132, close to the supposedly extraordinary mobility value of 0.105 for the Oso landslide.
Close examination suggests that there is real complexity in this deposit – is that another smaller but still highly mobile landslide deposit at the top of the image for example? And if so, from where did it originate? Detailed analysis of the Lidar imagery could reveal a great deal. But the example demonstrates once again the amazing ability that LIDAR provides to map landslides in difficult terrain.
Dan McShane has a short article on the Van Zandt landslide on his excellent blog. This thesis proposal also provides some detail.


 Dave Petley is the Vice-Chancellor of the University of Hull in the United Kingdom. His blog provides commentary and analysis of landslide events occurring worldwide, including the landslides themselves, latest research, and conferences and meetings.
Good post, Dave. Geoff Malick, one of my MS students, is just finishing his thesis on this slide complex. His work includes detailed mapping (using both multiple generations of lidar as well as detailed field investigations), radiocarbon dating of the various lobes (there appears to be three main ones), and some really interesting monitoring work in the headwall of the source zone that demonstrates continued creep of some of the large bedding-plane slips. We plan to submit his thesis for publication this summer, so stay tuned for the details. It’s a remarkable slide and a really thorough thesis study.
Hi Dave, I’ve got some good constraints on the timing, triggers, and mechanics of the VZ slide for my master’s thesis. There is also ongoing deformation that may portend future large failures. If interested in a summary and/or figures, my email address is [email protected].
Anybody has an idea of the cost of such a technology? I would like to use it both for landslide hazard mapping in urbanised valleys and volcanic flows mapping for quarry purpose in Tahiti. What is needed to get that kind of map (type of lidar, softwares)? What is the best way to use lidar (satellite, plane/helicopter, drone) in deep valleys? Any companies able to do that? Thanks!