
24 March 2020
Tendepo: a major landslide in Tambul-Nebilyer district in Papua New Guinea
Tendepo: a major landslide in Tambul-Nebilyer district in Papua New Guinea
On Saturday 21 March 2020 a major landslide occurred at Tendepo in Tambul-Nebilyer district in Papua New Guinea, resulting in 12 fatalities. There is an accessible and useful account of this event on The Watchers website, which notes that the landslide was triggered by ongoing heavy rainfall, with further events considered to be possible in the coming days.
That article includes this image of the landslide:-
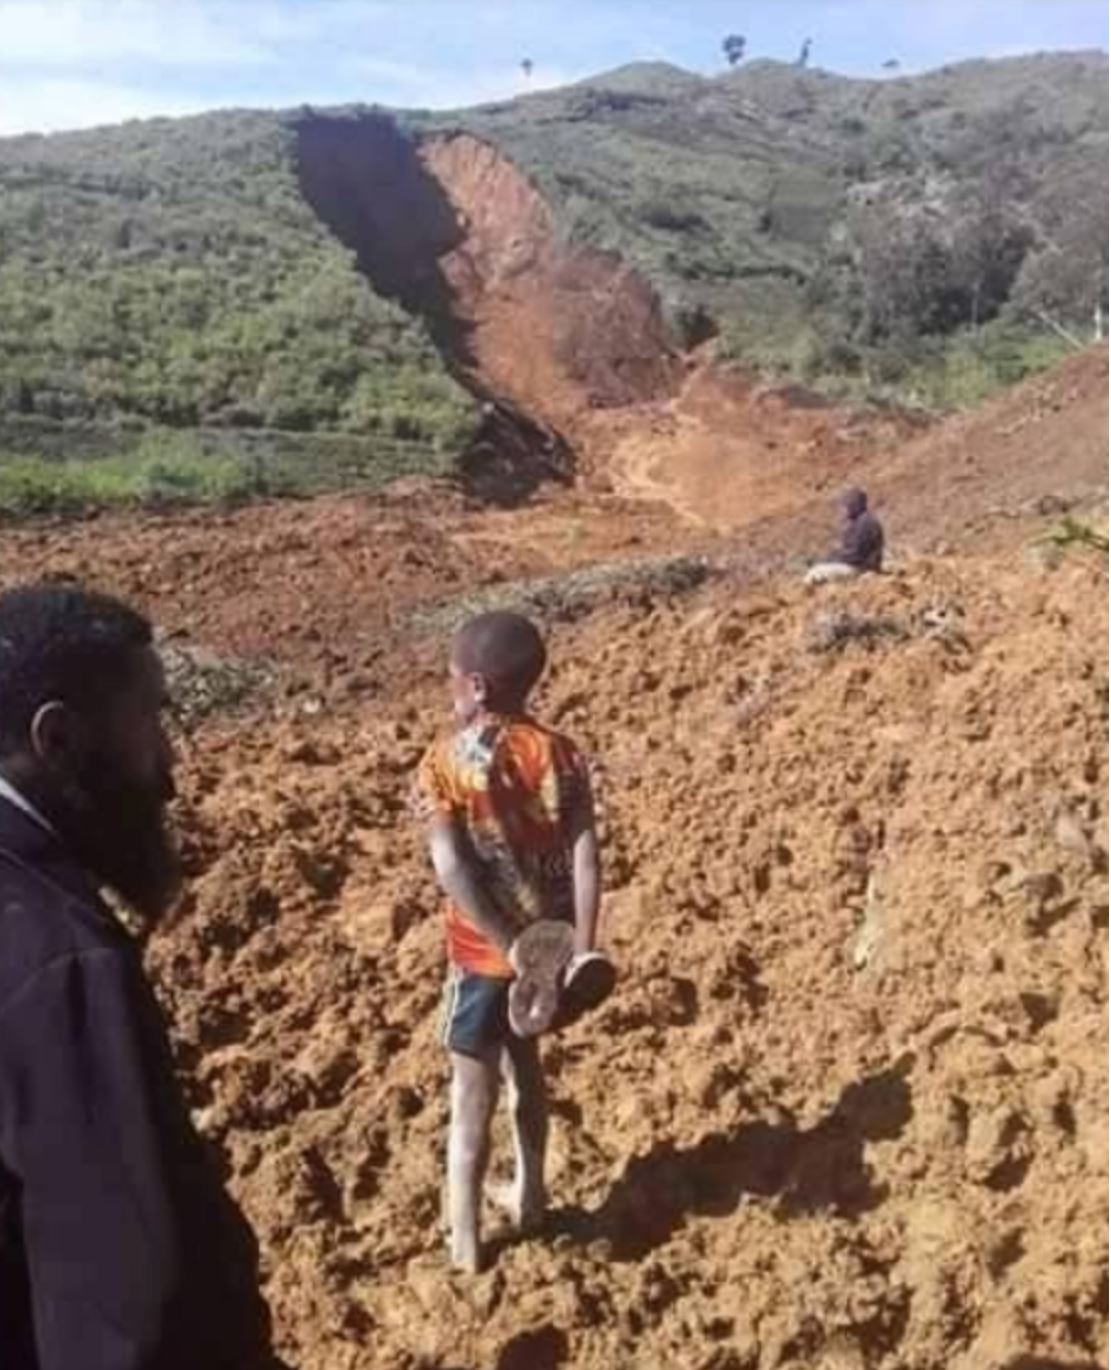
Tendepo: the aftermath of the major landslide in Tambul-Nebilyer district in Papua New Guinea on 21 March 2020. Image by Jux Ablis via The Watchers.
.
Based upon this image this appears to be reasonably deep-seated, possibly rotational slip in deeply weathered residual soil on a slope that has been deforested. The displaced block appears to have disintegrated to generate a major, probably rapid, earthflow. The mobility of the landslide appears to have been quite high.
This image, from the same article, provides an alternative view of the scar of the landslide:-
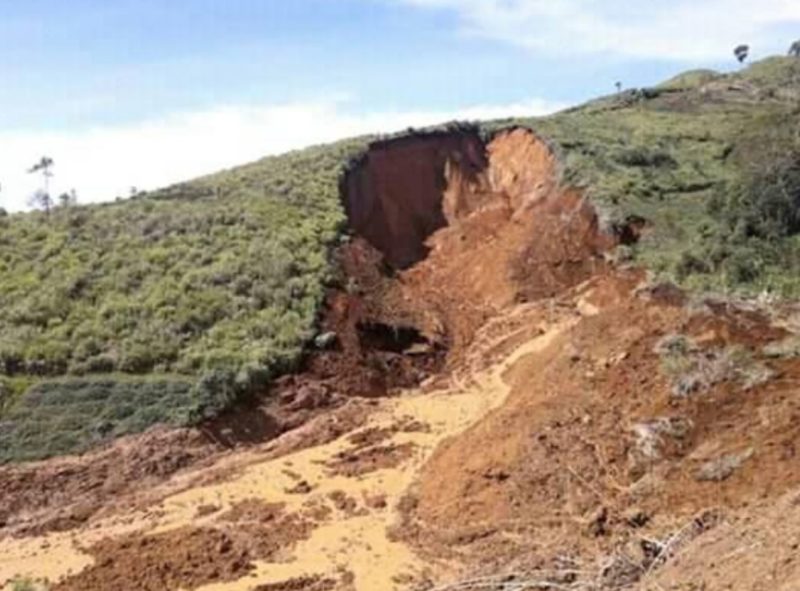
Tendepo: the scar of the major landslide in Tambul-Nebilyer district in Papua New Guinea on 21 March 2020. Image by Caligen Giluwe Ice via The Watchers.
.
The National (a Papua New Guinea newspaper) has an account of the landslide:-
The landslide, which began around 1 am, also washed away 13 homes, domestic animals and food gardens … “People who were awake at that time heard a big noise and found out it was a landslide,” Yanga said. He said it was the first time for him to witness a landslide destroying lives and properties. “We are shocked at the moment because this is the first time to witness people die like that in our Tendepo tribe,” Yanga said.
Papua New Guinea is no stranger to major landslides – for example, a few years ago I covered in detail the outrageous 2012 Tumbi Quarry landslide, which killed at least 25 people, and more recently the 25 February 2018 Mw=7.5 earthquake triggered many landslides, causing an unknown number of fatalities.
23 March 2020
Alborz mountains in Iran: an extraordinary rockfall video
Alborz mountains in Iran: an extraordinary rockfall video
On 20 March 2020 a major rockfall / boulder roll occurred in the Alborz mountains of Iran. It was caught on a video that has been posted to Youtube:-
.
As the video shows, this boulder rolled through a village, which is reported to called “Pit Sara” in Savadkuh County in Mazandaran Province. The rockfall (or boulder roll) was triggered by heavy rainfall. It reportedly destroyed four houses, two cattle sheds a bridge and four vehicles. Reports suggest that the volume of the rock was about 30 cubic metres.
This still from the video shows the moment that the boulder ploughed through one of the houses. Fortunately, the village had been evacuated ahead of the boulder roll event:-
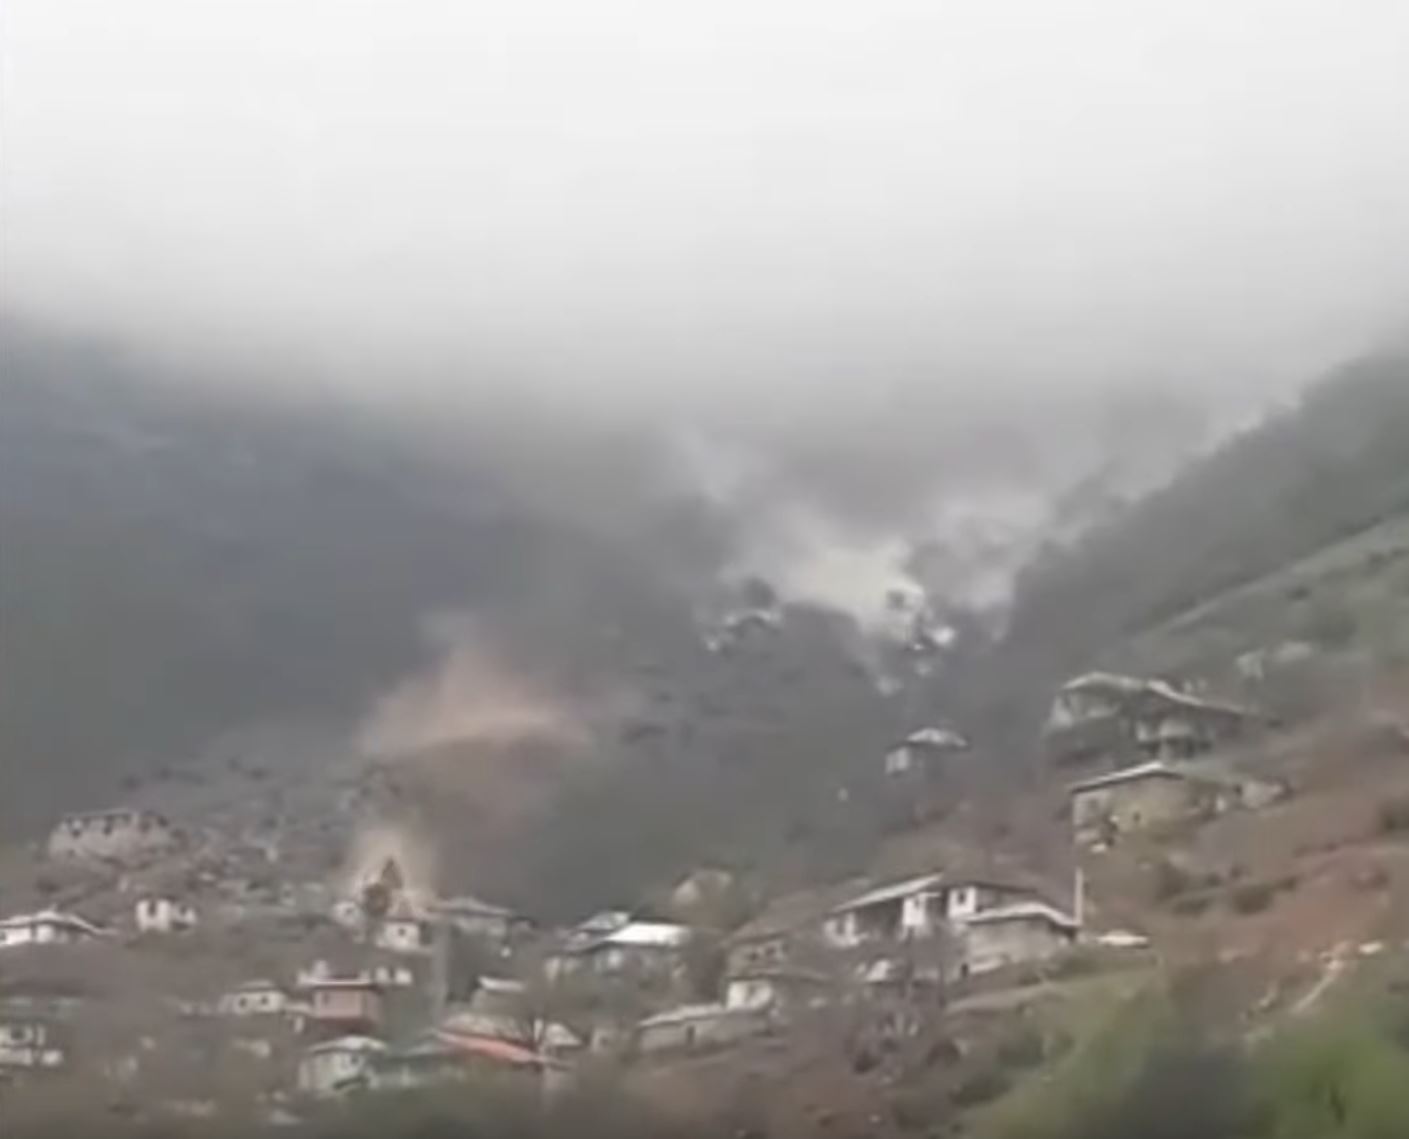
The extraordinary boulder roll in the Alborz mountains of Iran on 20 March 2020. Still from a video posted to Youtube.
.
The video also captures the aftermath of the boulder roll event, showing total destruction of anything in its path:-
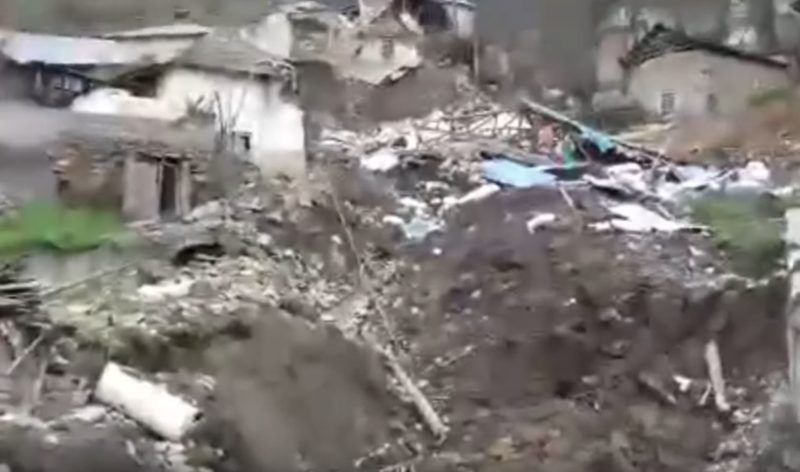
The aftermath of the rockfall in the Alborz Mountains of Iran on 20 March 2020. Still from a video posted to Youtube.
.
Wikipedia describes the Alborz Mountains thus:-
The Alborz range, also spelled as Alburz, Elburz or Elborz, is a mountain range in northern Iran that stretches from the border of Azerbaijan along the western and entire southern coast of the Caspian Sea and finally runs northeast and merges into the Aladagh Mountains in the northern parts of Khorasan … Mount Damavand, the highest mountain in Iran measuring 5,610.0 m (18,405.5 ft), is located in the Central Alborz Mountains.
There is a grey literature paper on landslides in the Alborz Mountains (NB pdf), which indicates that this is an area with a very significant landslide issue, triggered by both rainfall (as in this case) and earthquakes.
This event is quite reminiscent of the well-known and very spectacular 21 January 2014 Tramin (Termino) rockfall / boulder roll in the South Tyrol in Italy.
20 March 2020
Sinking ships to stop erosion
Sinking ships to stop erosion
A wide range of approaches have been developed to try to reduce or stop erosion and landslides, with mixed success and (in some cases) no lack of controversy. Gloucestershire Live has published a nice article about an approach that is new to me, but provided to be surprisingly successful. Along the banks of the River Severn, in southwest England, ships were sunk to protect the riverbanks and to stop erosion. This was undertaken in a number of locations, but one such spot lies at Purton (located at 51.736, -2.457), and is visible on Google Earth:-
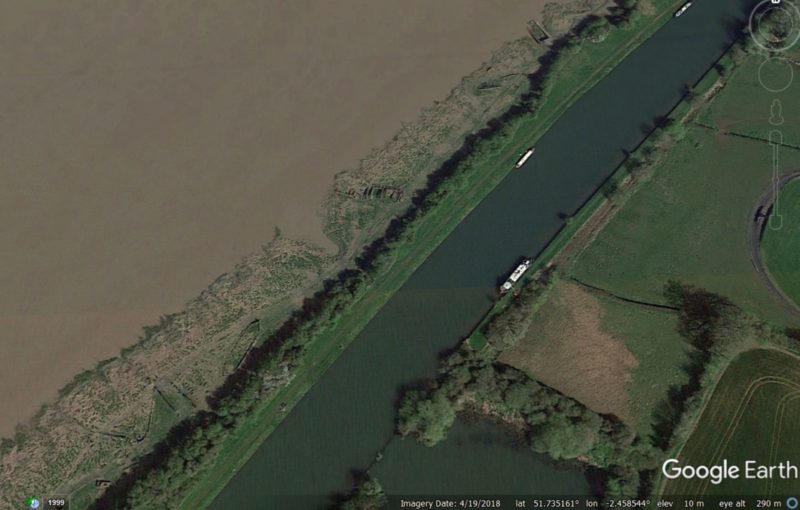
Sinking ships to stop erosion: Google Earth imagery of the Purton ships graveyard. The ships are buried in the banks between the River Severn to the north and the canal to the south.
.
There is a similar situation at Wainlodes (location 51.930, -2.224).
This is what the ships look like on the ground:-
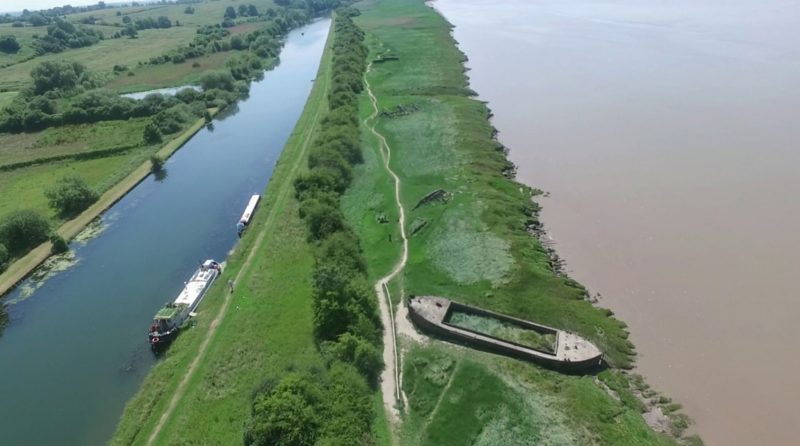
Sinking ships to stop erosion: the Purton ships graveyard. Image via Gloucestershire Live.
The Gloucestershire Live article explains the rationale:-
In the case of Wainlodes an ancient crossing point on the river, the barges were sunk just after the First World War to slow the stream that was eating away at the hill causing regular landslips.
At Purton the need to arrest erosion was much more pressing. In about 1910 the Severn changed its course. Serious and rapid erosion of the bank took place that threatened to break through to the Sharpness to Gloucester Ship Canal, which was a busy commercial waterway bringing timber, grain, oil and other commodities to Gloucester Docks from all over the world. Action had to be taken quickly.
The canal authority bought the hulks of vessels that were at the end of their working life from the owners to use as breakwaters. Tugs took the hulks at full tilt to the place where they were to be beached, then cast off and let them run aground, leaving the man at the tiller marooned. He had to hole the hulk, then be taken off.
It was a remedy that worked. The hulks, also known as wingdykes, slowed the velocity of the river, which then deposited sediment around the wrecks. This reduced the stream further, which meant that more silt was deposited and so the cycle continued until today many of the craft that were beached decades ago now stand on dry, reclaimed land.
Once the plan was proven to work, more vessels were beached. In 1945 there were nine of them, by about 1952 there were 21 and then more were grounded in the 1960s.
This is an unusual but seemingly highly effective way to stop erosion and thus to prevent landslides. Erosion of riverbanks is proving to be a substantial problem in many parts of the world at the moment; novel approaches may be needed elsewhere too.
19 March 2020
The May 1971 Saint Jean Vianney landslide disaster
The May 1971 Saint Jean Vianney landslide disaster
One of my daily landslide feeds threw up an interesting reflection today on the May 1971 Saint Jean Vianney landslide disaster in Quebec, Canada. This landslide, which occurred with little warning at 10:15 pm on 4 May 1971, affected the eastern side of the town, destroying 40 homes and killing 30 people. This extraordinary image, taken in the aftermath of the landslide, shows the scale of the failure. Note the houses lying within the landslide mass:-
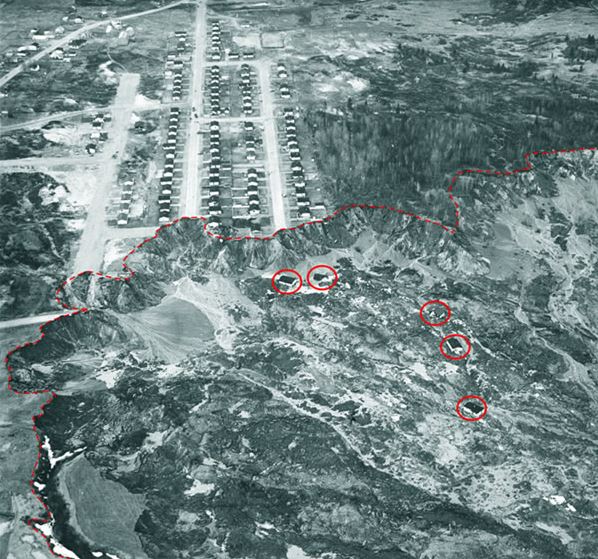
The aftermath of the 1971 St. Jean Vianney landslide in Canada. Image published by Gendisasters.
.
There are many resources about this landslide available online, and the landslide was described in an article published in the Canadian Geotechnical Journal (Tavenas et al. 1971). The landslide occurred in the Champlain Clay, now known to be a classic sensitive or quick clay. Such materials can generate spectacular retrogressive landslides – I have featured a number of more recent examples on this blog.
This was an enormous landslide – Tavenas et al. (1971) give a volume of 6.9 million cubic metres – and the image below from the paper provides an overview of the full extent of the slide:-
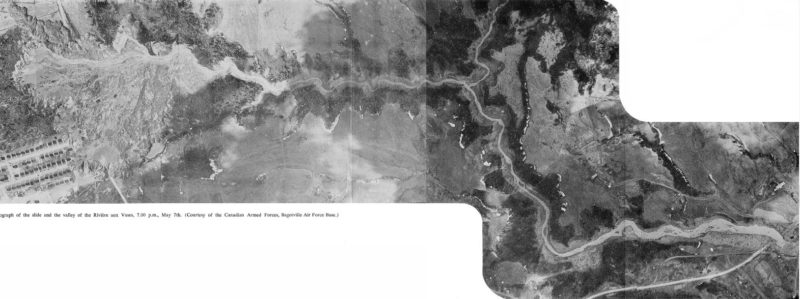
Vertical aerial image of the Saint Jean Vianney landslide, from Tavernas et al. (1971)
.
The likely cause of the landslide was a spell of warmer weather, which drove a thaw, followed by two spells of heavy rainfall, one in late April and the second on 3-4 May 1971. On 24 April a smaller landslide occurred on the periphery of what became the main landslide a few days later.
Tavernas et al. (1971) used eye-witness reports to try to reconstruct the sequence of events for the Saint Jean Vianney landslide. This provides a fascinating set of accounts, starting with this one:
Mr. R. Girard and Mr. J. Tremblay, living in the new development of Saint-Jean-Vianney, reported that their dogs started to behave abnormally at 7.00 p.m. on May 4th, being extremely nervous. Mr. Girard described the behavior of his dog as the same as during a thunderstorm.
From this, and other accounts, Tavernas et al. (1971) proposed that instability started at about 7 pm, with the first major failure occurring at about 10:15 pm. Over the next 45 minutes the landslide appears to have undergone a series of retrogressive events; by 11pm most of the houses that were lost had been destroyed.
There are many harrowing stories from survivors of this landslide, The Montreal Gazette article includes two such accounts:
Resident François Richard told our reporter he was in his living room watching the hockey game when he heard shouting outside. “He walked 600 metres down his street and saw houses falling one by one.”
One lucky woman survived by crawling onto the roof of her car after it had fallen into the crater. But there were few such stories. Many families were trapped in the liquid mud, which then solidified.
This event greatly increased awareness of the hazards posed by sensitive clays, although sadly such failures continue to occur occasionally, especially in Norway, Sweden and Canada.
Reference
Tavenas, F., Chagnon, J-Y., and La Rochelle, P. 1971. The Saint-Jean-Vianney Landslide: Observations and Eyewitnesses Accounts. Canadian Geotechnical Journal, 8, 463-478, https://doi.org/10.1139
17 March 2020
The catastrophic lahars from Mount Kelud in 1919
The catastrophic lahars from Mount Kelud in 1919
On 19 and 20 May 1919 a catastrophic eruption occurred on Mount Kelud in East Java, Indonesia. This major eruption, one of the most deadly of the 20th Century, is estimated to have killed 5,160 people. The vast majority of those died in lahars (volcanic debris flows) triggered by the eruption. This was also one of the worst landslide disasters of the 20th Century.
There is a really interesting paper about the social impact of this event (Mawiyato and Sasmita 2019) available online, open access. They point out that this is a particularly interesting lahar event in part because of the detailed accounts of the impacts. The underlying problem at Mount Kelud is the presence of a crater lake, which at the time had an estimated volume of 40 million cubic metres. The eruption displaced this lake, which entrained large volumes of ash, generating the enormous lahars. On Researchgate there is a map of the deposits left by these landslides:
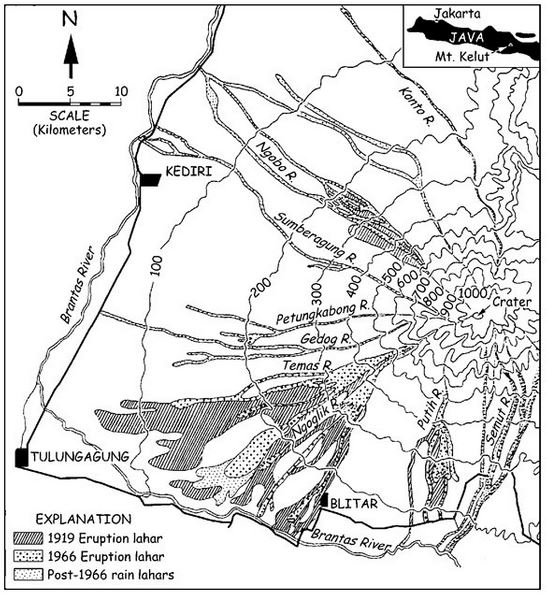
The lahars generated by the Mount Kelud eruption in 1919. Image posted to Researchgate by Kelvin Rodolfo, modified from an unpublished monograph of the Japan International Cooperation Agency
.
Mawiyato and Sasmita (20189) provide an account of the lahars, with a focus on those that travelled southwards to Blitar:
Bladak Dam of Kali Lahar, which was built to reduce the lahar floods of Mount Kelud, was destroyed. With a speed of 60 km/h, the flows of lahar reached Blitar in less than an hour and destroyed everything standing in its way. The scale of damage reached dozens of kilometers of the volcano. Many villages were reported to have been flattened to the ground and even some of them were wipe out from the map. Among the destroyed vilages were Sumbersari, Salam, Ngoran villages in Udanawu district. Villages along the road stretching from Panataran Temple to Blitar were badly devastated and also Omboh, Sidareja and Sumberejo villages of Wlingi.
To illustrate the magnitude of the impact of these lahars, Mawiyato and Sasmita (2019) describe the events in a prison located in the path of the lahars. About 900 prisoners were trapped in their cells. Of these only about 100 were able to escape the lahar, but they were quickly caught by the flows and were killed. There is perhaps no worse prospect than that of being trapped in a locked cell as it fills with boiling mud.
The devastation of the lahars are also well described. For example, this is the account of the damage in the town of Blitar:
Instantly Blitar lost its form as a town, turned into a sea of lahar. It was dark as being covered by cloud resulting from the swift ash rain. The height of the lahar was approximately 1.6 m, houses around the town square were all damaged, many walled houses were collapsed. The Chinese, Dutch, Javanese settlements whose house-buildings between were somewhat distant could be said to be non-existent. Only the houses of brick walls that coincided and hand-in-hand were not so damaged, but the walls were broken down, such as the house of the resident master, the district house, the post office, the bank office, the clinic, the hotel, the detention center and the other.
Apart from the loss of life, the lahars and ashfall caused massive damage to the extensive coffee farms on the flanks of the volcano, and to other agricultural areas.
Mount Kelud erupted again in 1966, killing more than 200 people. To manage the hazard, a set of tunnels, known as the Ampera Tunnels, were constructed to manage the water levels in the crater.
Reference
Nawiyanto and Sasmita, N. 2019. The Eruption of Mount Kelud in 1919: Its Impact and Mitigation Efforts. In: 1st International Conference on Social Sciences and Interdisciplinary Studies (ICSSIS 2018). Atlantis Press. https://doi.org/10.2991/icssis-18.2019.25.
16 March 2020
An analysis of the Piz Cengalo landslide
An analysis of the Piz Cengalo landslide
In August 2017 a large landslide initiated on the Piz Cengalo mountain in Switzerland. It travelled 6.5 km before striking the village of Bondo. In total it was responsible for eight fatalities.
In an article just published in the journal NHESS, which is open access, Mergili et al. (2020) provide a detailed description and simulation of the landslide. The first part of the paper provides a really good description of the event. The landslide was initiated at 09:31 local time on 23 August 2017 when about 3.6 million cubic metres broke off from the eastern face of Piz Cengalo. The sequence of events is shown in the images below, from Mergili et al. (2020):-
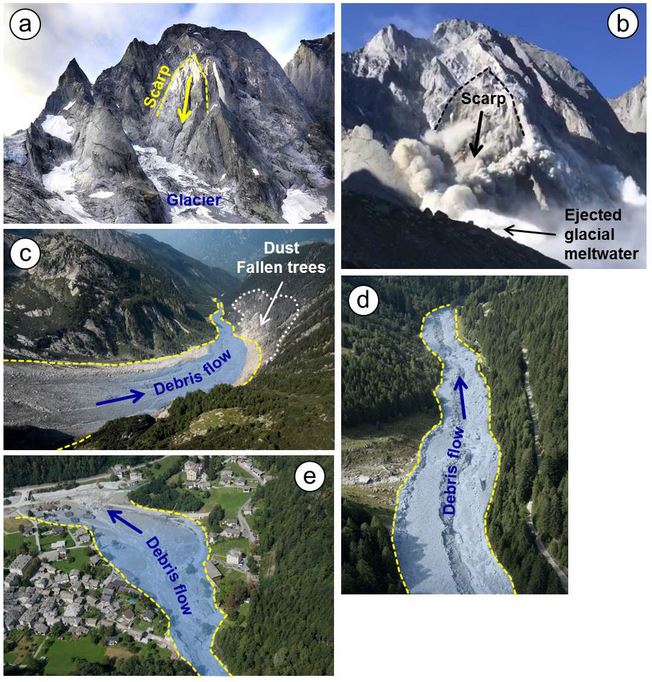
The sequence of events for the Piz Cengalo landslide, from Mergili et al. (2020). Original caption:- The 2017 Piz Cengalo–Bondo landslide cascade. (a) Scarp area on 20 September 2014. (b) Scarp area on 23 September 2017 at 09:30 LT, 20 s after release, in frame of a video taken from the Capanna di Sciora. Note the fountain of water and/or crushed ice at the front of the avalanche, most likely representing meltwater from the impacted glacier. (c) Upper part of Val Bondasca, where the channelized debris flow developed. Note the zone of dust- and pressure-induced damage to trees on the right side of the valley. (d) Traces of the debris flows in Val Bondasca. (e) The debris cone of Bondo after the event. Image sources: © Daniele Porro (a), © Diego Salasc/Reto and Barbara Salis (b), and © swisstopo (c–e).
.
After detaching, the landslide impacted the glacier below and entrained about 600,000 cubic metres of ice. In a manner that was similar to the Mount Haast landslide, the mass behaved initially as a rock avalanche. However, downstream it evolved into a debris flow that swept down the valley to strike the village of Bondo. Over the next day or so a series of nine debris flow surges struck the village.
Interestingly, two different scenarios have been proposed to explain the behaviour of the landslide, and in particular the formation of the first debris flow. These are described in the schematic diagram below, from Mergili et al. (2020):-
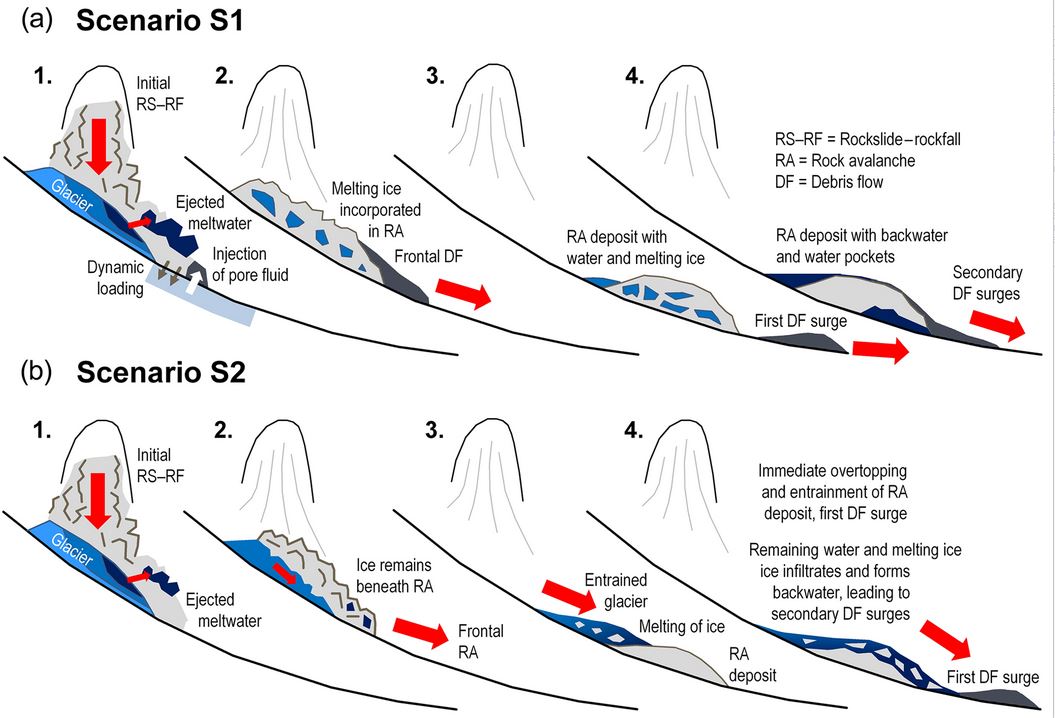
The two scenarios for the behaviour of the Piz Cengalo rock avalanche, from Mergili et al. (2020).
.
In the first scenario (S1), the front of the rock avalanche became highly saturated, and transitioned into the first debris flow. In the second (S2), the rock avalanche stalled mid-valley, but was overtopped by an avalanching flow of entrained ice and rock fragments, to form the debris flow.
Mergili et al. (2020) have attempted to simulate these two scenarios. Interestingly, the models indicate that both are plausible, and the simulations do not allow us to determine which is likely to be correct.
The behaviour of these complex landslides remains challenging to understand and model, but is really important if future hazards are to be understood. The impacts of global heating, which are increasing the frequency of these large events, means that this remains a really important research question.
Reference
Mergili, M., Jaboyedoff, M., Pullarello, J. and Pudasaini, S. P. 2020. Back calculation of the 2017 Piz Cengalo–Bondo landslide cascade with r.avaflow: what we can do and what we can learn. Natural Hazards and Earth System Sciences, 20 (2), 505-520. DOI: 10.5194/nhess-20-505-2020.
12 March 2020
Salkantay: Planet Labs imagery of the upper portions of the flow
Salkantay: Planet Labs imagery of the upper portions of the flow
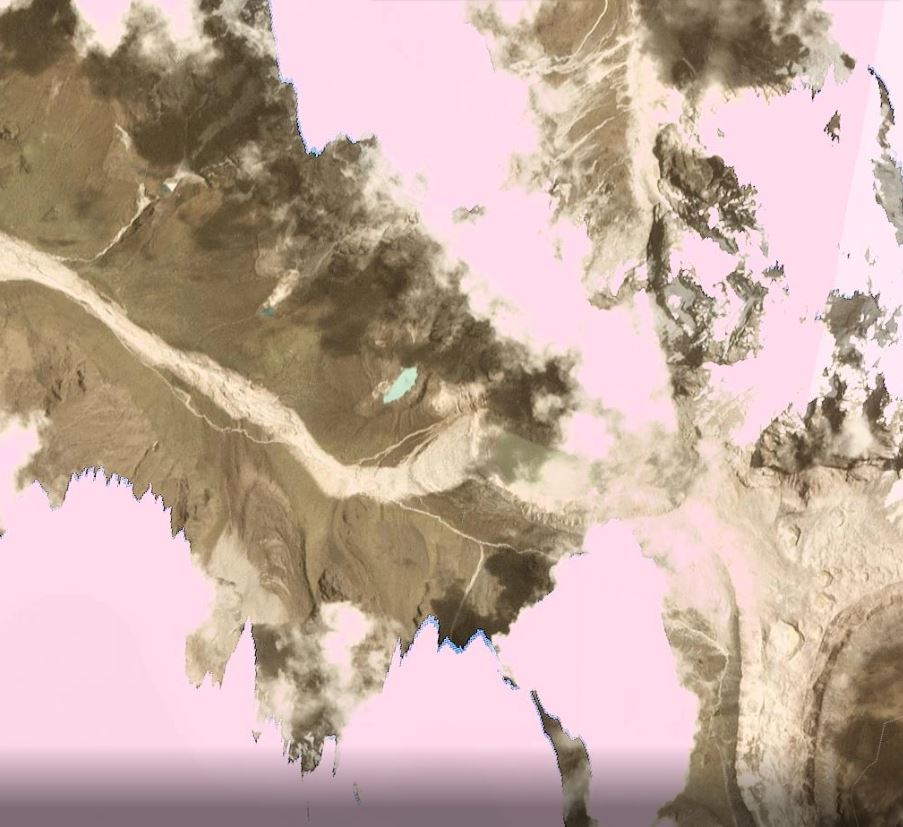
Capturing imagery of the source area of the ice/rock avalanche and subsequent debris flow at Salkantay in Peru is extremely difficult. This is an area that is heavily affected by cloud cover, especially in the upper portions of the catchment. Earlier this week I was able to post some images of the track of the debris flow that had been captured by Planet Labs using their PlanetScope constellation, but the upper part of the landslide was not captured. On 10 March 2020 a further pass by one of the satellites has captured the upper portion of the landslide, even though the actual source remains frustratingly obscured.
This is an image of the area around the source, captured before the landslide on 24 October 2019 by Planet Labs:-
Planet Labs imagery of the upper portions of the of the Salkantay landslide, prior to failure. Planet Labs PlanetScope image captured on 24 October 2019. Copyright Planet Labs, used with permission.
.
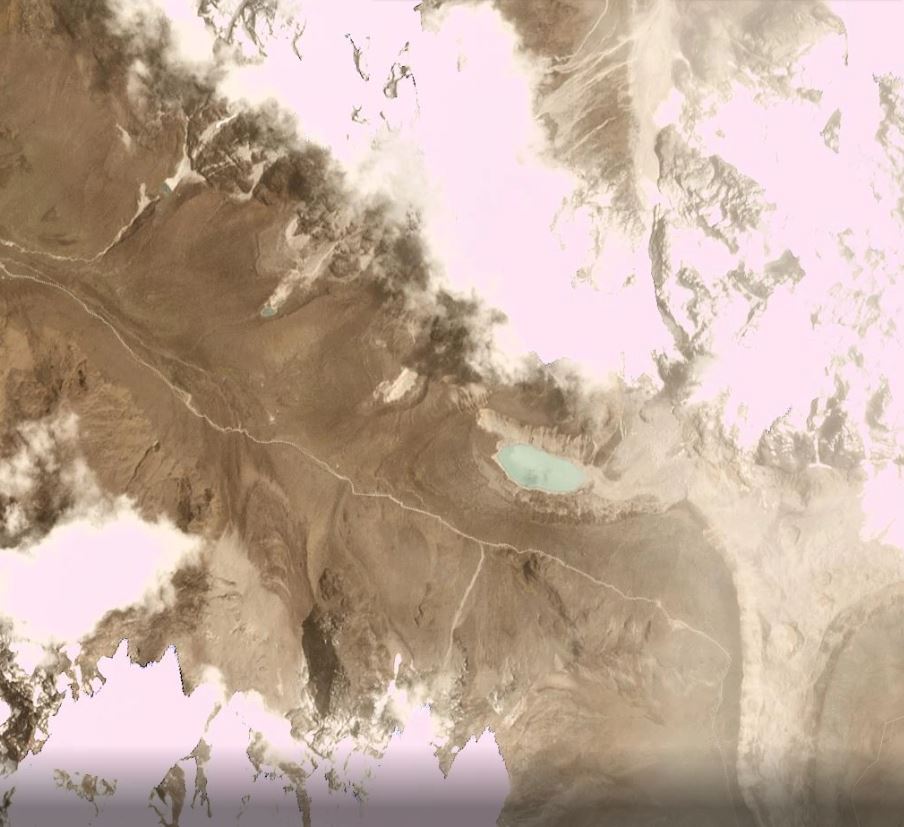
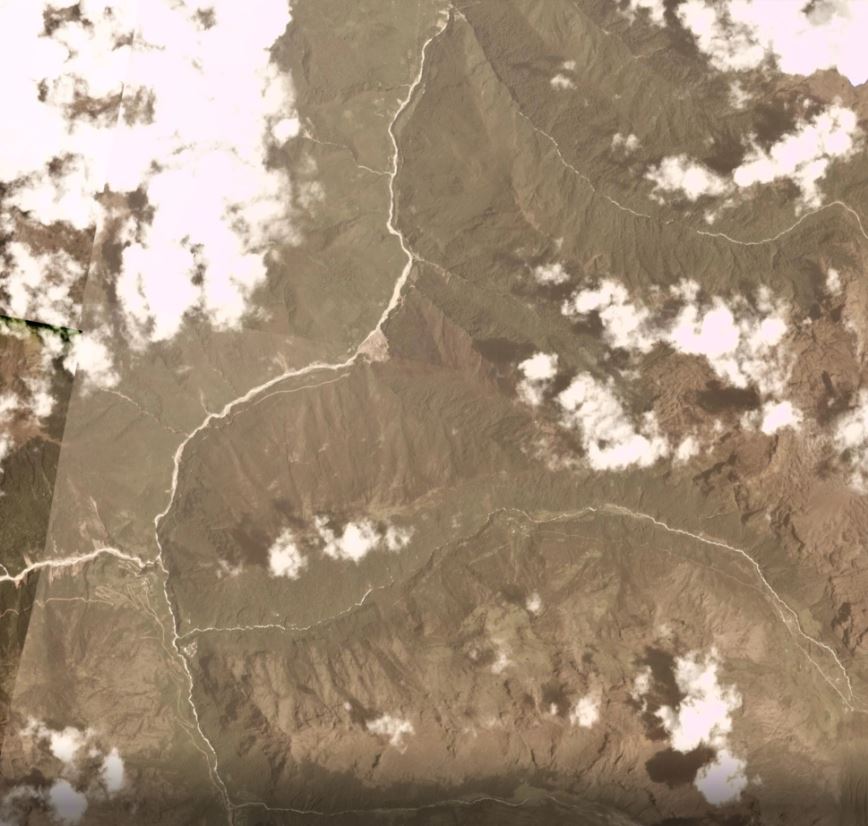
This is the Planet Labs image of the same area, captured on 10 March 2020:-
Planet Labs imagery of the upper portions of the of the Salkantay landslide, after failure. Planet Labs PlanetScope image captured on 10 March 2020. Copyright Planet Labs, used with permission.
.
Unfortunately the imagery does not really provide much additional information about the landslide source, although it can be seen that the lateral extent of the collapse was quite limited in extent on the mountainside. The landslide mass has travelled into the lake basin and has then emerged on the west side. Interestingly, there is still water in the lake, suggesting that it was not displaced or that the lake has refilled after the landslide. This is quite surprising – I would welcome views on how this has happened.
The track of the landslide is clear. Directly below the lake the landslide has eroded the vegetation but does not appear to have generated a great deal of scour. Further down the track there appears to be considerable scour, and on the west side of the image the landslide track has become wider. This is probably controlled by the pre-failure topography.
Reference and acknowledgement
Planet Team (2020). Planet Application Program Interface: In Space for Life on Earth. San Francisco, CA. https://www.planet.com/
9 March 2020
Downstream impacts of the Salkantay rock avalanche and debris flow
Downstream impacts of the Salkantay rock avalanche and debris flow
On 8 March 2020 Planet Labs captured an image showing the downstream impacts of the Salkantay rock avalanche and debris flow. Cloud-free days are rare in this part of the world are rare, so this is a good catch. Unfortunately the area of the actual failure is just off the edge of the image, but the downstream effects of the debris flow are clear.
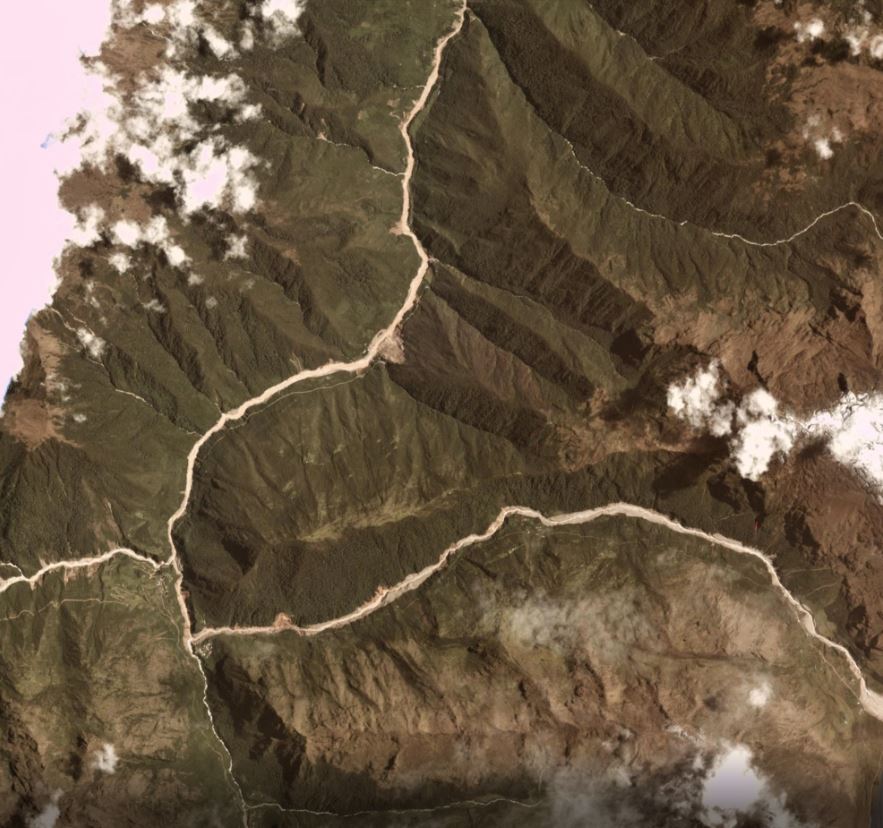
This is an image of the area captured before the landslide on 7 January 2020 with the Planet Labs Planetscope system:
Planet Labs image prior to the Salkantay rock avalanche and debris flow. Planetscope image collected 7 January 2020. Copyright Planet Labs, used with permission.
.
This is an image collected with the same system on 8 March 2020 showing the aftermath of the debris flow:-
Planet Labs image after the Salkantay rock avalanche and debris flow. Planetscope image collected 8 March 2020. Copyright Planet Labs, used with permission.
.
The impact of the landslide is clear. On the east side of the image a small proportion of what is presumably the landslide deposit can be see, before the channelisation occurred. The debris flow has eroded the channel flowing initially towards the west, and then towards the north. In some places erosion of the banks appears to have triggered failures on the hillsides. In this example, a new landslide has been triggered, and an existing one has been reactivated. In the latter case, a road across the landslide appears to have been destroyed:-
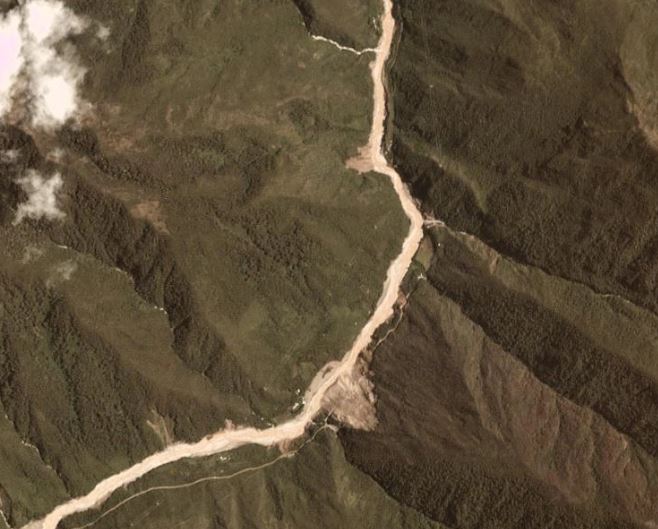
Planet Labs image after the Salkantay landslide. Planetscope image collected 8 March 2020. Copyright Planet Labs, used with permission.
.
Hopefully images will be captured in the next few days showing the failure itself, although this is of course dependent on cloud cover.
Reference
Planet Team (2020). Planet Application Program Interface: In Space for Life on Earth. San Francisco, CA. https://www.planet.com/
6 March 2020
The landslide-induced TGV (high speed train) accident in France yesterday
The landslide-induced TGV (high speed train) accident in France yesterday
Yesterday, 5 March 2020, a TGV (high speed train) struck a landslide between Strasburg and Vendenheim in the Bas-Rhin area of France. The train remained upright, not least because it appears that it was a glancing blow rather than a direct collision, but 22 people were injured, one seriously. The best news report, with thanks to Scott Johnson, is in L’Usine Nouvelle. The article is in French, but Google Translate does a fine job.
This image of the landslide was tweeted by SNCF:-
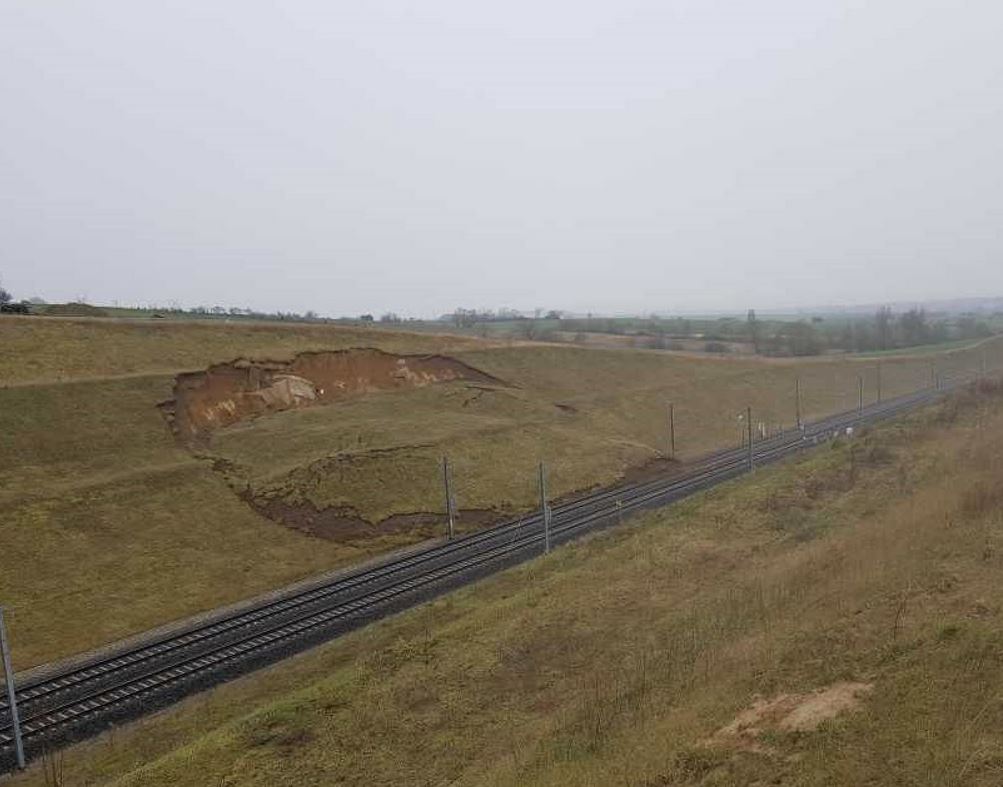
The 5 March 2020 landslide that derailed a TGV (high speed train) in France. Image Tweeted by SNCF.
.
The landslide is a large rotational slip in a slope in a cutting. The displacement of the mid-section is quite large, but little of the debris appears to have reached the tracks. This prevented a more serious accident. The train, which had 348 passengers on board, was travelling 270 kilometres per hour (170 miles per hour) at the time of the collision.
The line is quite new – Wikipedia indicates that it was constructed in the period between 2010 and 2016. A failure on this scale will inevitably cause concern, and is surprising. News reports indicate that the landslide was triggered by heavy rainfall. Interestingly, this is being described as an “accident intolerable” – i.e. an unacceptable accident – by the local trade union.
After the accident, the train came to a stop at about 48.729, 7.514, based on matching images to Google Earth. The accident must have been to the southeast of this point. The most likely location appears to be 48.719, 7.538, but this is very tentative.
Landslide-induced train accidents occur fairly often around the world, sometimes with very serious consequences. It is very unusual for an accident to affect a modern high speed line, especially in well-designed earthworks, which would typically have been constructed with a c.125 year design life. Thus, understanding the causes of this accident will be a priority.
5 March 2020
A geological detour: the Geotimes pillow lavas at Wadi Jizzi in Oman
A geological detour: the Geotimes pillow lavas at Wadi Jizzi in Oman
Earlier this week I made a brief trip to Oman as part of my (non-geological) day job, in this case attending the opening ceremony of Intaj Suhar, the Oman equivalent of the wonderful University of Sheffield Advanced Manufacturing Research Centre, which sits within my portfolio. On Sunday I took a detour inland to visit the famous Geotimes pillow lavas at Wadi Jizzi, about 30 km inland from the city of Sohar.
These rock are famous as they appeared on the front cover of the Geotimes Magazine in 1975 (the magazine is now known as Earth Magazine). I visited courtesy of a somewhat bemused taxi driver, who clearly could not really understand why I’d drive out into the desert to look at rocks. However, these are truly spectacular:-
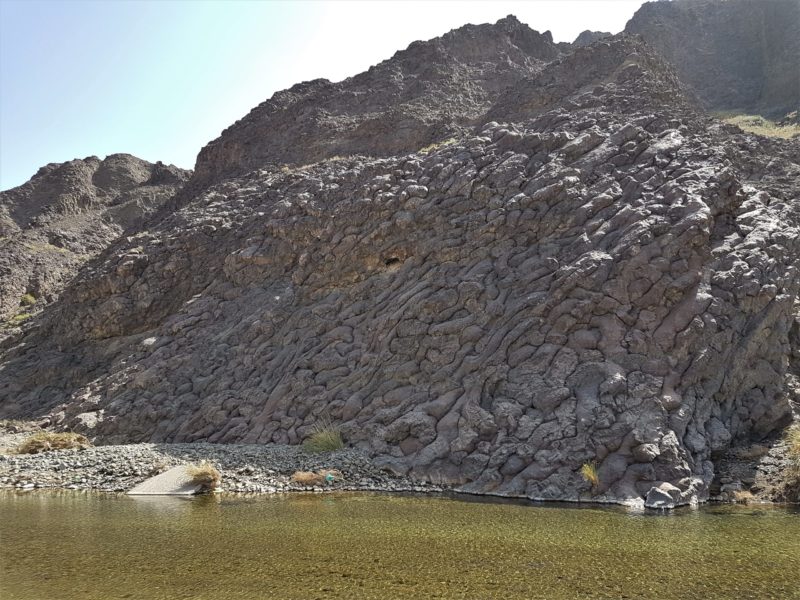
The pillow lavas of Wadi Jizzi in Oman.
.
Cutting across the outcrop are two well exposed altered basalt dikes:-
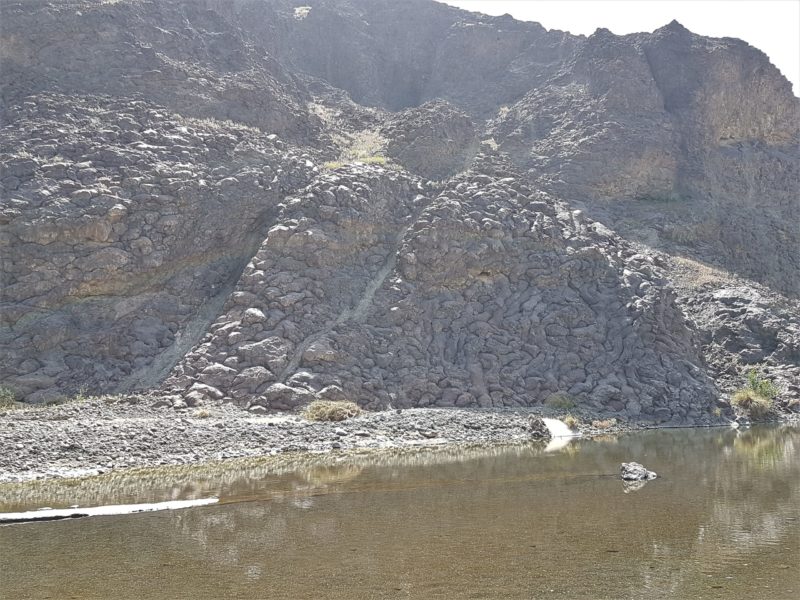
The two basalt dikes that cross-cut the Geotimes pillow lavas in Oman.
.
These altered dikes seem to be much more susceptible to weathering, so form distinctive gullies within the outcrop:-
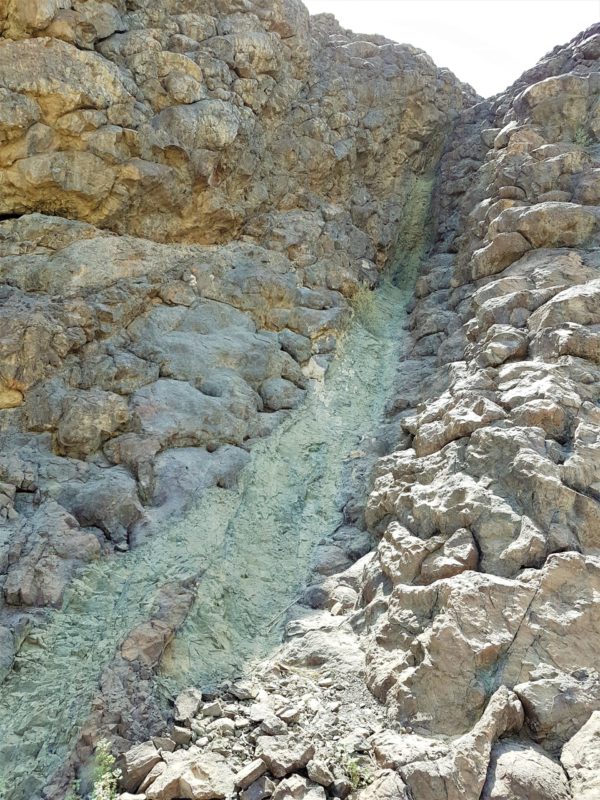
An altered dike in the Geotimes pillow lavas at Wadi Jizzi in Oman.
.
These pillow lavas were formed within the Semail Ophiolite at the bottom of the Tethys Ocean. The William and Mary Blog has a nice explanation as to how they formed:-
“Pillows commonly form when lava is extruded under water. As lava disgorges from its vent on the sea floor it comes in contact with the surrounding seawater that rapidly quenches the lava to a glassy solid, thereby partially clogging the conduit and forcing to lava to ooze out nearby. This repetitive process of extrusion and rapid quenching produces the tube to pillow-like morphology.”
These pillow lavas are exceptionally well-preserved. The explanation for this might lie in the deposits on the other side of the valley:-
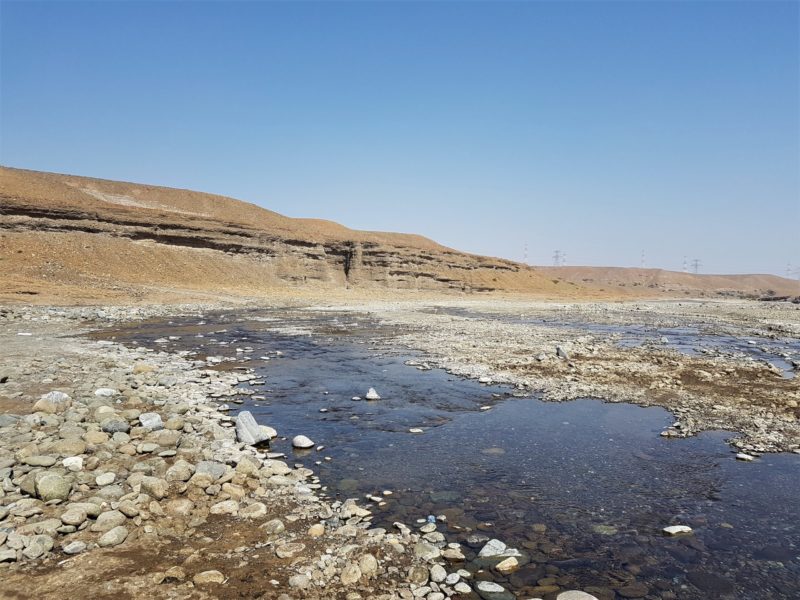
Alluvial deposits that might have preserved the pillow lavas at Wadi Jizzi.
.
I suspect that these alluvial deposits might have covered the pillow lavas until recently, preserving them.
Pillow lavas are very hard, and the interlocking structure will give the rock mass considerable strength. As a consequence they are likely to be resistant to failure, and thus not a good place to go looking for landslides.
The Habits of a Travelling Archaeologist blog has a good guide to visiting the site.
 Dave Petley is the Vice-Chancellor of the University of Hull in the United Kingdom. His blog provides commentary and analysis of landslide events occurring worldwide, including the landslides themselves, latest research, and conferences and meetings.
Recent Comments