13 September 2012
Ten years of collecting landslide fatality data
Ten years ago, on 1st September 2002, I started a small experiment to try to collect data on landslides that kill people. The key findings of that research to date were recently published in Geology, although I should note that the paper covered ony seven of the 10 years of data, and only covered non-seismic landslides. I am still happy to email a copy of the paper to anyone who wants it by the way, and hope that I will soon have an online version for free download (once the page charges have been paid by my university).
People often ask why I started to collect this dataset. The initial trigger was a question asked by a friend from another field, who enquired as to how many people die from landslides each year. I suddenly realised that not only did I not know, but that there was no credible dataset that addressed the question. I decided that the newly available news aggregator tools, such as Google News, might offer an opportunity to collect this sort of data, So I must admit that when I set out to do this I did not expect it to last long, or indeed to generate a scientically interesting dataset. That it has been both long-lived and scientically valuable has been a surprise.
The resulting dataset provides a very particular view of landslides. The focus on landslides that kill people means that those countries that have tried to reduce landslide losses do not appear strongly in the dataset, even though they may have many landslides, whilst those that have no such programmes tend to be heavily represented. A dataset on economic costs of landslides would have a very different spatial distribution of events (with the highest costs being in more developed countries). Thus, this data should perhaps be seen as the realisation of landslide mortality risk. Even then there is a caveat. The dataset does not include a really large El Nino event, such as that in 1997. It is likely that the spatial distribution of landslides looks quite different in such years. Thus, the dataset will not be truly representative until it covers such an event. I am guessing that this shortcoming will be put right in the next few years, and with an E Nino starting to develop at the moment, the next year could be very interesting.
So let’s briefly examine the ten years of data. The graph below shows the cumulative total number of fatalities from landslides over the ten-year period. I have recorded a total of 89,177 fatalities from landslides in the decade, which of course represents an annual global toll of almost 9,000 people per year.
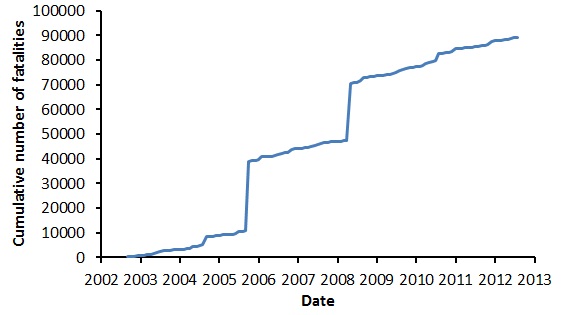 The dataset is dominated by two large steps – one in October 2005 and the other in May 2008. These are the landslides triggered first by the 2005 Kashmir earthquake in Pakistan and India, and second by the 2008 Wenchuan earthquake in China. It could be that the occurrence of two large earthquakes in mountain areas is unusual, inflating the overall totals in comparison with other decades. Time will tell. I should also note that I recorded almost no fatalities from the 2010 Haiti earthquake, even though it is likely that many of the deaths were associated with slope failures under slum houses. In this way, and in the sense that it is likely that I have missed some events, the dataset is almost certainly an under-representation of true landslide losses.
If earthquake-induced fatalities are removed then the graph of the cumulative total number of fatalities looks like this:
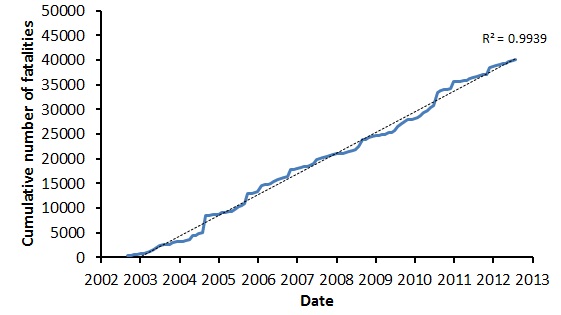 In total, I have recorded 40,123 non-seismically induced landslide fatalities in the ten year period. The black dotted line above is the automatically-generated linear best fit line for the data (for illustration purposes only of course). It is remarkable just how linear the trend is over this time period. The last year or so appears to be a comparatively low landslide period, whilst 2010 was notably higher. This is likely to reflect aspects of the global atmospheric system (for example the ENSO cycle, the state of the Asian monsoon, and the rather complex patterns of occurrence of landfalling tropical cyclones). However, in many ways this dataset is analogous to a weather dataset. In the case of the latter 30 years of data are needed before a statistically-significant trend analysis can be undertaken. Unfortunately, it is likely that I have a another 20 years of data collection to undertake before the long-term trend can be properly interpreted. Thus, this research will take me to, and perhaps even beyond, my formal retirement point. It will truly be my lifetime’s work.
12 September 2012
The catastrophic loss of Arctic Sea Ice and its implications for landslides
This summer has seen an extraordinary melt season in the Arctic, which has led to a catastrophic and unprecedented loss of sea ice. The rate at which the Arctic Ocean has lost ice volume is illustrated brilliantly by a series of graphs on Jim Pettit’s website. These graphs make depressing viewing – there can be no clearer illustration of the environmental impacts that our reckless global-scale atmospheric chemistry experiment is having. To me perhaps the most dramatic is this graph of the PIOMAS data on Arctic Sea Ice Volume:
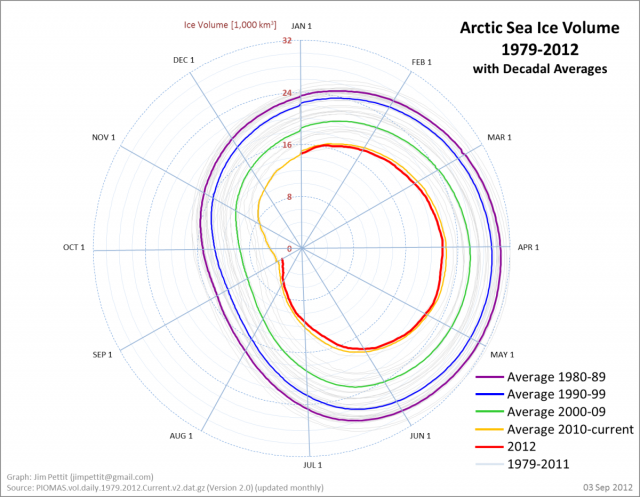 This is the graph that some are terming the “Death Spiral”, although I think that such superlatives can be a little unhelpful. It is not hard to see the way in which the loss of ice volume has accelerated in recent years, or just how little there is left at the end of the summer melt season this year. A summer with an ice-free Arctic Ocean is quite within the bounds of possibility within a decade.
You may well be wondering what this has to do with landslides. Of course in the high latitudes, and at high elevations, there is a direct effect as melting permfrost is increasing the likelihood of landslides and rockfalls. However, there may well be a more subtle but significant effect. In a paper published this year, Francis and Vavrus (2012) suggested that there are some interesting effects of the changing temperature balance between the high latitudes and the mid latitudes in the Northern Hemisphere. Essentially this is the effect known as arctic amplification (AA), in which the high latitudes are warming more rapidly than areas further to the south. This in turn is changing the characteristics of the jet stream, which is a key factor in determining the weather conditions in the mid-latitudes of the Northern Hemisphere. The analysis suggested that as a result of AA, the jet stream is developing a structure that is more wavy, and this in turn is causing weather systems in the mid-latitudes to change more slowly. Thus, droughts, extreme rainfall events and even cold weather spells are likely to become more frequent and longer lasting.
This summer has of course seen a dramatic illustration of this, with extreme drought conditions across a large swathe of North America. In the UK we had a prolonged spell of wet weather in the first half of the summer – it ended just in time for the Olympics – which has meant that 2012 is the wettest summer in a century. The upshot has been landslides affecting the rail network, coastal cliffs and inland areas. Three people were killed by these landslides. It seems likely that such events will become more common across the mid-latitudes, interspersed with at least some rather intense cold weather spells and summer droughts.
Which of course brings us back to the Arctic sea ice. This exceptional melt season will further enhance AA, and there is a strong feedback mechanism operating in this area. Unfortunately, the loss of the ice causes a reduction in albedo (reflectivity), meaning that more heat is trapped in the ocean. The net effect is an acceleration of the warming trend in the high latitudes.
So, unfortunately, the loss of Arctic Sea Ice is likely to have an impact on landslides in the mid-latitudes. Just how intense this effect will be is unclear. We still have a great deal to learn about the ways that the different components of the climate system interact.
Reference
Francis, J. A. and S. J. Vavrus (2012), Evidence linking Arctic amplification to extreme weather in mid-latitudes, Geophys. Res. Lett., 39, L06801, doi:10.1029/2012GL051000.
Landslides and the red Yangtze River
An interesting story coming out of China today concerns the Yangtze River at Chongqing, upstream of the Three Gorges Dam. To the understandable consternation of local people, on Thursday the river developed an intense red colouration. Various news agencies have images of this phenomenon, but the Daily Mail has the best photo compilation that I’ve seen so far (and, as an aside, it is accompanied by the most amusing comments at the bottom of the page):

http://www.dailymail.co.uk/news/article-2199800/The-river-DID-run-red-Residents-Chinese-city-left-baffled-Yangtze-turns-scarlet.html?ito=feeds-newsxml
Inevitably, there is a great deal of speculation as to the cause of this change in colour, ranging from a “red tide” algal bloom (unlikely as this is marine phenomenon), pollution such as a toxic chemical spill (also unlikely given the scale – the Yangtze is a huge river at this point, such that this would need to be a huge input of chemicals), the Yunnan earthquake (again unlikely given the location of the affected area), or sediment generated by soil erosion and landslides. Incidentally, it is also being interpreted as an indicator of momentous events in China, with links being made to the forthcoming change in leadership of the country. It is slightly dispiriting that such interpretations are still made.
By far the mostly likely cause of the change of colour is a large-scale input of iron-rich sediment to the river. It is notable that a large flood wave passed down the river last week, caused by heavy rainfall in Sichuan Province. This was reportedly the largest flood wave for two decades. Thus, I would hypothesise that the intense rainfall caused extensive sediment mobilisation both in terms of landslides on slopes and debris already in the river, and that this has caused the change in water colour.
Of great interest to me is the question of where this sediment mobilisation occurred. One leading candidate might be the Wenchuan Earthquake area, where we know that very large quantities of sediment were released from the slopes. Could it be that this is the main part of that sediment plume passing downstream? If so, I am surprised that it has taken so long, but it could be that a portion of the sediment has been stored in the channel and only mobilised during this extreme rainfall event. An alternative hypothesis that has been proposed is that this was caused by landslides on the banks of the Three Gorges reservoir, where we know that extensive mass movements are occurring. However, this appears to have occurred upstream of the Three Gorges reservoir, so that is highly unlikely. Alternatively, it could be that there is some other area in the Yangtze catchment that is suffering extensive landsliding, although it is not clear where and why this might be occurring.
None of the newspaper reports indicate that this change in river colour has a precedent in Chongqing, indicating that something out of the ordinary has occurred. It will be interesting to discover the nature of the causal event. But in the meantime, it is interesting to note that at time of writing this change in water-colour does not seem to feature on Xinhua News, the official Chinese news agency website.
10 September 2012
New video of landslides from the earthquakes in China on Friday
A really interesting video has appeared on Youtube showing the aftermath of the earthquake in China on Friday.
It shows both the range of slope failures during the event and the degree of chaos in the aftermath of the earthquake. Meanwhile, Xinhua appears to not be reporting much from the earthquake zone now, but the most recent update suggests 81 fatalities. It is not yet clear how many of these were associated with landslides, but the balance of the images of the disaster suggests that most probably were. This gallery of images on Xinhua for example includes three (out of five) that show landslides of one type or another:
7 September 2012
Possible landslides from the 2 x M=5.6 earthquake sequence in SW China this morning
As you may have guessed I have been on holiday! Anyway, normal service is now resumed.
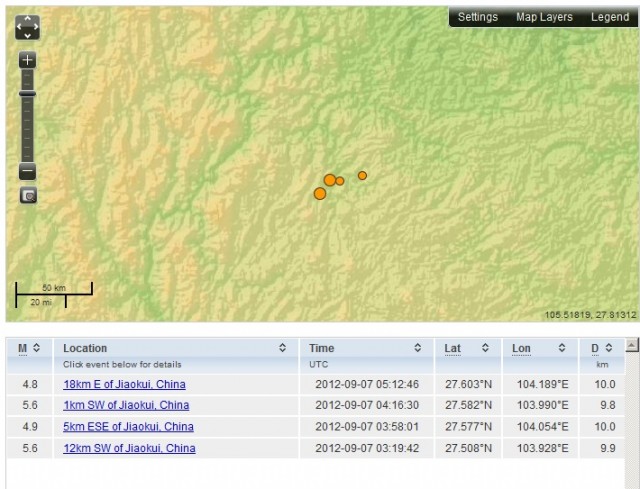
Early this morning Southwest China was shaken by four small earthquakes. Usually events of this magnitude – 5.6, 4.9, 5.6 and 4.8 (shown using a USGS screenshot above) – would not be sufficiently large to be worth reporting. Surprisingly though they appear to have caused considerable damage. Xinhua is currently report 50 fatalities and 160 people injured. This may increase in the next 24 hours as they are reporting that outlying villages remain isolated. The impacts are sufficiently large for the Chinese President to call for immediate assistance to the affected area, and for the Chinese Premier, who is himself a geologist, to head to the area.
Interestingly, already Xinhua is trying to explore why the impacts are so high for such small earthquakes. They pinpoint the level of poverty in the area (Yiliang County in Yunnan Province appears to be where the majority of the fatalities occurred), indicating low levels of preparedness. However, reading between the lines two other factors may be important. First, these very shallow earthquakes (approximately 10 km depth) had epicentres very close to the county town, which may have led to a high level of localised shaking that happened to overlap directly with an urban centre (in many ways this is similar to Christchurch in New Zealand). Second, the report does indicate a high level of landslides, noting that:
“Xinhua reporters in Luozehe saw big rocks, some as tall as four meters, tumbling down the mountain slopes and crashing onto the roads. Landslides were also triggered. A settlement of a zinc mine in Luozehe was seriously damaged. More than two dozen mining families have been evacuated out of their damaged houses. “It is scary. My brother was killed by falling rocks. The aftershocks struck again and again. We are so scared,” said miner Peng Zhuwen.”
The Earthquake Report blog also has reports about the location that indicate that landslides may have been a serious problem. For example, they report that:
– A reporter who was inspecting the area saw huge landslides on both sides of the valley.
– Roads are being blocked by huge rocks.
– A boulder measuring 36 meter was blocking the river, creating a small lake
– The houses of 30 families living near a zinc mine have all been damaged
– aftershocks are following each other very fast. More landslides and rockfall is being triggered by the many aftershocks
– rescue workers have still problems to reach some areas as roads are blocked
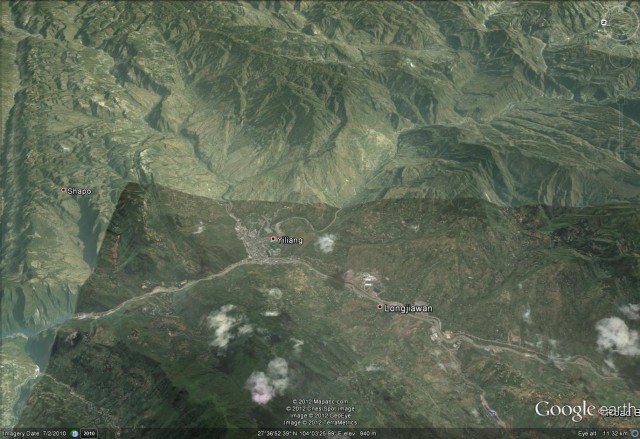
We may need to wait until tomorrow for a proper report of this event, but for now this is a Google Earth perspective view of the area around Yiliang. It is very steep, and hence is highly landslide-prone during seismic shaking:
16 August 2012
Global patterns of loss of life from landslides – my new paper in the journal Geology
The journal Geology has placed online a paper that I have written detailing the global cost of landslides worldwide. This is the definitive paper (so far) describing the results of my research over the last decade (I started on 1st September 2002, so am nearly at the tenth anniversary). Ironically, it is likely that today the total number of in the database, excluding landslides caused by earthquakes, will reach 40,000.
For copyright reasons I am not allowed to publish the paper online, but the publisher’s website for the paper is here. I have also placed some resources regarding the paper on our FTP site (if the link does not work try this address: ftp://topdog.dur.ac.uk/dnp/geology/ – WordPress seems to mangle the ftp address for some reason), and I am allowed to email a copy of the paper to you (so feel free to email me on: [email protected]
Anyway, this paper covers the period 2004-2010 (i.e. seven full years), and focuses on landslides caused by non-seismic processes (i.e. earthquakes are excluded). In that period, I have recorded 32,322 deaths in 2,620 landslides. This is about an order of magnitude more than previous records had suggested. The dataset includes a map of the fatalities, which indicates where the global hotspots lie. I have produced a colour versions:
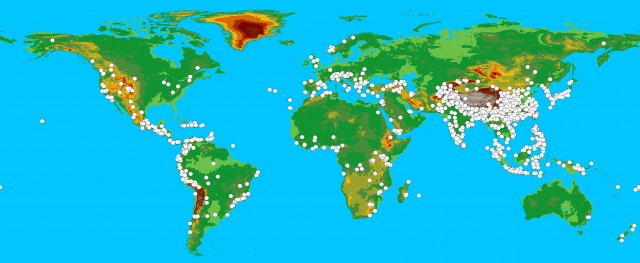 There is a high-resolution image of the on the FTP site for you to download as both a TIF and a JPEG.
The global hotspots that emerge for landslides are as follows:
- Along the southern edge of the Himalayan Arc
- Along the coast of southwest India and in Sri Lanka
- Along the southern and eastern coastal regions of China, extending inland ~100 km
- In central China, most notably in the mountains surrounding the Sichuan Basin
- In the mountain chains along the western edge of the Philippine Sea plate
- In the central Caribbean islands
- In a chain that follows the mountains of Central America and South America from Mexico in the north to northern Chile in the south
- In Indonesia, most notably in and around the island of Java
Not in the paper, but I have determined the number of landslides occurring in each of the key landslide countries worldwide. Remember that this data is for non-seismic landslides, and that it covers the period 2004-2010 inclusive:
| Country | Number of deaths in 2004-2010 | Number of landslides in 2004-2010 |
| Afghanistan | 67 | 9 |
| Bangladesh | 302 | 58 |
| Bhutan | 50 | 18 |
| Brazil | 823 | 88 |
| China | 6860 | 353 |
| Colombia | 564 | 68 |
| Dominican Republic | 46 | 10 |
| Ecuador | 48 | 8 |
| El Salvador | 197 | 18 |
| Guatemala | 2001 | 45 |
| Haiti | 4475 | 22 |
| Honduras | 52 | 12 |
| India | 2415 | 393 |
| Indonesia | 2078 | 164 |
| Italy | 67 | 14 |
| Jamaica | 20 | 10 |
| Japan | 147 | 70 |
| Kenya | 72 | 15 |
| Malaysia | 53 | 29 |
| Mexico | 318 | 53 |
| Burma | 211 | 12 |
| Nepal | 809 | 211 |
| Pakistan | 1023 | 102 |
| Papua New Guinea | 105 | 13 |
| Peru | 313 | 29 |
| Philippines | 4583 | 226 |
| Portugal | 70 | 8 |
| South Africa | 12 | 8 |
| South Korea | 74 | 16 |
| Spain | 15 | 12 |
| Sri Lanka | 81 | 21 |
| Taiwan | 693 | 44 |
| Tajikistan | 75 | 16 |
| Thailand | 134 | 20 |
| Turkey | 85 | 22 |
| Uganda | 408 | 15 |
| USA | 64 | 42 |
| Venezuela | 63 | 23 |
| Vietnam | 528 | 76 |
| Yemen | 121 | 9 |
15 August 2012
A video illustration of the impacts of riverbank collapse
This was apparently shot in Uttarakhand in India in early August. It occurred as a result of a period of unusually intense monsoon rainfall:
http://www.youtube.com/watch?v=xpFu6KJXZrE
The people in the area are impressively unflappable!
Landslides in Art Part 14: A Victorian railway painting
The previous edition of Landslides in Art Part 13 is here – this is an occasional series of images depicting the ways in which landslides appear in art works.
In this edition I have chosen to feature a colour lithograph dating from 1852 or 1853:
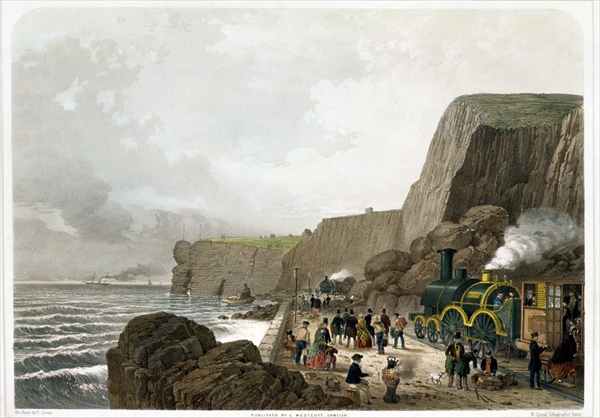 The image, for which I do not have the author, is entitled “South Devon Railway: Landslip near the Parson and Clerk Rock, Dec. 29th 1852”. The image appears to show a significant landslide on a coastal cliff in South Devon on the UK. The failure appears to consist primarily of large boulders, and the form of the scarp suggests perhaps a collapse defined by an existing defect, such as a sub-vertical joint.
The South Devon Railway is not the same as the tourist line that now carries the same name. This was the line between Exeter and Plymouth and Torquay in southern England, engineered by Isambard Kingdom Brunel. The line was opened in stages in the period from 1846 to 1849. It remains in use today. Thus the collapse appears to have occurred only a few years after construction, with the trigger being a large storm according to newspaper reports of the time. Think this is the site as it is today, based on a Google Earth perspective view. What appears to be the scar of the landslide in 1852 is still visible:
13 August 2012
Do watch this – probably the best ever debris flow video, from Austria last week
This remarkable video was recorded during heavy rainfall in the village of Virgen in Austria a little over a week ago:
The video catches the speed and power of these mudflows remarkably well. Note also the pulsing behaviour that they show, which is characteristic of these types of landslides, and also the very long wavelength standing waves that the flows created.
1 August 2012
28 killed in another mining landslide in China
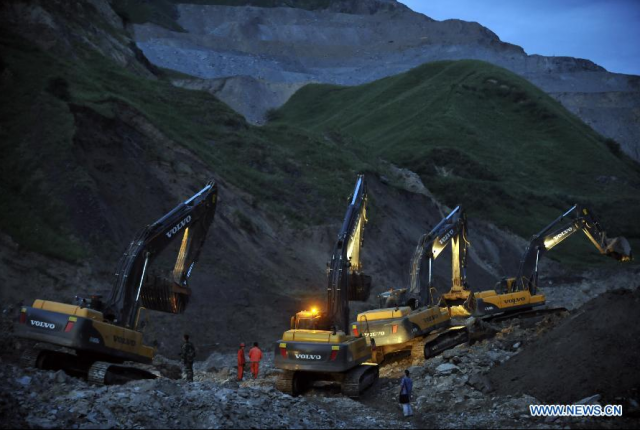
The list of mining-related landslides in China unfortunately became longer yesterday, with yet another fatal landslide at an iron ore mine. This time the failure occurred in Araltobe, Xinyuan County in Kazak Autonomous Prefecture of Ili, which is in Xinjiang Uygur Autonomous Region. The landslide occurred at lunchtime local time yesterday, burying a building occupied by 28 people. To date 18 bodies have been recovered, but there seems to be little hope of a positive outcome for the rest.
This is a large landslide – estimated to be a million cubic metres in volume, 2,000 m in length, 50 m wide and with a depth of 6 m. There is a high quality image gallery of the site here, but none of the pictures provide an overview of the landslide. The one that best indicates what happened is this one, but even that is less than clear:
 According to the Geonames search engine, Araltobe is at 43.4 N, 83.7 E. The only obvious quarry that I can find in the Google Earth imagery of this area is this one:
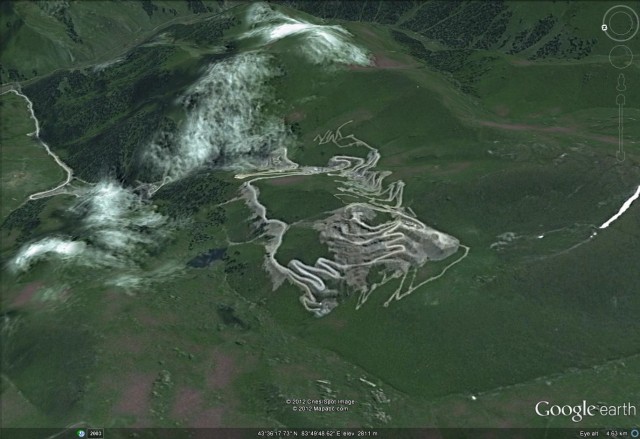 But the imagery is nine years old and there are a couple of other sites in the area that look like they were about to be developed as a quarry.
The incidence large-scale mine-related landslides in China is remarkably high. Here is another example from just a year ago, and one from 2009. There have been many others.
Meanwhile, out in there Pacific there are now two intense typhoons, both on tracks that will make landfall in China over the next few days. The Japan Meteorological Agency has this amazing radar image that captures them both:
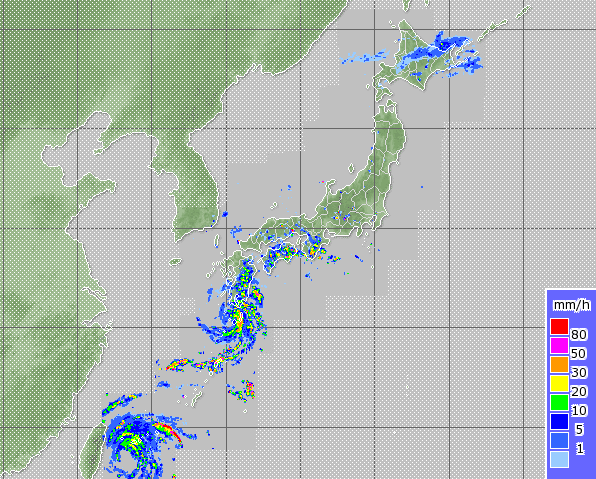 The one to the south, just east of Taiwan, is the source of real concern at the moment. This typhoon, called Saola, is moving very slowly. Whilst this is good for wind damage, it is exactly the scenario that leads to very high rainfall totals, which in turn leads to landslides and floods. It is currently forecast to cross the northern side of Taiwan in two days time, and then to landfall in China a day later. This has brought over 300 mm of rainfall to parts of Taiwan already today, on top of similar amounts yesterday:
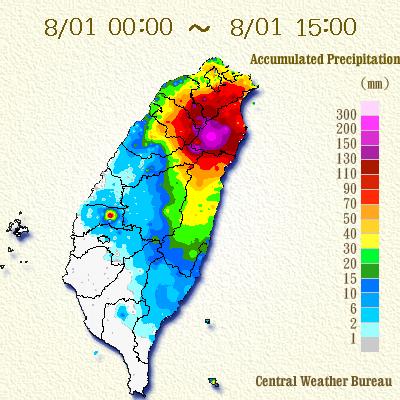 Expect similar, or possibly higher, totals over the next couple of days. Landslides and floods seem inevitable.



 Dave Petley is the Vice-Chancellor of the University of Hull in the United Kingdom. His blog provides commentary and analysis of landslide events occurring worldwide, including the landslides themselves, latest research, and conferences and meetings.
Recent Comments