2 June 2008
May 2008 Landslide map
Posted by Dave Petley
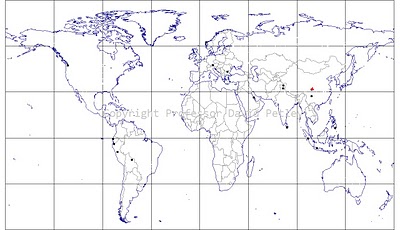
The map below shows the distribution of fatal landslides for May 2008. At the moment I am not including the landslides associated with the Sichuan earthquake as I cannot yet estimate the impacts of them. Clearly the numbers of landslides and the numbers of fatalities will dwarf the numbers below. I will try to ascertain the magnitudes in due course, though this is very challenging. I have included reported rainfall-triggered landslides in the aftermath of the earthquake, though again this is likely to be an underestimate.
The statistics are:
Number of fatal landslides (excluding those triggered by the Sichuan earthquake): 21
Number of fatalities: 280
May was once again very substantially below the average number of fatalities for may in 2003-2007, which is 336 deaths . In my post on the April figures I said that May “could be an interesting month!” I was right, but for the wrong reasons. The distribution is again fairly well-scattered, but as we come into the wet season it is increasingly focussed on Asia. The red triangle represents Sichuan.
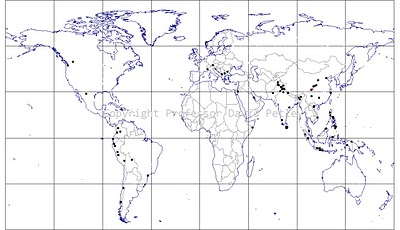
The patterns that were starting to emerge in the annual map last month are now strengthening. In particular the inevitable clusters in the Himalayas, western Central America, the Philippines and Indonesia are now clear. The cluster in the Himalayas is still focused on the west side at the moment as this area gets heavy rain in the early part of the year. The monsoon rains have now started in the very southern part of the Indian subcontinent and will now start moving northwards. This will drive the growth of this cluster. There are certainly more landslides in Central America than is normal.
So what of the month ahead? We, expect to see the number of fatal landslides increase markedly, especially in Asia. As the rains start in Central China landslides seem inevitable. As the La Nina conditions fade, we might expect to see fewer landslides in South America, but more in Asia.


 Dave Petley is the Vice-Chancellor of the University of Hull in the United Kingdom. His blog provides commentary and analysis of landslide events occurring worldwide, including the landslides themselves, latest research, and conferences and meetings.