27 March 2016
You Can Fool Some of The People All of The Time
Posted by Dan Satterfield

Greg Fishel is a fellow meteorologist who works on air in Raleigh, NC, and like me he is not afraid to tell the truth about climate science, in spite of the fact that some his viewers think it’s all a hoax. Like all of us, he often gets messages via email/social media purporting to show that he and every major science organization on Earth is wrong, and he had one just last week.
It turns out that this is a perfect example of how to fool some of the people all of the time, especially if their preconceived beliefs make them want it to be true. Science denial in all of its forms relies heavily on confirmation bias, and cherry picking to inspire doubt. This is true of vaccines, evolution, the Earth’s age, and especially climate change.

From teachthought.org
Greg was sent a link last week to a blog post by one of the top climate deniers out there, and I’ll quote his post on Facebook to explain it.
Via Greg: (My highlighting)
I was forwarded a tweet this morning from a well-known climate science skeptic site, “Real Science”, and the author is Steven Goddard, although some say this is just a pen name. Doesn’t matter. Check out his post:
https://stevengoddard.wordpress.com/…/03/23/falling-sea-le…/

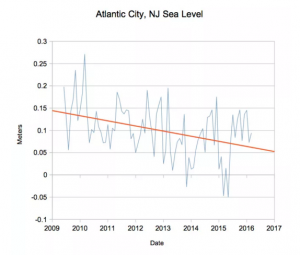
This is the graph that Steven Goddard posted showing sea level in Atlantic City.
He actually got the data from a NOAA site-Bravo! He shows a graph of sea level from Atlantic City, NJ during the period 2009-2016. It shows a steady decline. Well, I downloaded all the data and he’s right, the linear trend shows a decline over that period. This is where my support of this guy stops.
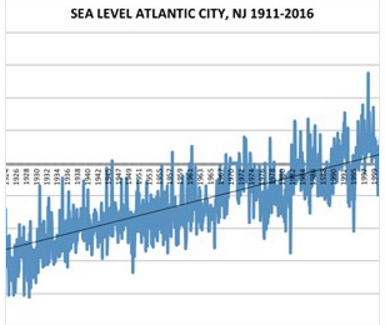
This is classic, unscientific cherry picking if there ever was such a thing. I reproduced his graph as you can see using Microsoft Excel. Now let’s look at the long-term record from 1911-2016. Well now, that long-term trend is a bit different isn’t it? Positive slope instead of a negative slope. So then I perused the data some more, and looked at the period 1972-1982. Voila! Another sign of declining sea level! Pretty soon, I’ll be able to walk miles out into the former ocean without drowning.
 In all seriousness, Steven, or whatever his name is should be ashamed of himself. Anyone can take a graph which features data of a cyclical nature, find the highest and lowest points over a relatively short period of time, and try to discredit the long-term average. This my friends is the pseudoscience, and is not the work of reputable, hard-working climate scientists, who are motivated by the desire to get it right to the best of their ability.
Real Science?
Hardly. (end of Greg’s post)
Yes, “Mr Goddard” picked just the right years in a very short-term period, and implied that this disproves sea level rise. Anyone with a science background knows that a graph of anything climate related over 7 years is nearly worthless, but someone looking for confirmation of their belief that scientists are lying to them, will accept this at face value. It’s the same as claiming that the climate is cooling by looking at the average temperature for one week in early September, and comparing it with another week in late November! In this case he had to pick just those years, otherwise it would show what really is happening.
The best propaganda is that which contains a truth which leads someone to believe a lie, and this is a classic. Scientists call this kind of thing cherry picking. Greg did his audience a great service by explaining to them what was happening here. Most folks only see one person with a science background on a regular basis, and that’s the guy giving the the forecast online or on TV. Those of us who do that take seriously our responsibility to give accurate science. I’ve known Greg many years, and he is one of the best.
Rules to remember:
- Beware of graphs about weather/climate that cover less than a thirty year period. You are probably being fooled.
- Check the background of the author of anything you see that differs from what college level text-books/NOAA/NASA says. Do they have science training in that specific field? In this case the real name is Tony Heller, and he has a degree in Geology. I see nothing in any peer-reviewed literature by him claiming that sea level is dropping in Atlantic City. You already know why.
- Conspiracy theorists like to claim that they have data that “THEY” do not want you to see, but it usually turns out that they are showing you a small part of it, or not understanding the data.
- Beware of any claim about the climate that relies on one or two places. Folks like Greg and I often get messages on cold days along the lines of “what do you think about climate change now?”. I had one last month, and replied correctly that is was the hottest month ever measured on Earth (I had no reply) .
- Everyone suffers from confirmation bias. Knowing this, and using the rules above, can warn you when someone is attempting to fool you.
I saw a poll this last week that 96% of AMS members ( I am one) believe that the climate is changing and over 80% believe that humans are involved. If you were to narrow the survey to those who work in the climate field (and are publishing science actively), it would be 99%. The public myth that scientists are divided about it is slowly eroding.


 Dan Satterfield has worked as an on air meteorologist for 32 years in Oklahoma, Florida and Alabama. Forecasting weather is Dan's job, but all of Earth Science is his passion. This journal is where Dan writes about things he has too little time for on air. Dan blogs about peer-reviewed Earth science for Junior High level audiences and up.
For what it’s worth, ‘Steven Goddard’ is a pseudonym used by Tony Heller.
“Steven Goddard” is the alias name of Tony Heller who has been lying to his audience for years pretending to be a scientist.
=> https://tonyhellerakastevengoddardisnotasociopath.wordpress.com/who-is-tony-heller/