23 February 2012
Ice Loss, Snowfall and Blowing Dust- The view from Space.
Posted by Dan Satterfield
From JPL: PASADENA, Calif. – In the first comprehensive satellite study of its kind, a University of Colorado at Boulder-led team used NASA data to calculate how much Earth’s melting land ice is adding to global sea level rise.
Using satellite measurements from the NASA/German Aerospace Center Gravity Recovery and Climate Experiment (GRACE), the researchers measured ice loss in all of Earth’s land ice between 2003 and 2010, with particular emphasis on glaciers and ice caps outside of Greenland and Antarctica. The total global ice mass lost from Greenland, Antarctica and Earth’s glaciers and ice caps during the study period was about 4.3 trillion tons (1,000 cubic miles), adding about 0.5 inches (12 millimeters) to global sea level. That’s enough ice to cover the United States 1.5 feet (0.5 meters) deep.
“Earth is losing a huge amount of ice to the ocean annually, and these new results will help us answer important questions in terms of both sea rise and how the planet’s cold regions are responding to global change,” said University of Colorado Boulder physics professor John Wahr, who helped lead the study. “The strength of GRACE is it sees all the mass in the system, even though its resolution is not high enough to allow us to determine separate contributions from each individual glacier.”
About a quarter of the average annual ice loss came from glaciers and ice caps outside of Greenland and Antarctica (roughly 148 billion tons, or 39 cubic miles). Ice loss from Greenland and Antarctica and their peripheral ice caps and glaciers averaged 385 billion tons (100 cubic miles) a year. Results of the study will be published online Feb. 8 in the journal Nature.
For more on GRACE, visit: http://www.csr.utexas.edu/grace and http://grace.jpl.nasa.gov .
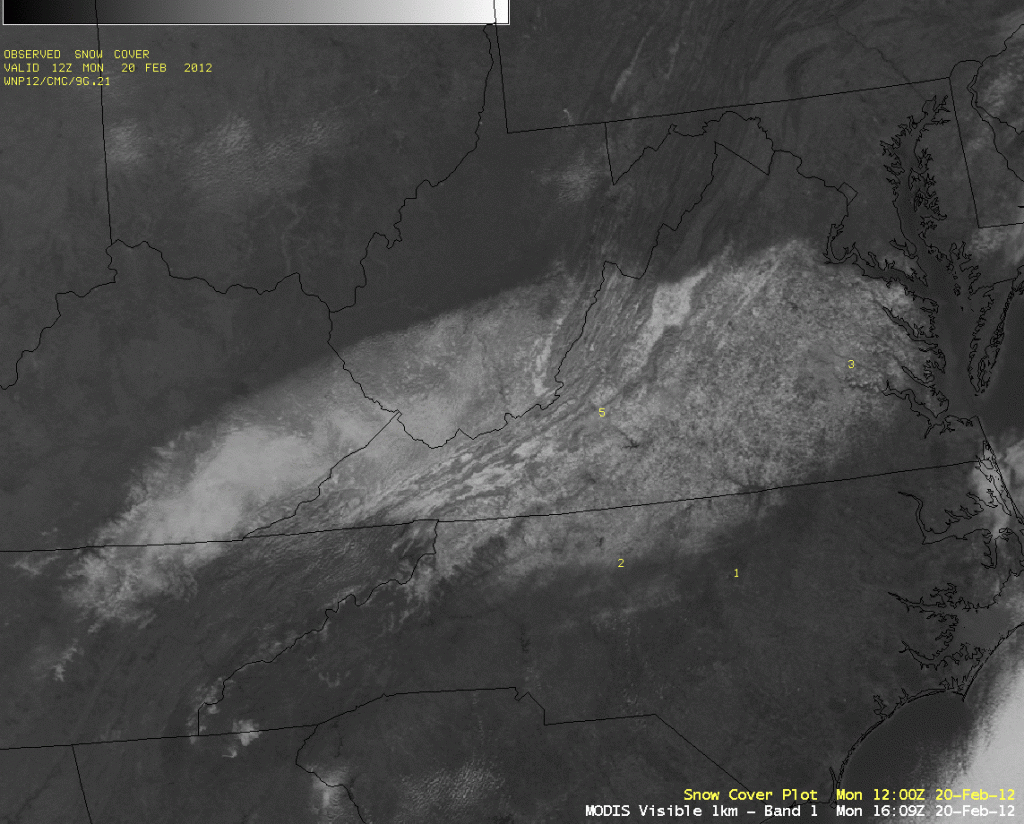
The snowstorm in the Mid Atlantic on Sunday left snow on the ground over much of the region. The view below is from the NASA MODIS sensor riding on the Terra and Aqua satellites. Using different wavelengths in the infrared, you can also tell the difference between cloud cover (white cloud) and white ground (in red). The other pic is in the visible portion of the spectrum. Hat tip to Scott Bachmeier’s CIMMS blog.
The new GOES R satellite which launches in 2015 will have many more channels in the IR and allow forecasters an even better view of snow and ice than is possible now. If you’re a weather geek in high school and are interested in this kind of science, then the Univ. of Wisconsin Atmos. Science program is the place to enroll!
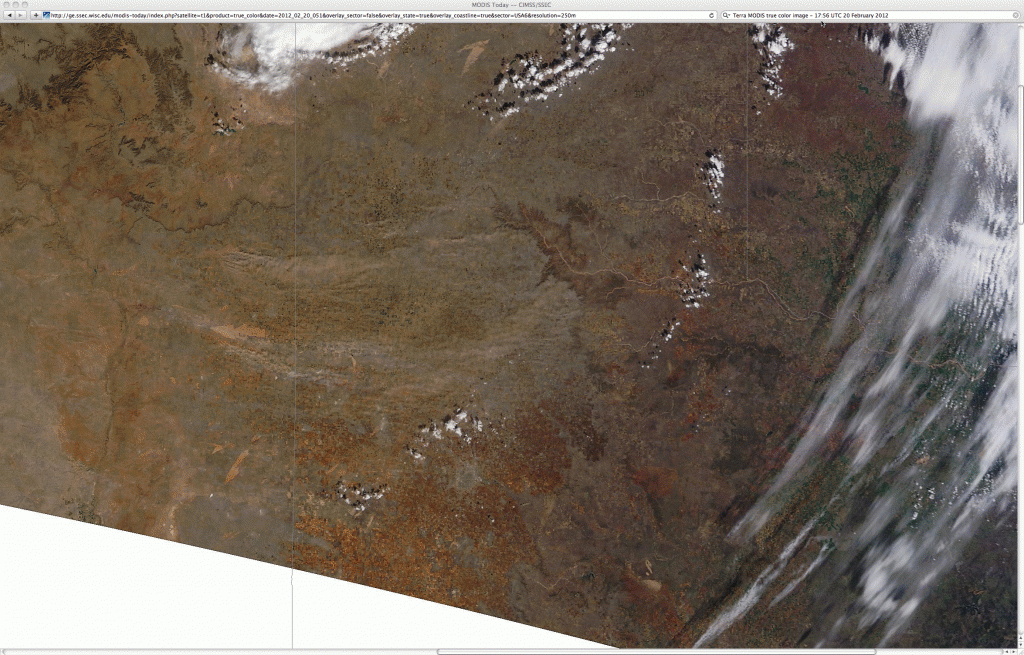
I’m back in Oklahoma for a few days to see my daughter, and as we drove in the sky had a LOT of dust in it Tuesday. This is not an unusual occurrence in Oklahoma, and the MODIS image below shows why. High winds blew the dust hundreds of miles from New Mexico. Saharan dust regularly makes it across the Atlantic to Florida in the warm season.


 Dan Satterfield has worked as an on air meteorologist for 32 years in Oklahoma, Florida and Alabama. Forecasting weather is Dan's job, but all of Earth Science is his passion. This journal is where Dan writes about things he has too little time for on air. Dan blogs about peer-reviewed Earth science for Junior High level audiences and up.
i had this for a while dan never ceast to amaze me way go dan ……O