
21 April 2023
Post-seismic evolution of landslides in the Wenchuan earthquake area
Posted by Dave Petley
Post-seismic evolution of landslides in the Wenchuan earthquake area
An area of great interest in landslide research in recent years has been the ways in which landslides evolve in the aftermath of earthquakes. It’s well-known that earthquakes trigger many landslides in mountain areas – sometimes tens of thousands of them. We also know that in some circumstances the number of landslides subsequently increases, most notably in the first very heavy rainstorm after the earthquake, as weakened slopes fail under conditions of high pore water pressure. What happens after this is less clear, and is probably dependent on the combination of topography, geology, earthquake magnitude and climate, amongst other factors.
The most spectacular coseismic landslide event of which I am aware was the 2008 Wenchuan Earthquake in China – we will reach the 15 year anniversary of this event next month. Landslides have been a very major issue in that area since the earthquake, most notably in the form of debris flows. A new paper published in the journal Engineering Geology (Zhang et al. 2023) has examined the evolution of debris flows in one area of the 2008 Wenchuan earthquake zone over a ten year period after the earthquake. Mapping was undertaken with multiple epochs of satellite data, allowing characterisation of 25 areas that has loose deposits present, and the determination of the normalized difference vegetation index (NDVI), which is a well-established way to assess the density of vegetation. The assumption was that the vegetation density is a proxy for landslide activity.
There is a lot of detail in the paper, but this diagram is worth highlighting:-
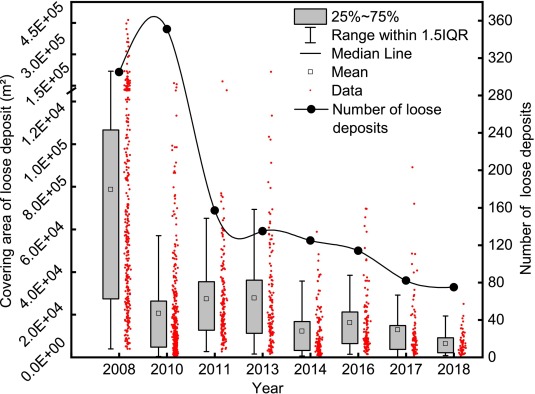
Graph indicating landslide activity in the area of the Wenchuan earthquake over time. Graph from Zhang et al. (2023).
.
This is an imperfect diagram, with both grammatical errors and, more importantly, real problems with the scaling of the x-axis. But the results are really interesting. Loose deposits are the source of the debris flows that has affected this area since the earthquake. The black line indicates the number of areas of loose deposits that were mapped, and the red dots indicate the surface area of each of those areas, with the box and whiskers summarising the latter data. The large number of loose deposits in the immediate aftermath of the earthquake is clear. In the first epoch after the earthquake this number increased, but the mean area of each area reduced. By 2011 the number had reduced dramatically whilst the mean area increased slightly. Thereafter, there was a steady decline in both indicators that continued throughout the remainder of the ten years.
The results support previous observations – the earthquake triggers many landslides, but that this subsequently gets worse due to heavy rainfall. The situation starts to recover thereafter – the data indicates that after three years the landslide sources have reduced significantly, perhaps in part because debris had been mobilised and removed, and in part because vegetation is recovering. However, the amount of landsliding remained elevated ten years after the earthquake – longer than was observed in Taiwan after the 1999 Chi-Chi earthquake for example – albeit on a declining trend.
.
Reference
Zhang, S., Peng, J.Y., Zhang, M.P. et al. 2023. Evolution of debris flow activities in the epicentral area, 10 years after the 2008 Wenchuan earthquake. Engineering Geology, 319, 107118. https://doi.org/10.1016/j.enggeo.2023.107118.
 Dave Petley is the Vice-Chancellor of the University of Hull in the United Kingdom. His blog provides commentary and analysis of landslide events occurring worldwide, including the landslides themselves, latest research, and conferences and meetings.
About the time I was taking my first course in geology, I saw dust plumes in the hills from coseismic debris avalanches. Later I learned to pay attention to antecedent precipitation (in the San Andreas Fault Zone). Now antecedent seismicity. What other elements have I neglected?
Neither the x-axis nor the first y-axis make any sense. It’s disappointing that this passed review in Engineering Geology.
Food for thought for landslide students dealing with post-Gorkha earthquake landslides’s status.