24 February 2013
An intrepretation of the Mount Dixon rock avalanche in New Zealand using satellite imagery
Posted by Dave Petley
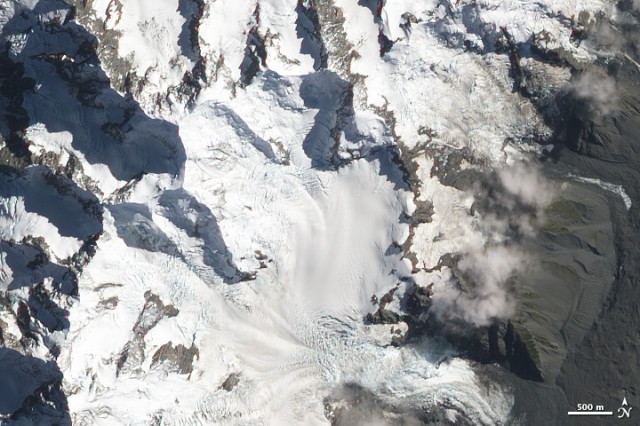
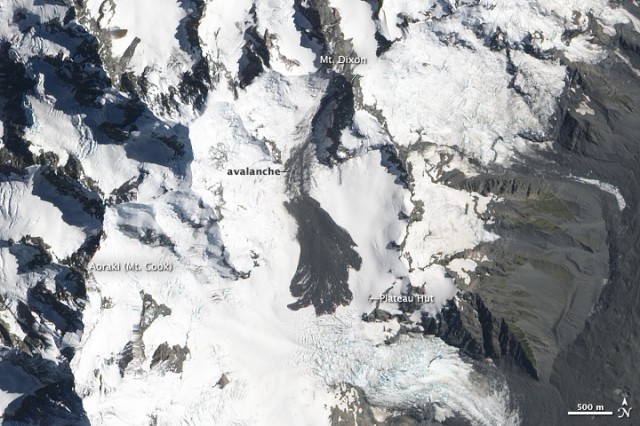
Last month I posted on a couple of occasions about the Mount Dixon rock avalanche in New Zealand, which was caught on a memorable video by Neil Wiltshire. In the aftermath of the landslide, NASA collected a satellite image of it using their EO-1 ALI instrument. This image, and a comparator image of the site before the landslide, are now available online.
As a reminder, this is the video that Neil Wiltshire collected of the landslide:
.
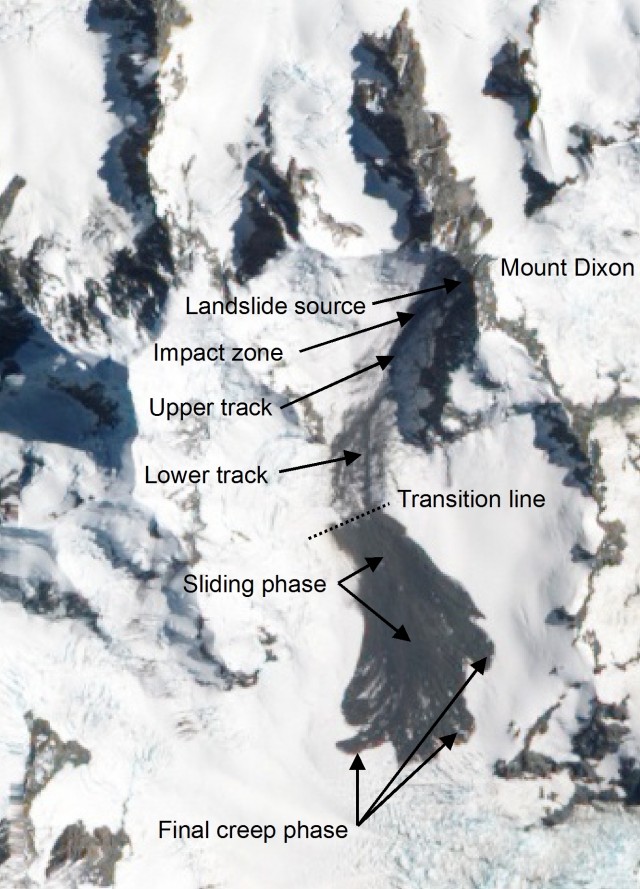
The comparison between the video and the image is very revealing. As I pointed out in my earlier post, the video shows that the landslide with through a rapid transition from a rock avalanche phase (basically a chaotic jumble of rock and ice moving at high-speed) into a sliding phase. If you look carefully at the above image you can see this transition line really clearly. I have annotated the image below to try to highlight the different phases of movement:
So my interpretation is as follows:
1. The landslide detached from the near vertical flank of Mount Dixon and fell about 500 metres;
2. In the impact zone it fragmented and transitioned into a rock avalanche
3. In the upper track the rock avalanche has left almost no debris and indeed appears to have eroded away a part of the glacier (in the centre of the track), which will have increased the volume of mobile mass through entrainment
4. In the lower track the rock avalanche starts to leave some small amount of material behind, suggesting the entrainment and deposition are starting to balance. Note that it appears that there are two different erosion tracks in this phase, with the split occurring just above the point that I have marked as lower track.
5. At the transition line the rock avalanche appears to suddenly change into sliding mode, and large-scale deposition starts
6. As the video shows the main landslide motion ends with a transition to a creep phase.
A really interesting question is what this transition point represents? Is this a point at which the slope gradient changes, which means that the landslide rapidly slowed? Or was the landslide losing velocity along track (imagine that velocity was initially high at the foot of the cliff, but the slope gradient was too low to allow that velocity to be maintained). Thus, did the landslide reach a point at which the velocity was too low to maintain an avalanche state? Or thirdly, intriguingly, was this change initiated by a change in the underlying glacier? Take a look at the “before” satellite image – you’ll see that the lower track is characterised by crevasses. At about the transition point this changes to smooth ice. So, did this change in the basal conditions lead to a change in the landslide?
Many people will now be working on this landslide, so I will leave it to them to sort it out. I will try to post again about the landslide when the research is published. There is no doubt that this will provide a significant insight into the somewhat enigmatic behaviour of these large landslides.


 Dave Petley is the Vice-Chancellor of the University of Hull in the United Kingdom. His blog provides commentary and analysis of landslide events occurring worldwide, including the landslides themselves, latest research, and conferences and meetings.
Three days ago I tried to add a comment to this post and have not yet released.
Is there a limit for extension? Maybe it was too long?
It is a very interesting case to discuss.
Greetings!
[Thanks, but there is no backlog of unapproved comments, so it must have got lost in the ether somewhere. D.]
Sure, It was too long… I will try shorter, but several comments:
– A huge collapse from the rock mass of the upper part. After the free fall and impact on the flank basis sure it becomes a rock avalanche.
– In the upper track (high velocity and slope) the snow-ice entrainment must be very significant, without deposit. I think that this fact is the key to understand the changing dynamics and the final reological behaviour.
– In the lower track, the movement mechanism is changing: from a rock avalanche (granular flow of rock solid particles fluidized in air matrix) to snow-rock avalanche (granular flow of rock particles in a snow (=ice+air) matrix). This track part must be quite similar to a snow avalanche, but some differences are relevant: the density is much higher (due the rock content), so the driving component is higher… but I am not sure about how the frictional resistance could differ from a snow avalanche… Perhaps is not increasing in the same degree. As you suggest, entrainment and deposition are starting to balance.
– The transition line that you marked, I think is mainly the slope change effect, corresponding to the inflexion point: upperwards the crevices of the glacier, and downwards the plateau. I think it is simply the begining of the deposition zone clearly visible in this post-event image (rock debris deposit without covering snow on surface).
– The final sliding movement is the deposition part. Is longer than a only-snow avalanche (longer time of slow movement) and longer run-out (across the entire plateau). Here it is very evident the creep effect. I thing that the content of wet snow is the key point differing from rock avalanche, and taking similarities with mudflow.