4 May 2012
One month from today…
Posted by Dave Petley
…is the opening of the 11th International & 2nd North American Symposium on Landslides in Banff, Canada. I will be attending, and on the first day will be giving the opening keynote lecture on “Landslides and engineered slopes: Protecting society through improved understanding”. In preparation for that, over the next month I will feature data from the Durham Fatal Landslides Database, which is the underpinning dataset for that presentation, without of course using any of the actual graphics from my talk or paper (I wouldn’t want to spoil the surprise for those who will be there!).
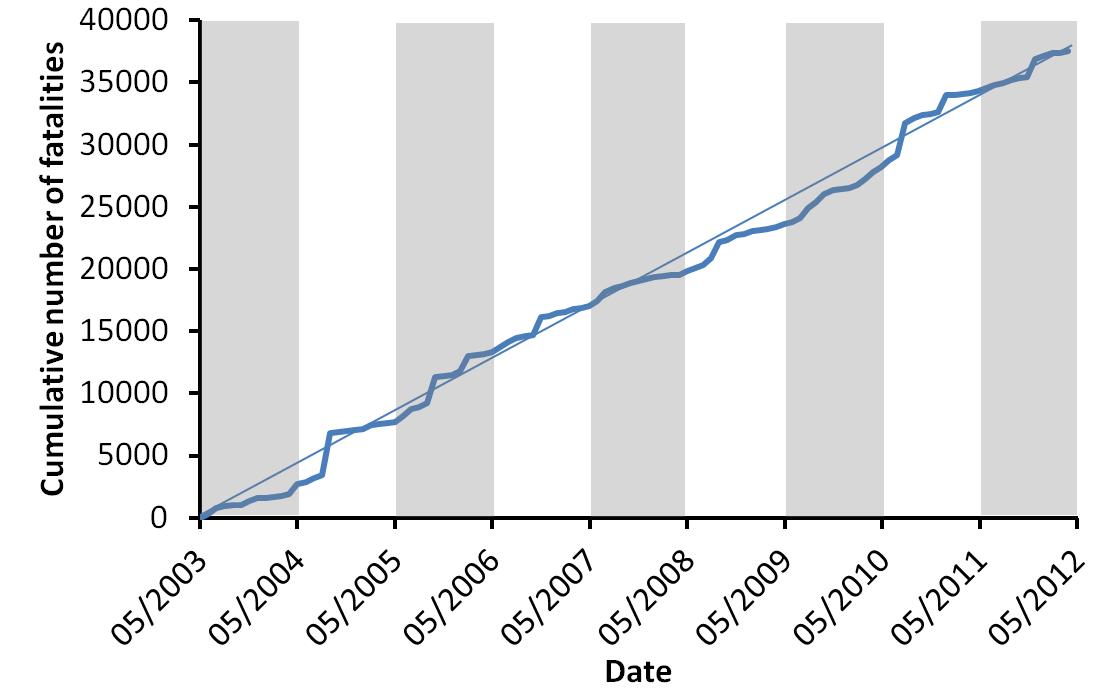
So, to start, this graph shows the cumulative number of people killed by landslides from May 2003 to May 2012:
Whilst it might seem strange to work with an annual cycle from May to April, the northern hemisphere Spring is the low point in the annual cycle of global landslides, with numbers starting to increase in early May as the rainy season begins in Asia. The interesting thing about the above graph, apart from the obvious high numbers of total deaths, is the way that each year varies from the long-term trend (which is shown by the thinner blue line). At the moment it is not entirely clear as to what controls this variation – I will explore this in a post next week.
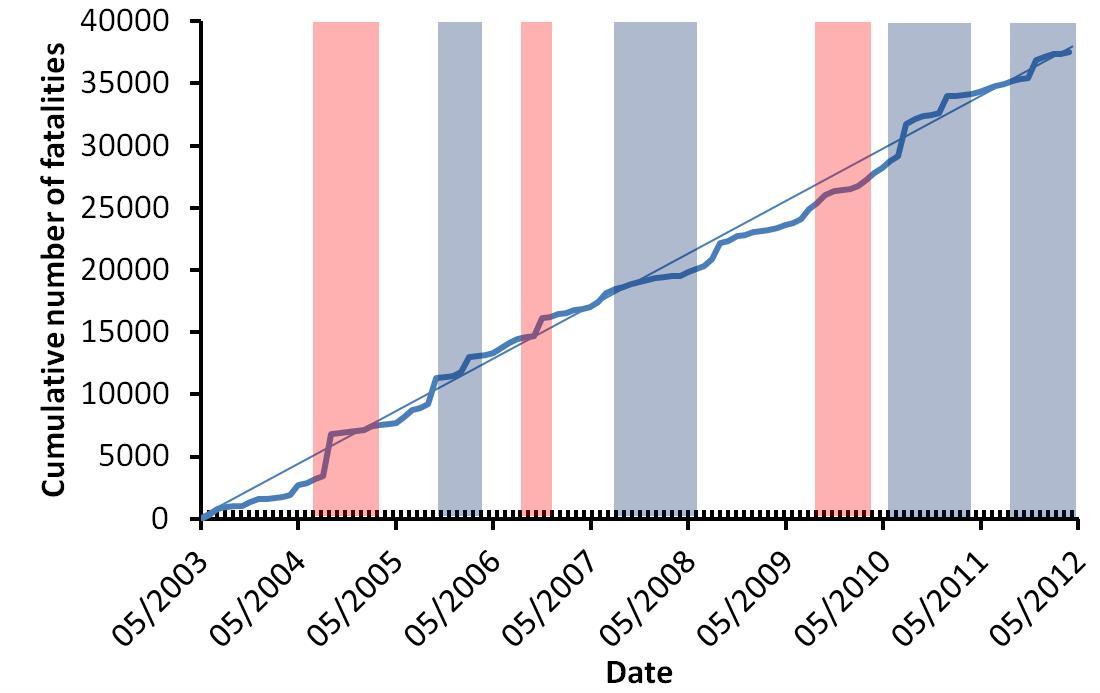
An interesting context to this dataset is the El Nino / La Nina cycle. It is generally thought that El Nino events change the distribution of landslides, and in particular induce an increase is landslides in some parts of the world. The graph below shows the same data, but this time with periods of a positive El Nino anomaly (i.e. when El Nino conditions are prevailing) in red and a negative El Nino anomaly in blue (data from the Climate Prediction Center). As expected, it is not the case that there is not a simple increase in landslide impacts in El Nino periods in El Nino conditions (real environmental datasets rarely show such simple relationships). The most striking thing is that the occurrence of El Nino conditions during this period has been so low – indeed neutral and La Nina conditions have dominated. It will be fascinating to see how this graph changes when we switch into a really strong El Nino event.


 Dave Petley is the Vice-Chancellor of the University of Hull in the United Kingdom. His blog provides commentary and analysis of landslide events occurring worldwide, including the landslides themselves, latest research, and conferences and meetings.