
June 5, 2023
Pyramid and Van Trump Glacier, Mount Rainier No Longer Glaciers-Thresholds Leading to Glacier Loss
Posted by Mauri Pelto
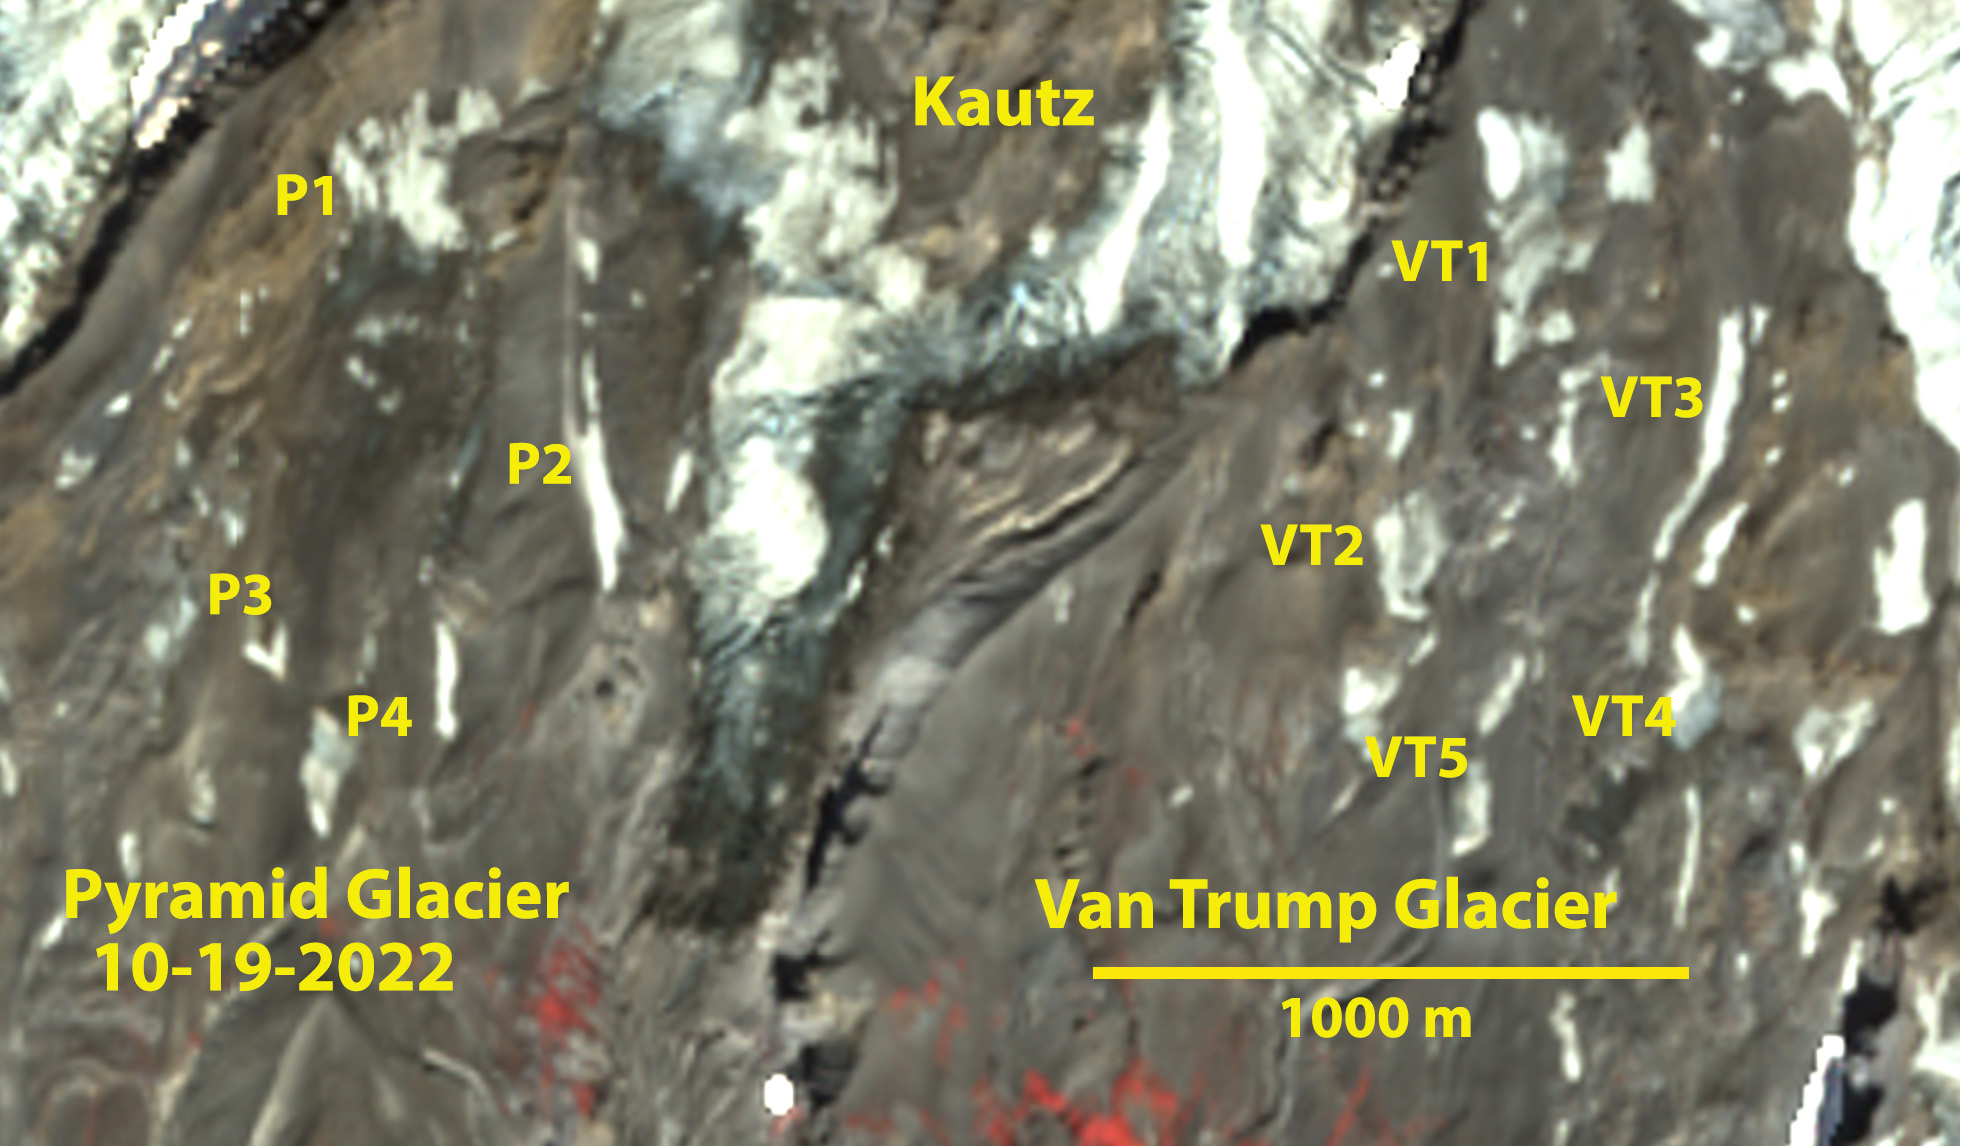
Van Trump (VT) and Pyramid (P) Snowfields Oct. 19, 2022 false color Sentinel image. VT1 and P1 are the largest at ~0.046 and 0.048 km² respectively.
Scott Beason, Taylor Kenyon, Rob Jost and Lauren Walker (2023) provide an excellent record of glacier extent change on Mount Rainier Glaciers for the 1896-2021 period. They note a 41.6% reduction in Mount Rainier glacier area during this 125 year period. This study identified Stevens Glacier as no longer existing as of Sept,. 2021. They also note that Pyramid and Van Trump Glacier are in serious peril having lost 33% of their area from 2015-2021. For Van Trump they mapped the combined area of six separate snow/ice areas at 0.117 km² (Beason et al 2023). For Pyramid they mapped the combined area of eight separate snow/ice areas at 0.176 km² (Beason et al 2023).
The summer of 2021 and 2022 both led to substantial mass losses in the Cascade Range, with many glaciers losing all snowcover. The typical minimum size threshold for a glacier is 0.1 km², with areas smaller than this to small to generate the ice motion that identifies a glacier from a perennial snowfield. On October 19, 2022 it is evident that there is no single ice mass/patch with an area of more than 0.05 km² for Pyramid or Van Trump Glacier. The collective five primary pathces of Van Trump combined = 0.114 km² and four on Pyramid Glacier combined=0.91 km². Smaller patches (crumbs) that add up to the minimum threshold as in this case, cannot be put together to qualify these as glaciers (cookies). Hence, it is evident that Van Trump and Pyramid Glacier as of 2022 do not meet the threshold to be glaciers. In the North Cascade Range I have witnessed a number of glaciers disappear including Hinman, Lewis, Lyall, Milk Lake, Snow Creek and Spider Glacier. This led to the identification of three key thresholds that lead to glacier loss.

Van Trump (VT) and Pyramid (P) Snowfields Sept. 25, 2019 false color Sentinel image, with USGS map above.
Threshold 1-Disquilibrium Response
Glaciers respond to climate in an attempt to achieve equilibrium. A glacier advances due to a climate cooling/snowfall increase that causes positive mass balance. A climate warming/snowfall decrease leads to negative mass balances and glacier retreat. To reestablish equilibrium a retreating glacier must lose enough of its highest ablating sections, usually at the lowest elevations, so that accumulating snows in the near the head of the glacier once again are equivalent to overall ablation, and an equilibrium balance is approached. This is the expected response for glaciers.
From 1984-2022 I have worked annually in the field on North Cascade glaciers monitoring their resonse to climate change. By 2005 it was apparent that many of the glaciers were experiencing a disequilibrium response, and were not able to reestablish equilibrium through retreat. This was not what I had expected in 1984, but in 2005 the disappearance of Lewis, Milk Lake and Spider Glacier had forced me to develop this model (Pelto, 2006). A glacier that is in disequilibrium with present climate will melt away with a continuation of this climate, because it cannot retreat to a point where it is sustaining. A key trait of a glacier in disequilibrium is when the glacier is experiencin significant thinning from the terminus through the accumulation zone.

Foss Glacier, North Cascades with bedrock emerging as glacier thins and fragments even near the top of the glacier.

Rapid area loss of Colonial Glacier, North Cascades not just at the terminus but also at the top of the glacier.
Threshold 2-Accumulation Zone Lacks Persistence
Temperate alpine glacier survival is dependent on the consistent presence of an accumulation zone (Pelto, 2010). The accumulation zone area is the region where snowcover persists through the year, and is referred to as the accumulaiton area ratio (AAR), typically 50-65% to be in balance. Low AAR values are indicative of the lack of a sizable accumulation zone during a specific year. Periodic years with low AAR values identify inconsistent accumulation zones. During consecutive years with low AAR values there is a loss of nearly all accumulated snow and considerable firn in the accumulation zone. The multiple annual firn layers exposed to ablation eliminates accumulation layers from the years when the AAR was higher. There are years where an accumulation zone exists, but this accumulation does not persist through the aforementioned years of extensive negative mass balances, hence there is no persistent accumulation zone. This is observed to have occurred on many North Cascade glaciers in 1992, 1993, 1994, 1998, 2003, 2004, 2005, 2009, 2014, 2015, 2019, 2020, 2021 and 2022. In 2005 and 2015 on Columbia Glacier the exposed annual layers in the accumulation zone are evident and indicate no preserved firn from recent years. This indicates no persistent accumulation zone, which leads to substantial thinning of the glacier in the accumulation zone
.
Columbia Glacier accumulation zone in 2005 in early August, with limited snowpack and many exposed annual layers.

Columbia Glacier accumulation zone in 2015 in early August, with limited snowpack and many exposed firn layers.

Down slope ice bands and surface roughness on Sholes Glacier with snowpack retained only on narrows strip of upper margin.
Threshold 3-Glacier Loss
If there is an ongoing lack of a persistent accumulation zone a glacier will disappear. Repeated consecutive years of exceptional mass loss, bring the process into clear focus. Many alpine glaciers have experienced this scenario in 2021-2022, resulting in a clear delineation of those that have no persistent accumulation zone. I have observed the disappearance of quite a number of glaciers after 40+ years of working in glaciated mountain ranges. It is no longer a shock. The pace is quickening, and the number of glaciers experiencing a disequilibrium response is skyrocketing.
Lewis Glacier in the North Cascade range melts away.

Milk Lake Glacier in the North Cascade Range disappears.

Hinman Glacier in the North Cascade Range disappears. Remanant small ice patches in 2021 Sentinel false color image.

Anderson Glacier, Olympic Range disappears. Green arrow is 1959 terminus, pink arrow is 1990 terminus location and red arrow is bare rock area that emerged from below the glacier in this 2009 Google Earth image.
 Dean of Academic Affairs at Nichols College and Professor of Environmental Science at Nichols College in Massachusetts since 1989. Glaciologist directing the North Cascade Glacier Climate Project since 1984. This project monitors the mass balance and behavior of more glaciers than any other in North America.
[…] recent satellite imagery, from October 2022, led glaciologist Mauri Pelto of Nichols College to conclude the Pyramid and Van Trump glaciers had also melted […]
[…] that the total area covered by glacier ice had shrunk by 42 percent between 1896 and 2021. (Another survey carried out in the fall of 2022 by a glaciologist, Mauri Pelto, concluded that the Pyramid and Van Trump had […]
[…] the whole space coated by glacier ice had shrunk by 42 minutest between 1896 and 2021. (One other survey carried out in the fall of 2022 by a glaciologist, Mauri Pelto, concluded that the Pyramid and Van Trump had […]
[…] that the total area covered by glacier ice had shrunk by 42 percent between 1896 and 2021. (Another survey carried out in the fall of 2022 by a glaciologist, Mauri Pelto, concluded that the Pyramid and Van Trump had […]
[…] that the total area covered by glacier ice had shrunk by 42 percent between 1896 and 2021. (Another survey carried out in the fall of 2022 by a glaciologist, Mauri Pelto, concluded that the Pyramid and Van Trump had […]
[…] that the total area covered by glacier ice had shrunk by 42 percent between 1896 and 2021. (Another survey carried out in the fall of 2022 by a glaciologist, Mauri Pelto, concluded that the Pyramid and Van Trump had […]
[…] that the total area covered by glacier ice had shrunk by 42 percent between 1896 and 2021. (Another survey carried out in the fall of 2022 by a glaciologist, Mauri Pelto, concluded that the Pyramid and Van Trump had […]
[…] that the total area covered by glacier ice had shrunk by 42 percent between 1896 and 2021. (Another survey carried out in the fall of 2022 by a glaciologist, Mauri Pelto, concluded that the Pyramid and Van Trump had […]
[…] área total cubierta por hielo glaciar se había reducido un 42 por ciento entre 1896 y 2021. (Otro estudio realizado en otoño de 2022 por un glaciólogo, Mauri Pelto, concluyó que el Pyramid y el Van Trump habían […]