
October 12, 2021
Sholes Glacier, WA and a Cascade of Ologies
Posted by Mauri Pelto
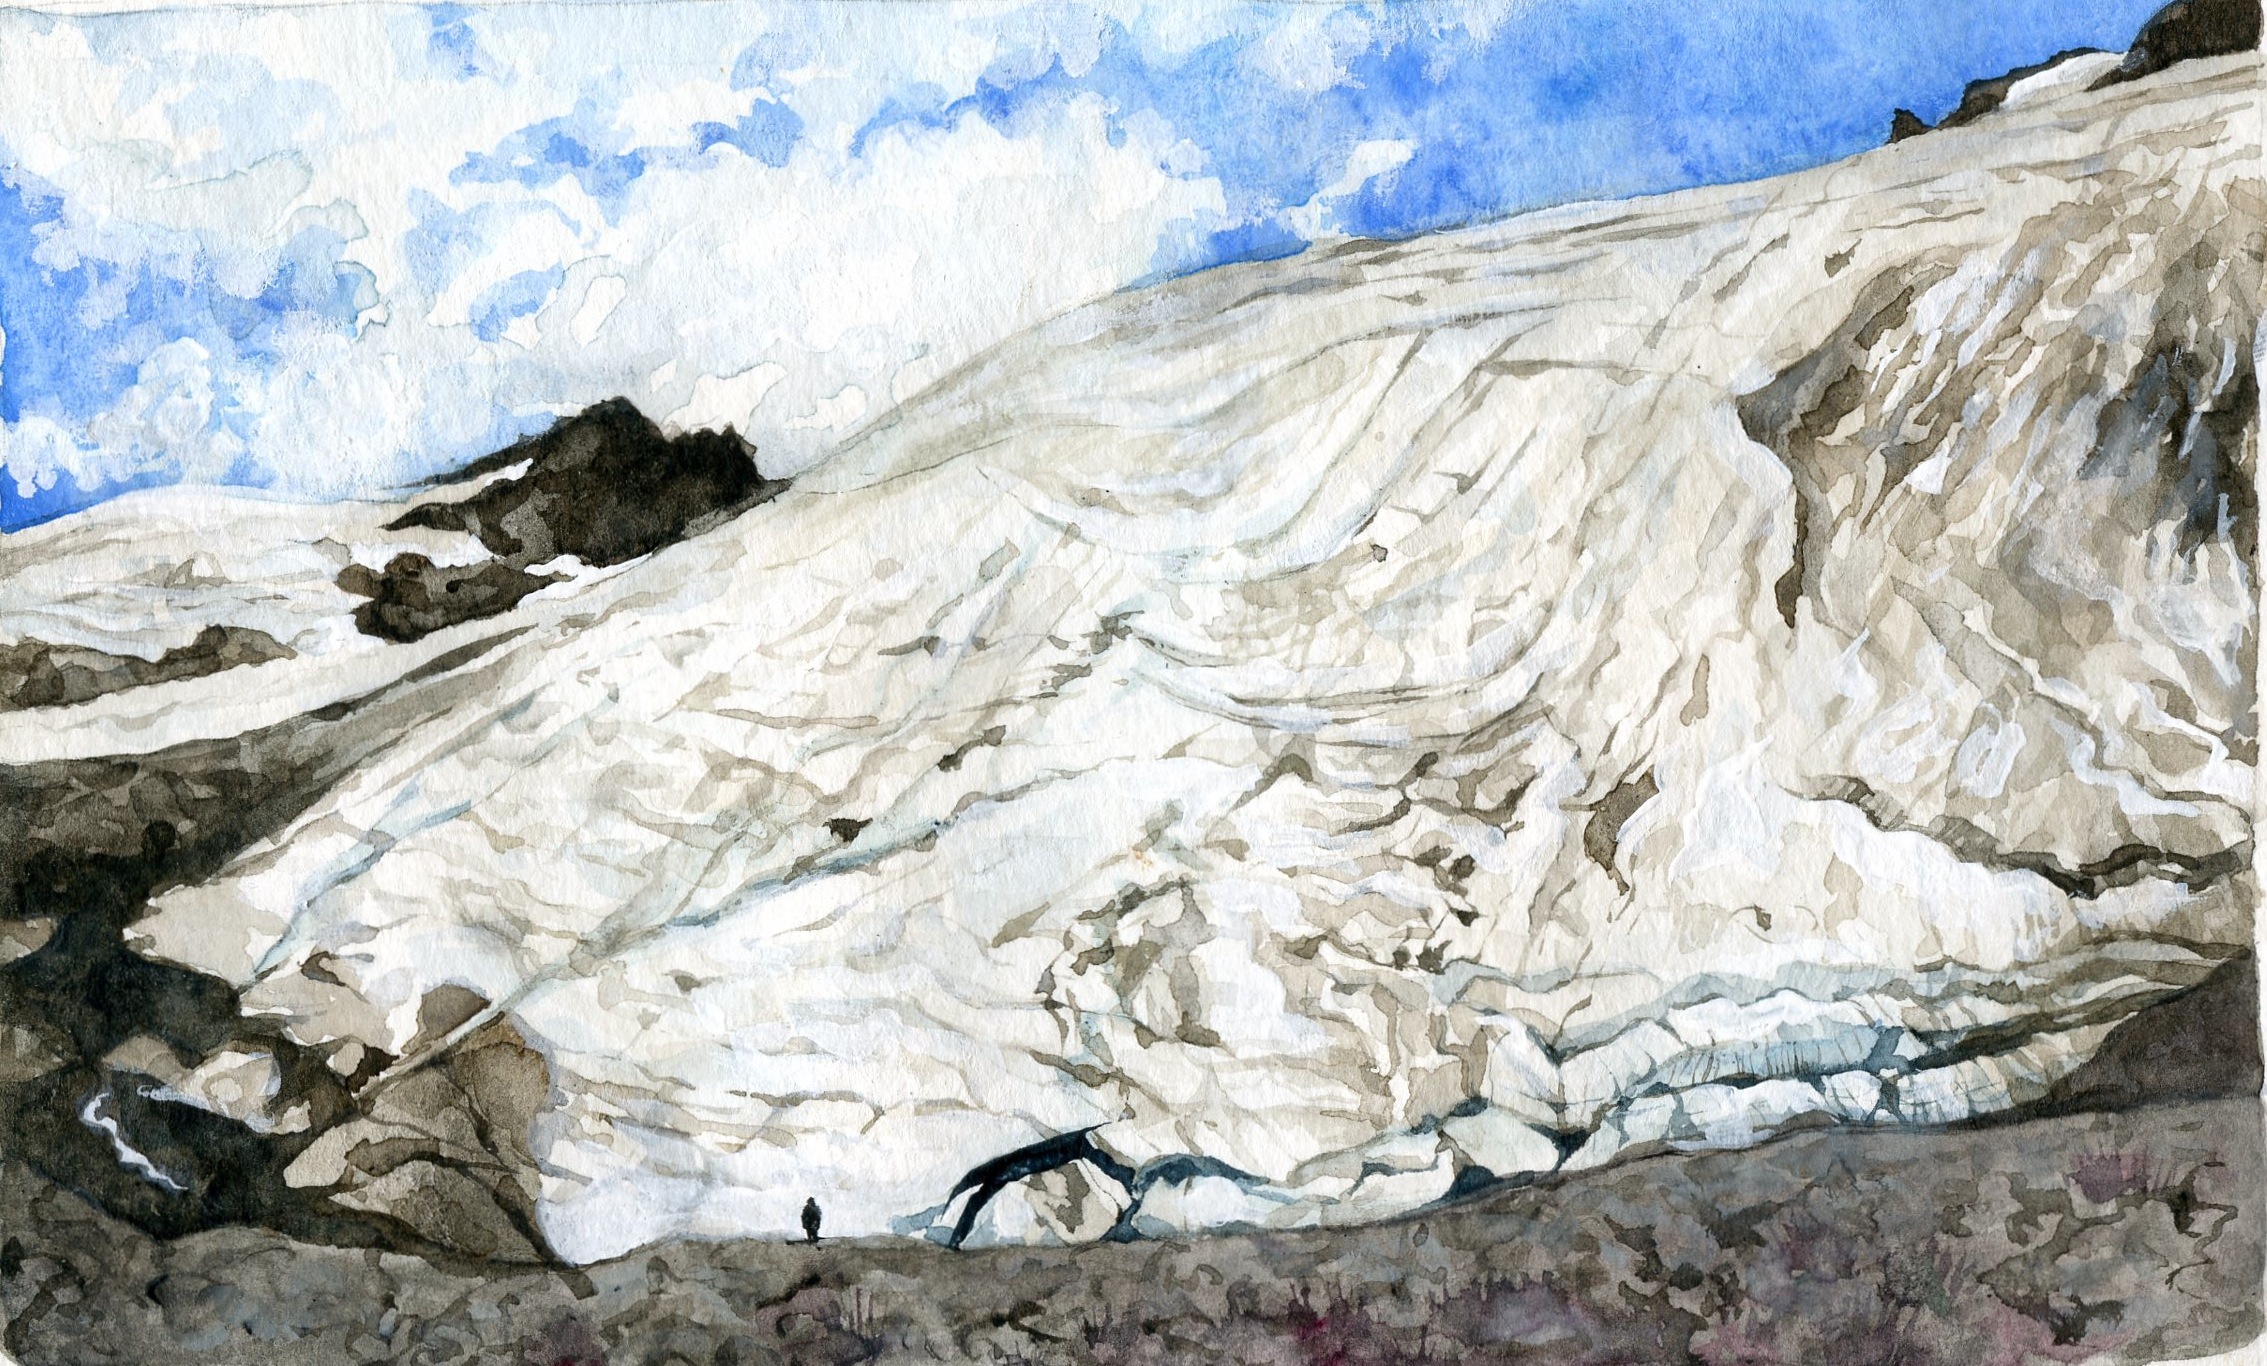
Watercolor painting of Sholes Glacier. The small figure is at the current terminus of the glacier, and the photo that inspired this painting was taken from where the glacier used to end about 35 years prior. By Jill Pelto
Sholes Glacier is on the northeast flank of Mount Baker, WA. We have spent the last 32 years completing detailed measurments on this glacier that has revealed a story of glacier mass balance loss, thinning, retreat, declining area, and a cascade of other consequences impacting other “ologies” beyond the glacier. If you are intrigued by many ologies, the Podcast by Allie Ward will be inspiring as it was to this title.
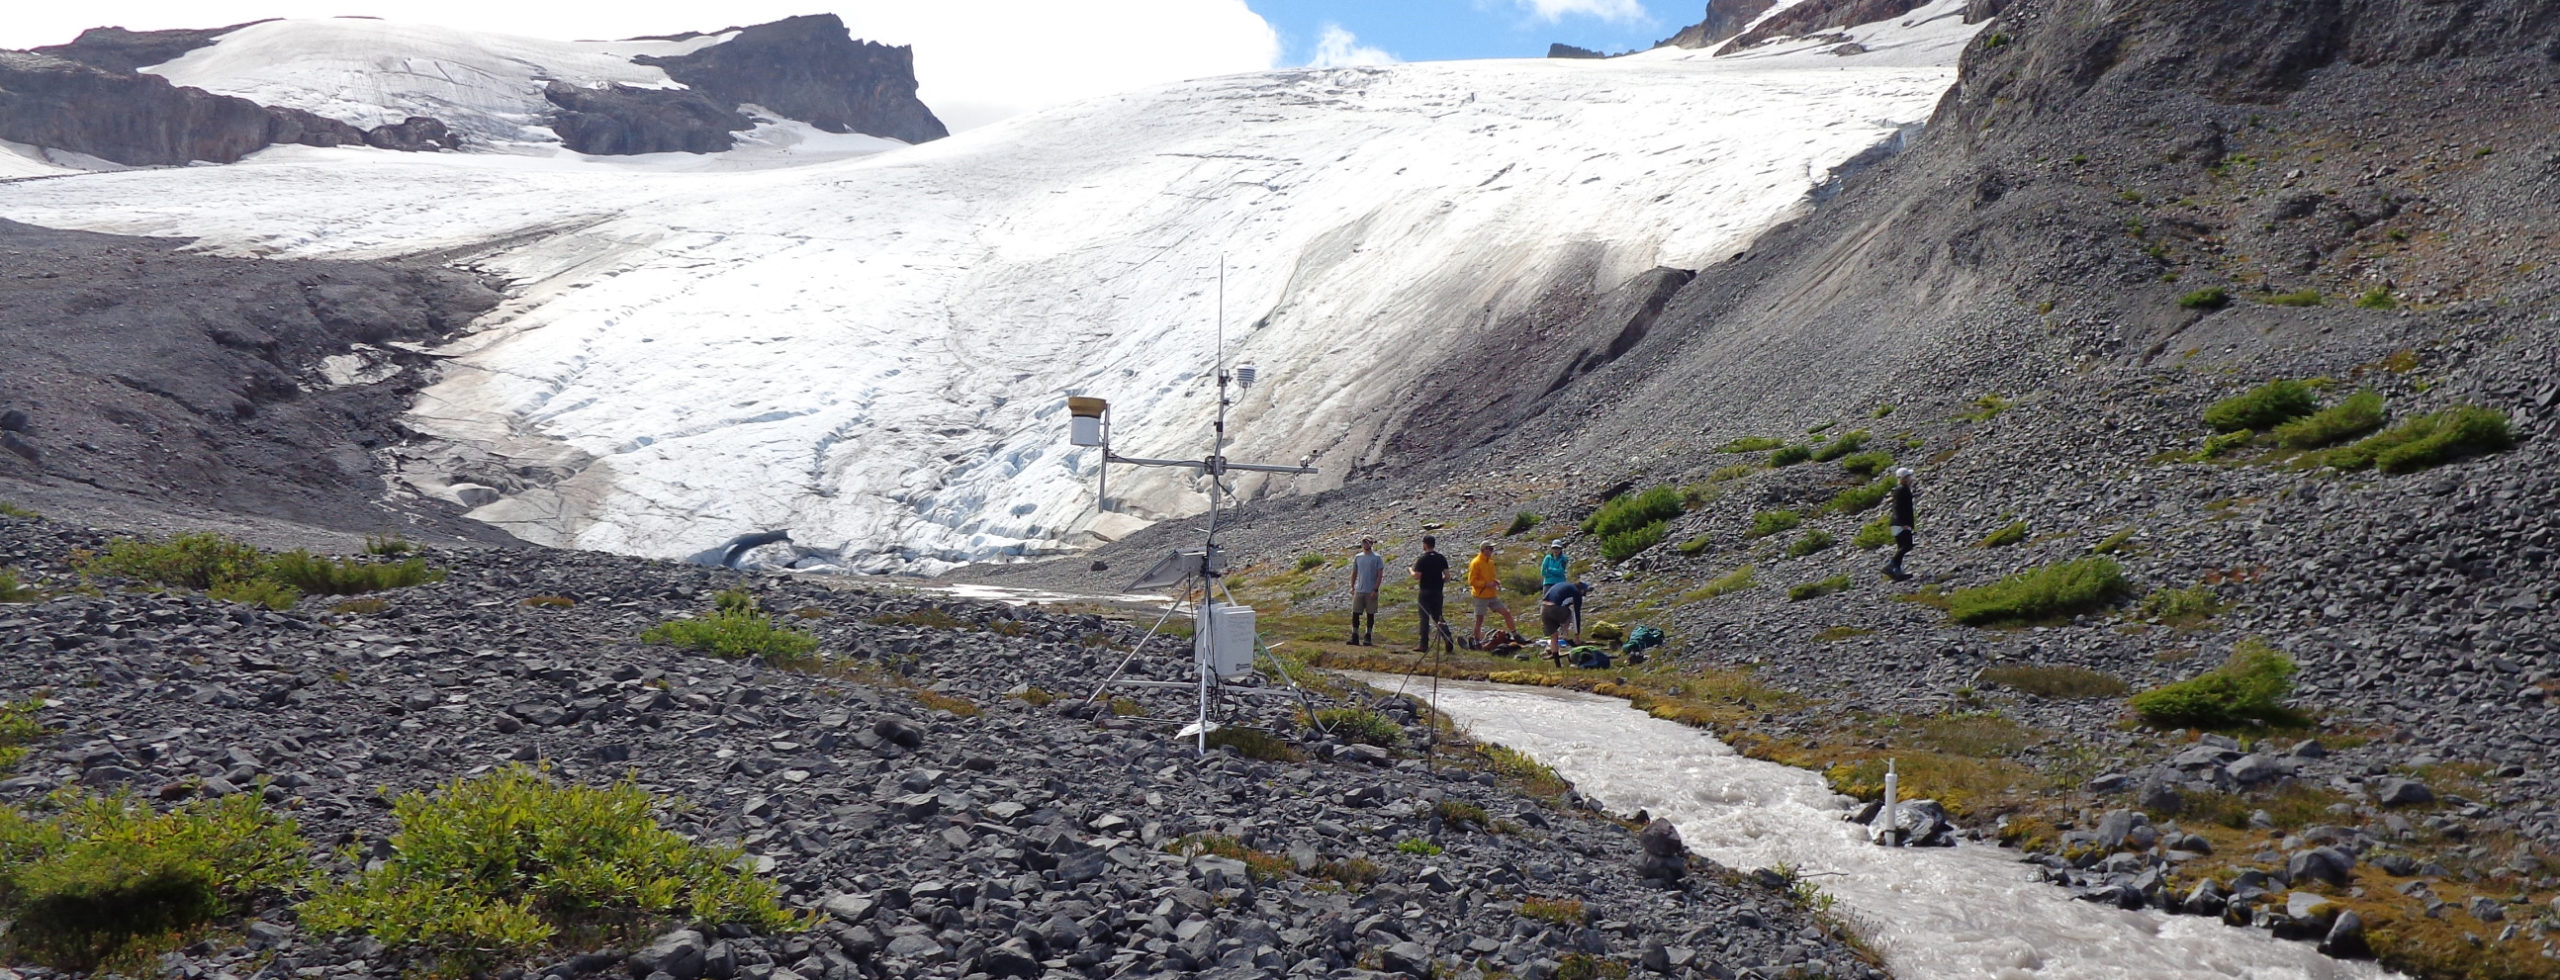
Sholes Glacier and stream gage station. We have constructed a rating curve for this station, that the Nooksack Indian Tribe maintains (Grah and Beaulieu, 2013).
The climatology of the region has shifted, with one key change being more frequent and intense heat waves. Glaciers and heat waves just are not compatible. Using daily maximum temperatures for the 1981-2021 period for Mount Baker from ERA5 temperature reanalysis, completed by Tom Matthews at Loughborough University, indicates that there have been 83 days where the maximum temperature exceeded 12°C, an average of 2 days/year. In the last five years there have been 22 days exceeding 12°C, over 4 days/year. There have been 16 days during 1981-2021 period when the maximum temperature exceeded 14°C, 75% (12) of these have been in the last five years.

Probing snow depth on Sholes Glacier in 2014, this is completed annually at a fixed network of over 100 locations.
In terms of glaciology the result of the climate shift is that the glacier has lost 25-30% of its volume from 1990-2021. The terminus has retreated 155 m while the area has decreased by 25%. The changes have been most rapid in the last 8 years. The two years of largest mass loss were 2015 and 2021. We measure both melting (ablation) on the glacier and runoff from the glacier. This combination allows determination of the amount of glacier runoff. During 24 heat waves in the region from 2009-2021 mean daily ablation during the heat waves has ranged from 4.5-7.2 cm w.e./day (w.e.=water equivalent). The highest rate of 7.2 cm was during the June 26-July 1, 2021 period.
Sholes Glacier in 2015 exhibiting the darkening of the surface that occurs in high melt years, increasing melt rates. How much black carbon and algae is part of this darkening is the research of Alia Khan (WWU).
For a glacier to be in equilibrium or have a positive mass balance the majority of the glacier must be in the accumulation zone, snow covered at the end of the summer, that is an accumulation are ratio (AAR) greater than 50%. Pelto and Brown (2012) noted that for Mount Baker an AAR of 60% is required for a break even balance for the year. From 2013-2021 the average accumulation area ratio has been 35%. For Sholes Glacier if 50% of the glacier is exposed ice and firn in early August that increases mass loss. The ice and firn for the same weather conditions have a 30-40% higher melt rate than the snowpack. An early season heat wave strips the snow off earlier exposing the darker faster melting glacier surfaces for longer further increasing mass loss, note image above.
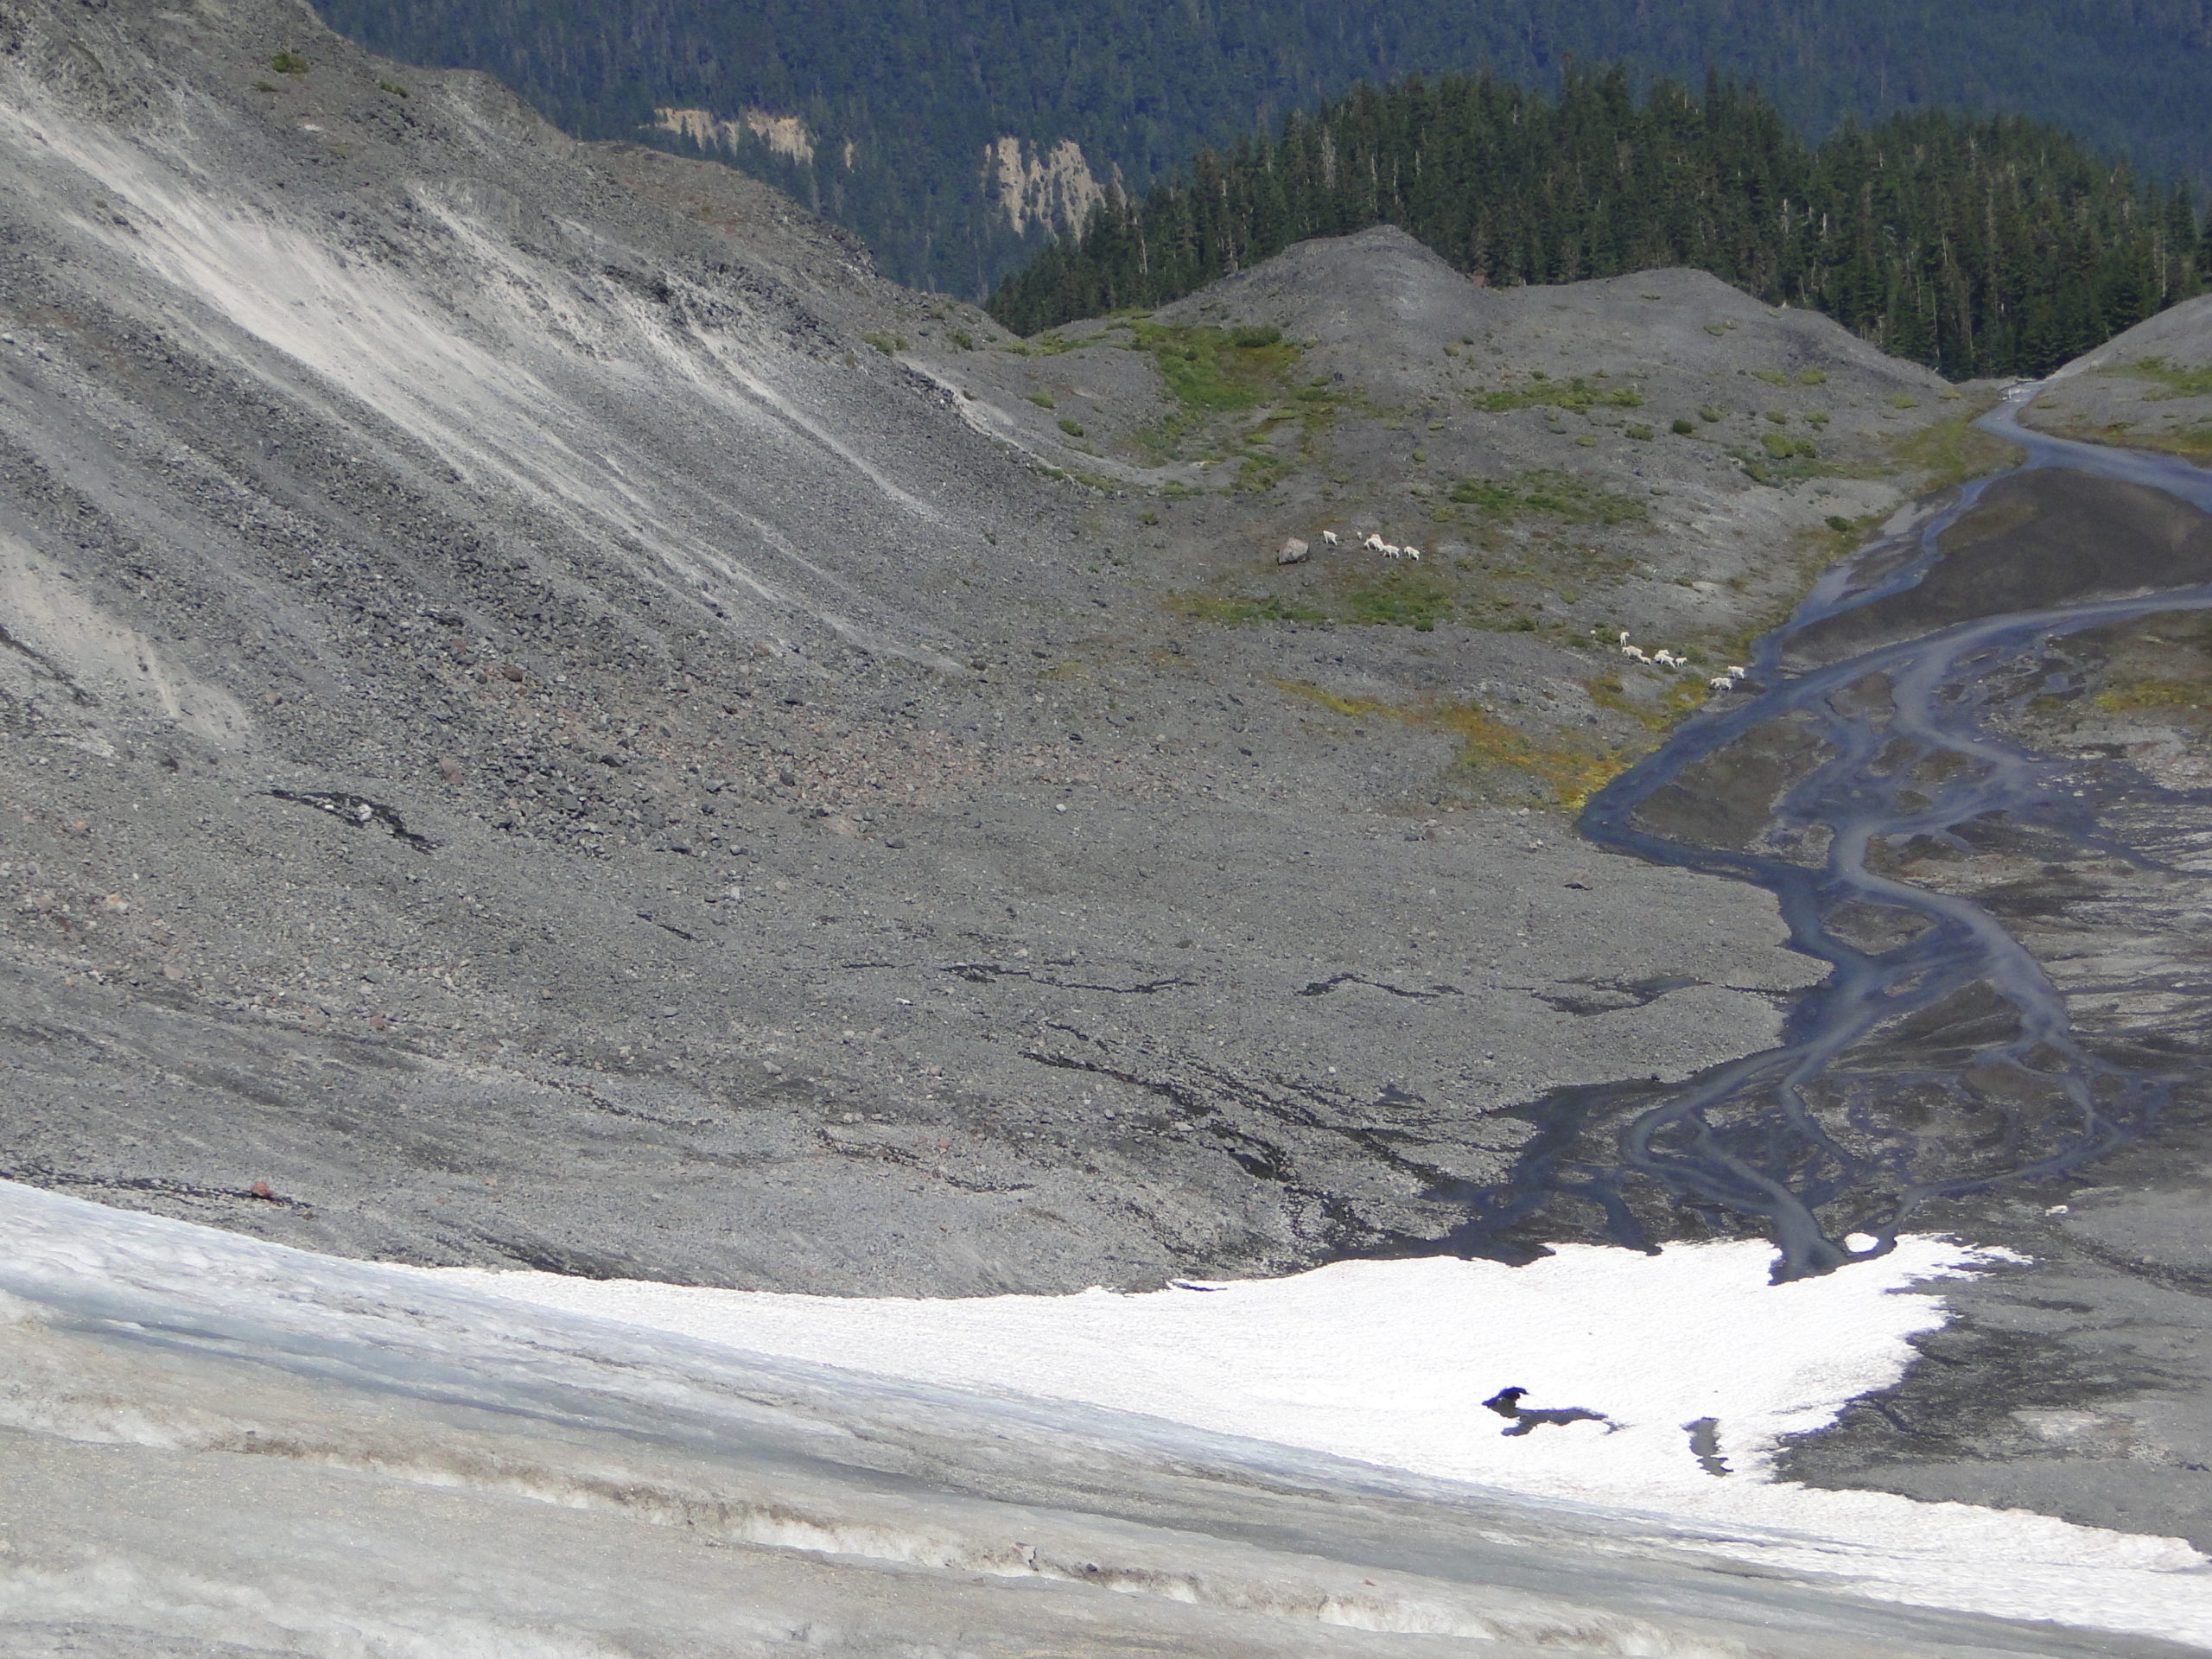
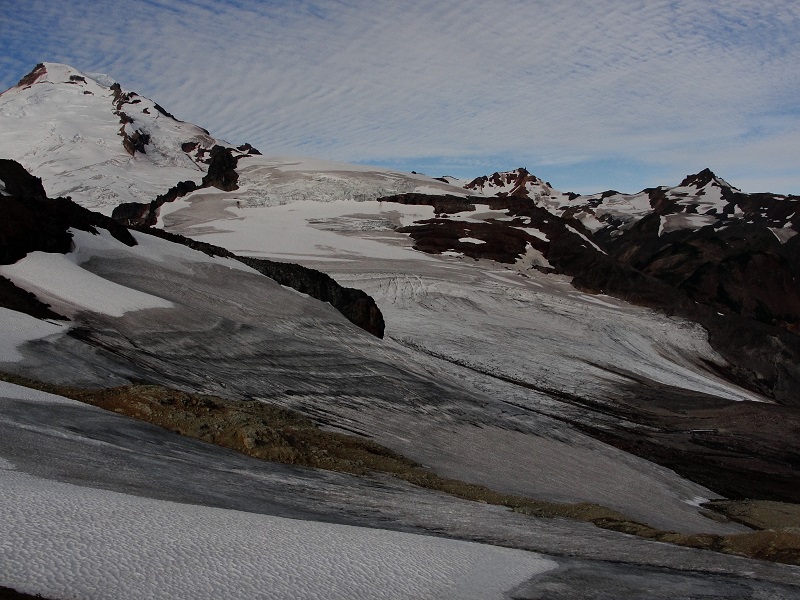
Sholes Glacier in 2021. The glacier has retreated 170 m from 1990-2021, the terminus in 1990 is approximately whre the goats are crossing the stream.
Hydrology downstream in Wells Creek and the North Fork Nooksack River is changing in part because of the changes in glacier runoff. Glacier runoff is a major source of streamflow during the summer low-flow season and mitigates both low flow and high water temperatures (Pelto, 2015). This is particularly true during summer heat waves, but this ability has been diminishing in the region (Moore et al 2020) For the last 37 summers we have been in the field monitoring North Cascade glaciers response to climate change including during heat waves (Pelto, 2018). In the last decade we have made synchronous observations of glacier ablation and stream discharge immediately below Sholes Glacier, Mount Baker (Pelto, 2015). This in conjunction with observed daily discharge and temperature data from the USGS stations on the ~6% glaciated North Fork Nooksack River (NFN) and the unglaciated South Fork Nooksack River (SFN), contrasts and quantifies the ameliorating role of glacier runoff on discharge and water temperature during 24 late summer heat wave events.
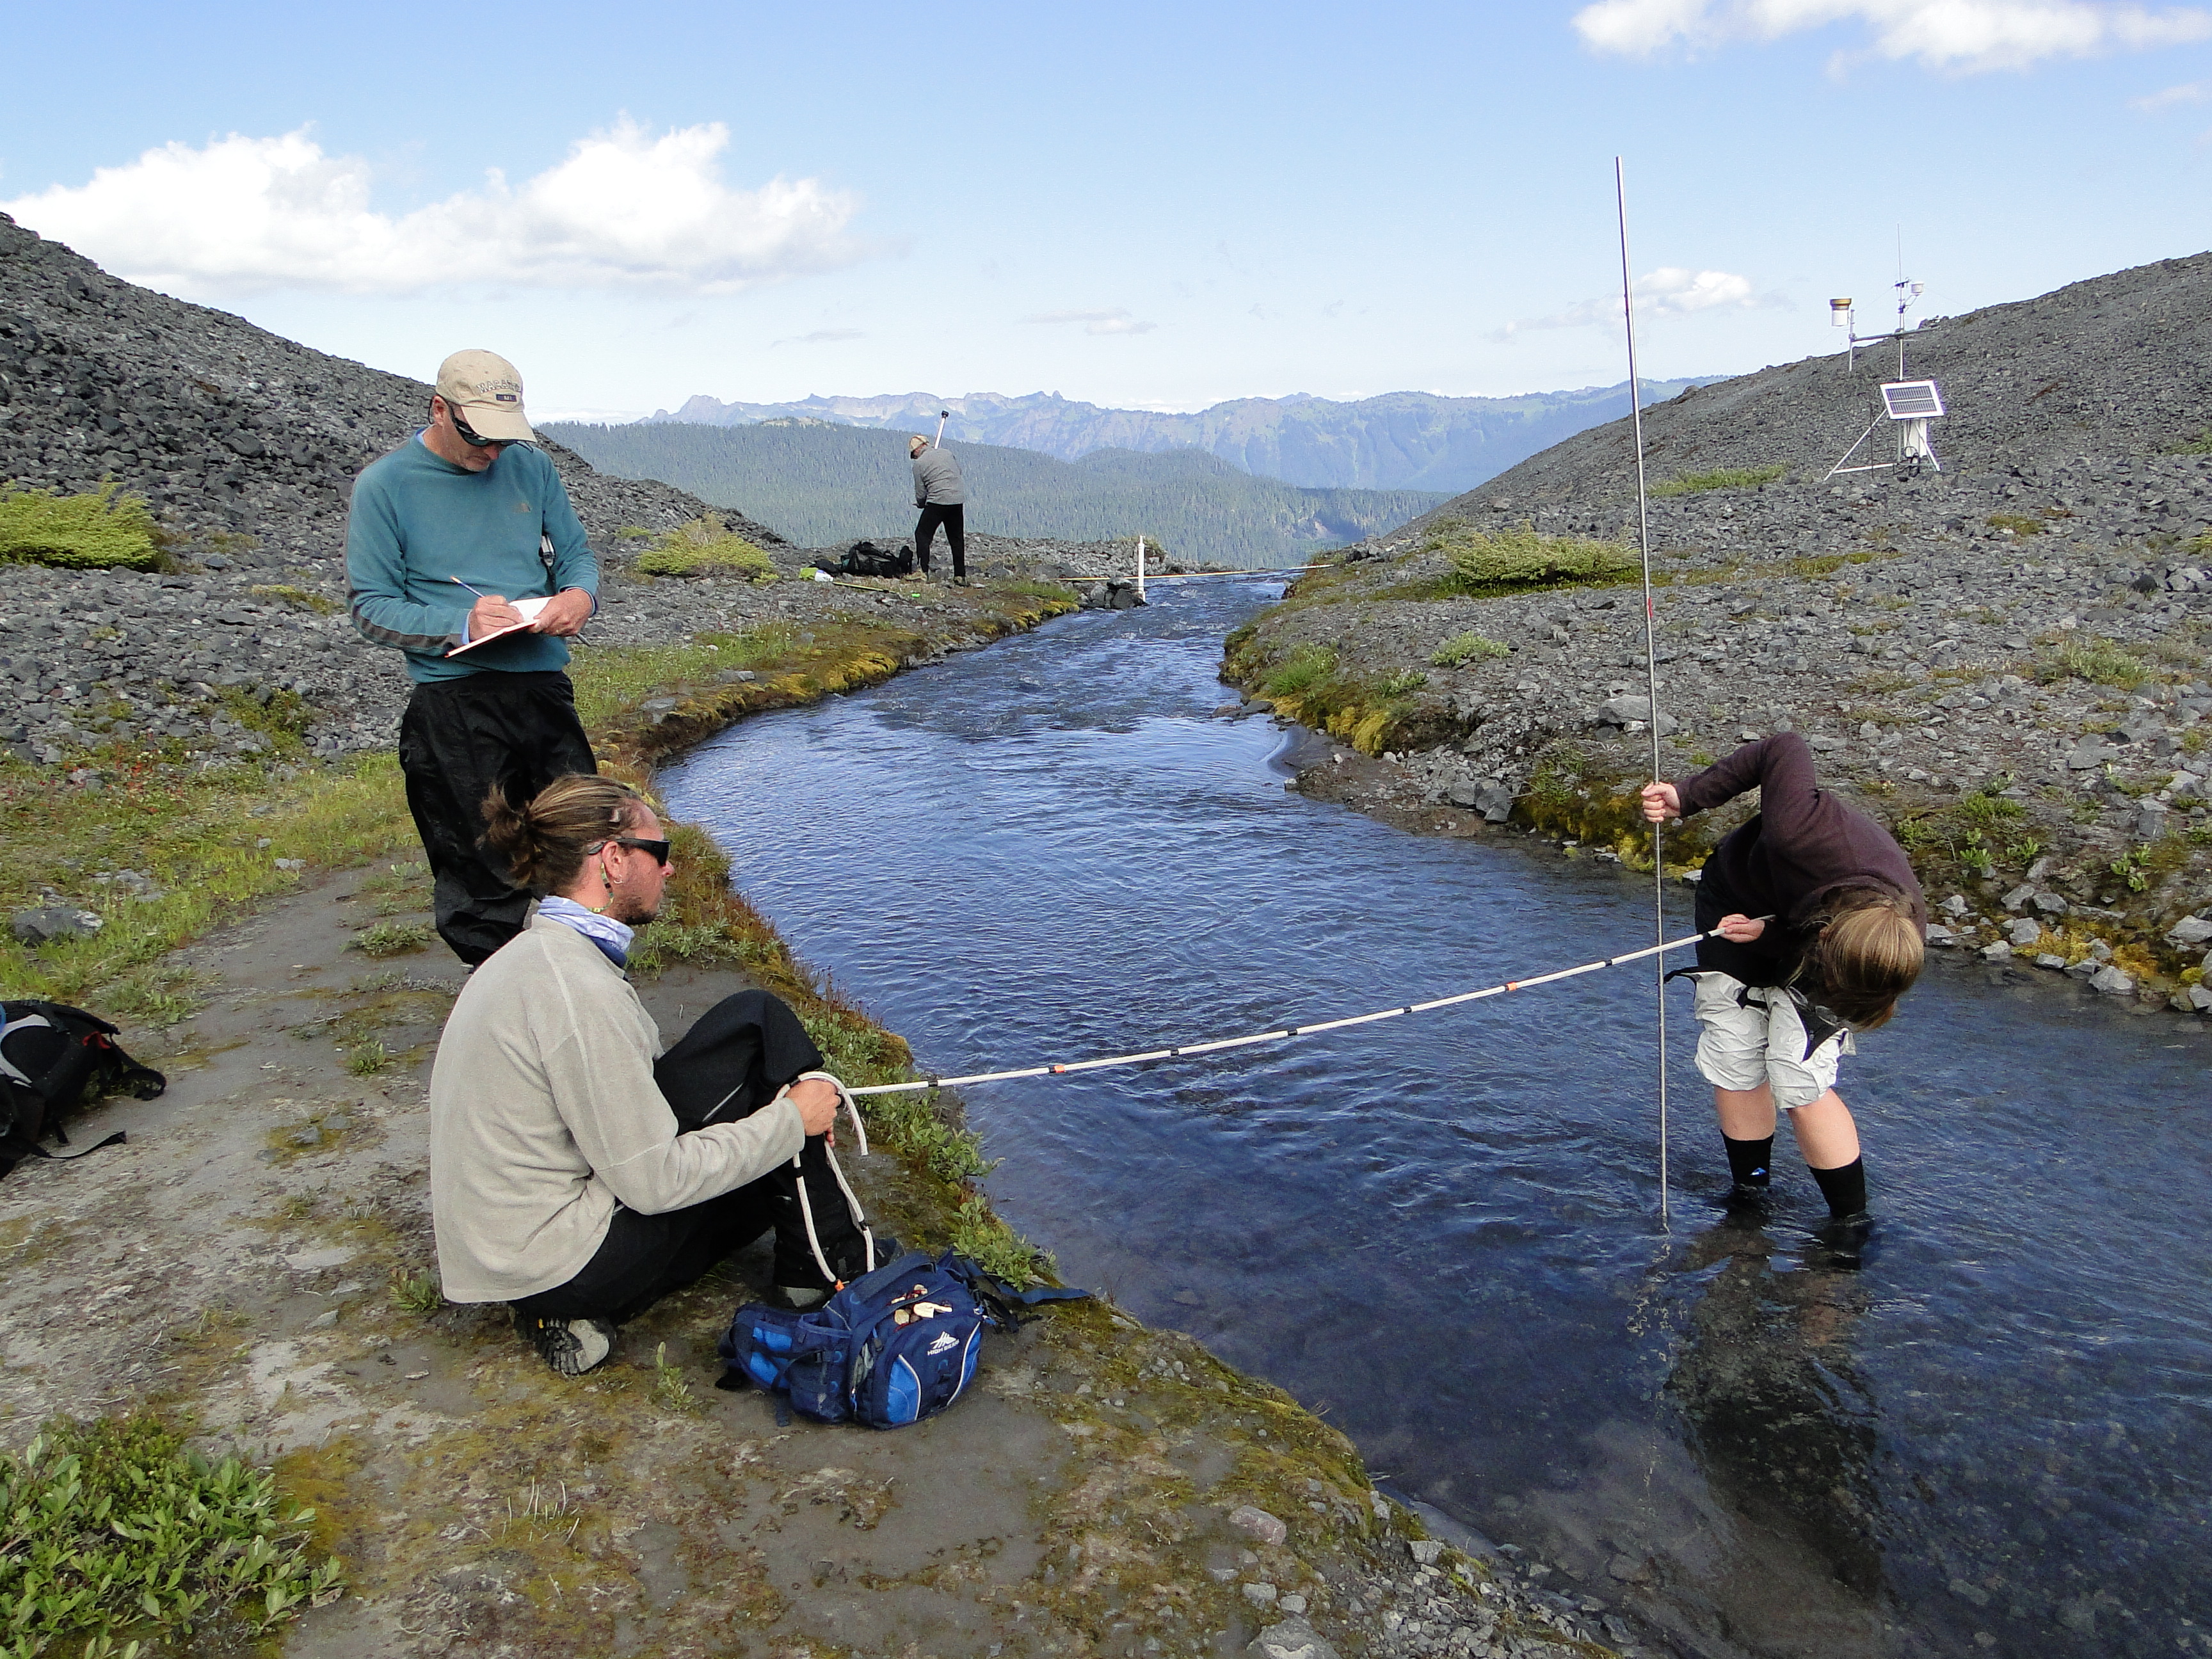
Measuring discharge below Sholes Glacier in 2016.
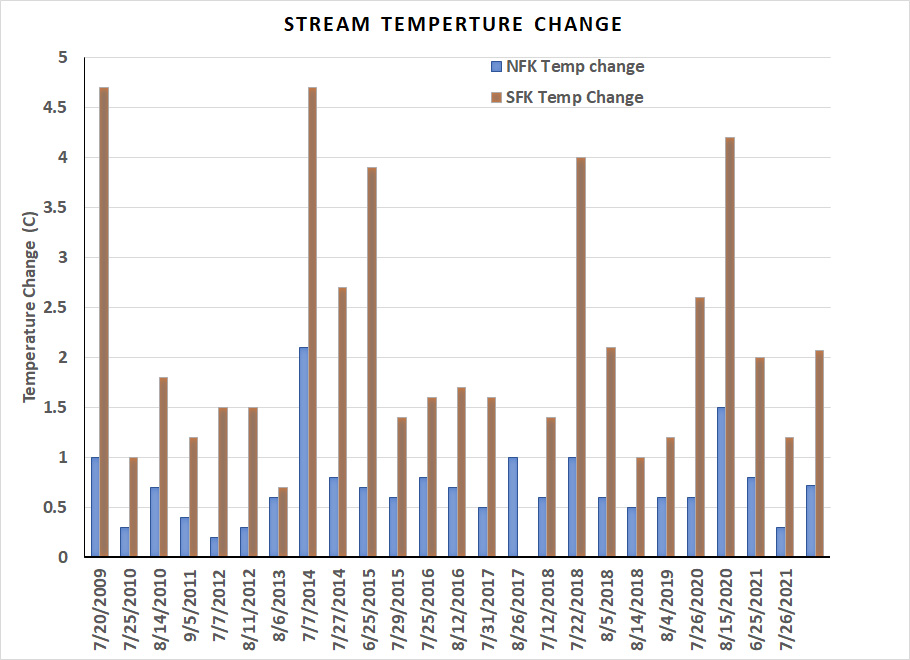
Sholes Glacier and ablation measurements on Sholes Glacier indicate daily ablation ranging from 5-6 cm/day, which for the NFN currently yields 9-11 cubic meters/second. This is 40-50% of the August mean discharge of 24 cubic meters/second, despite glaciers only covering 6% of the watershed. In the unglaciated SFN warm weather events generated a mean stream temperature change of +2°C, only 1 event in the NFN generated this rise and the mean was +0.7°C. Durng the June 2021 heatwave from June 21-29 maxium daily stream temperature in SFN warmed 3°C, vs 0.8°C for NFN. This illustrates that a greater proportion of snowmelt, which NFN recieves, has limited the temperature rise. Discharge rose at least 10% in 20 of the 24 events in the NFN with an average increase of 24%. In the SFN all 24 events led to a decreased discharge with an average decrease of 20%. The primary response to these summer heat waes is increased discharge in the heavily glaciated NFN, and increased stream temperature in the unglaciated SFN.

Discharge change during heat waves in South Fork (decreases) and North Fork Nooksack River (increases) above. Below temperature change during heat waves in South Fork (significant rise) and North Fork Nooksack River (small rise).
Glacier runoff is a product of glacier area and melt rate. Overall glacier runoff declines when area reductions exceed, ablation rate increases. This has already occurred in the NFN and now glacier runoff is declining (Pelto, 2015). The measured ablation rate is applied to glaciers across the NFN watershed, providing daily glacier runoff discharge to the North Fork Nooksack River. For the NFN glacier runoff production was equivalent to 34% of the total discharge during the 24 later summer heat wave events. As the glaciers continue to retreat the NFN will have a declining mitigation of heat waves for discharge and temperature and trend towards the the highly sensitive SFN where warm weather leads to declining streamflow and warming temperatures.
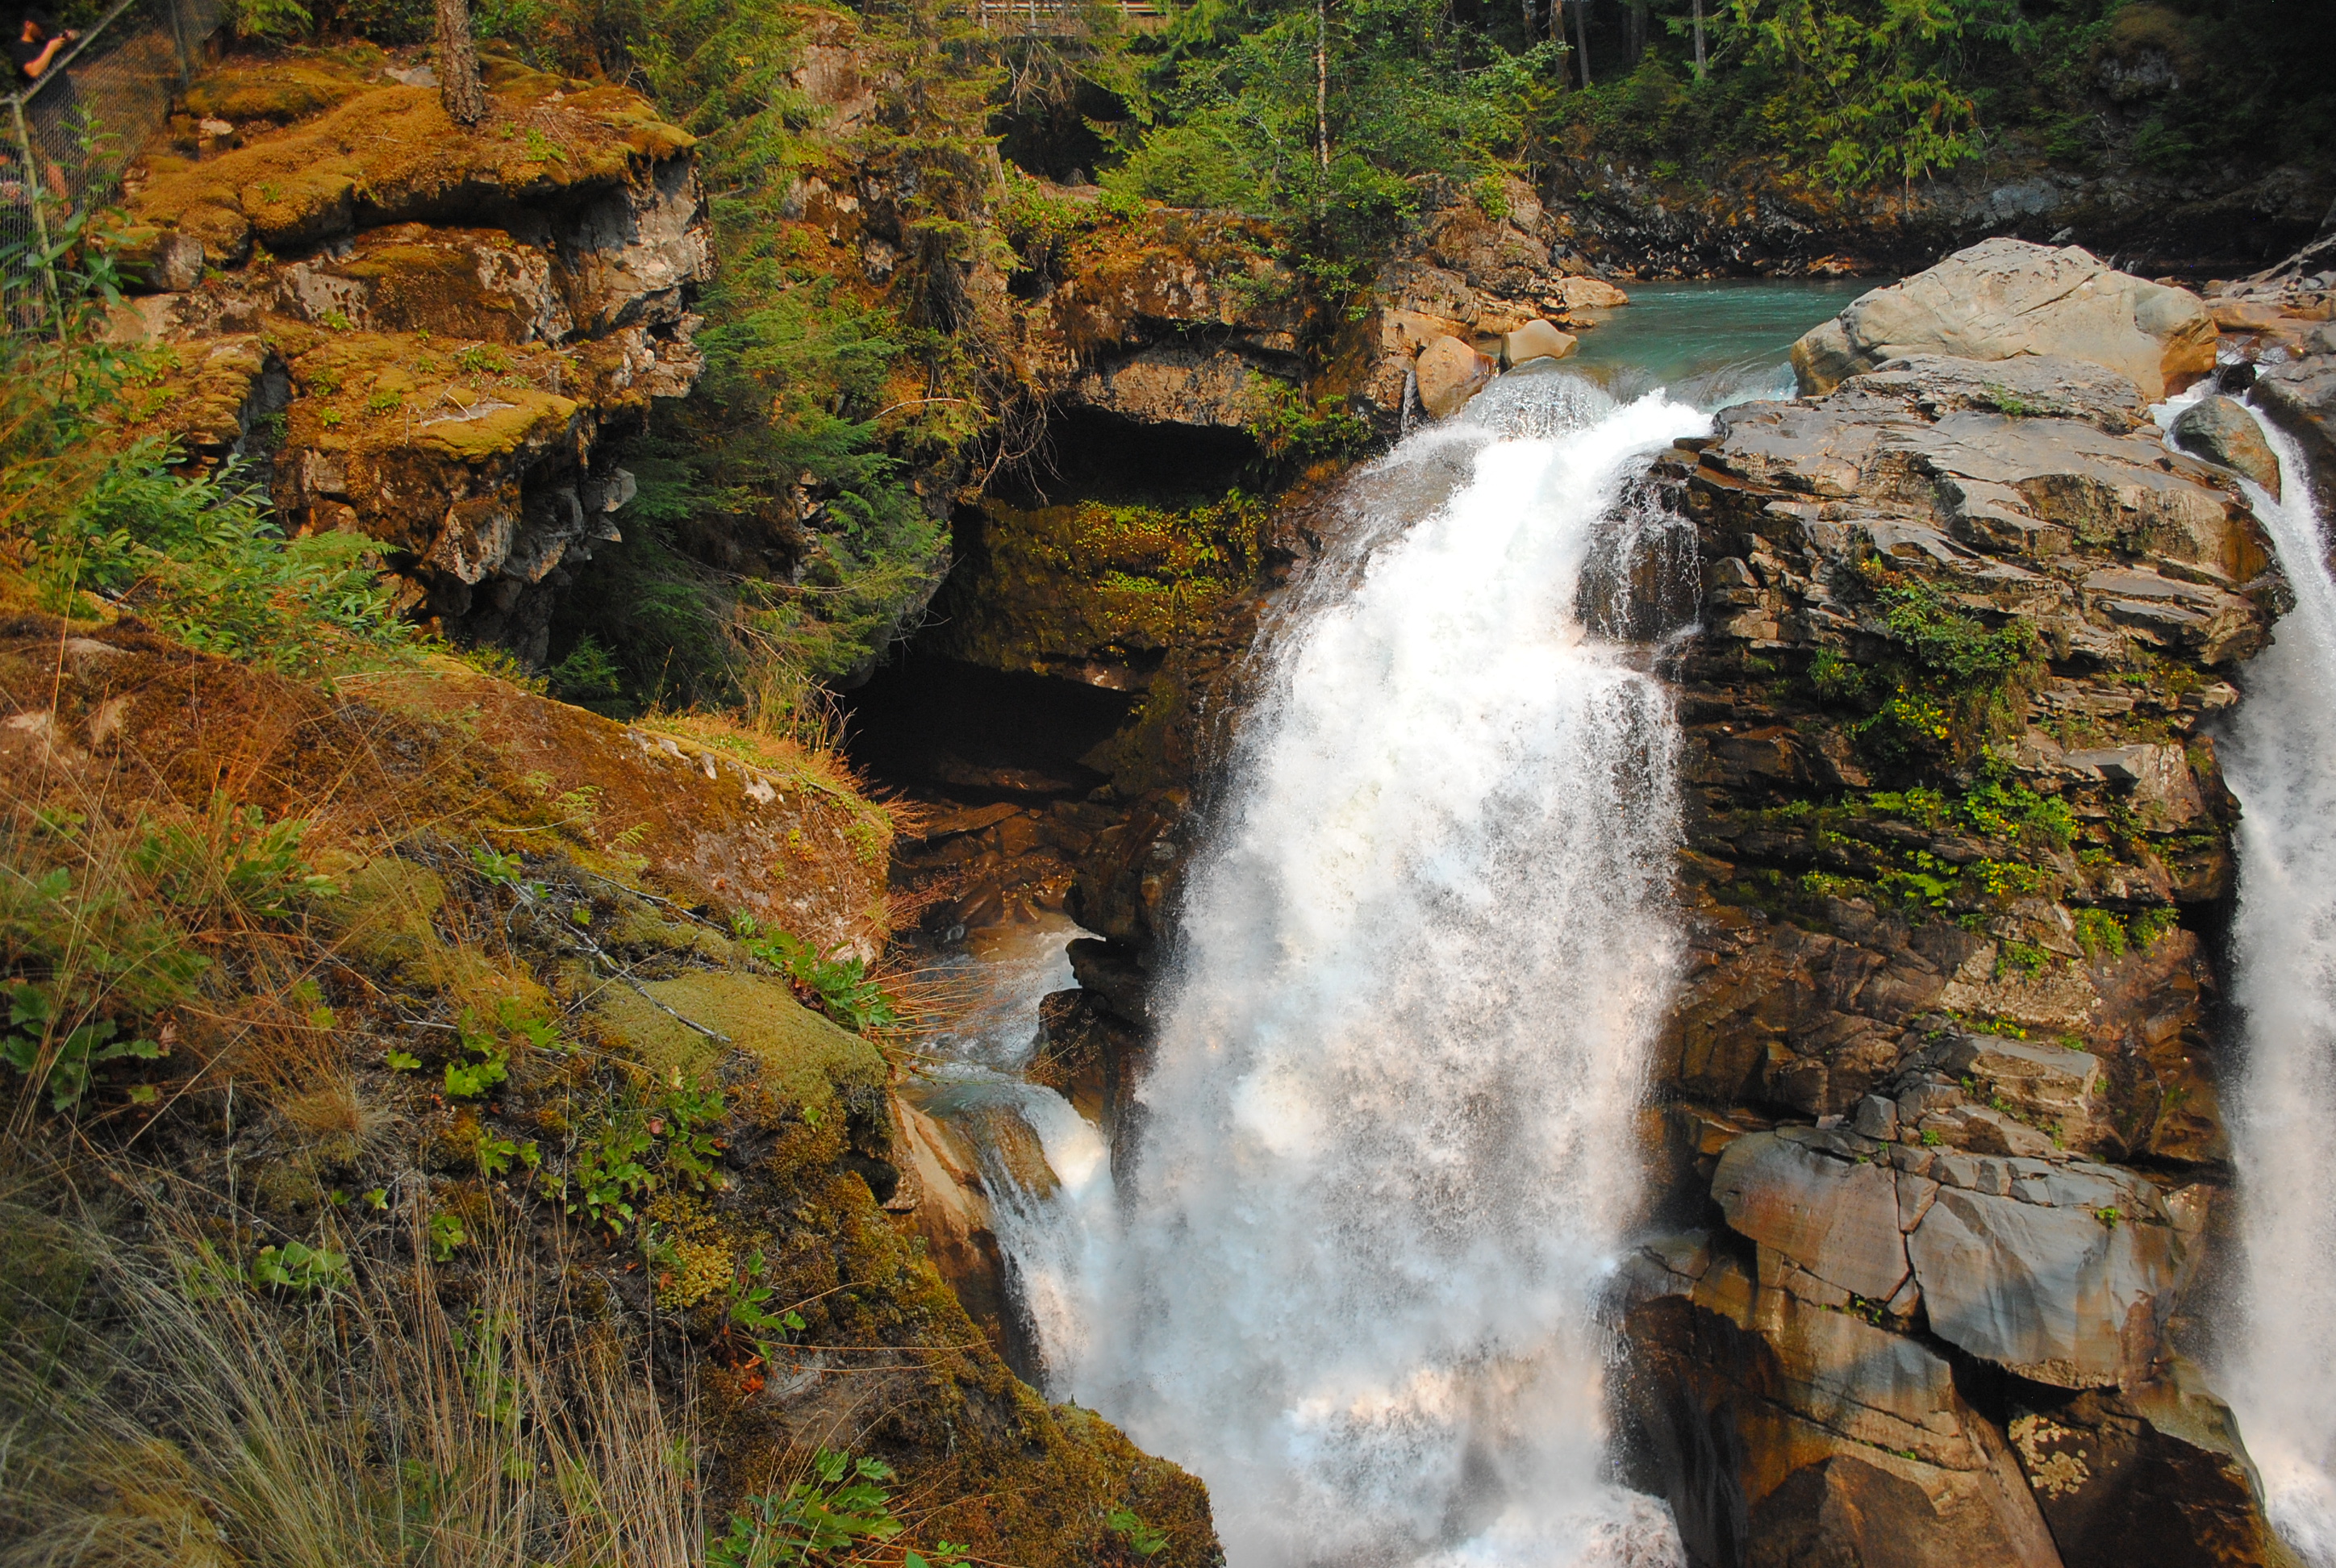
Nooksack Falls heavily glacier fed.
Aquatic ecology in glaciated watershed in turn is impacted. Glaciers are important in maintaining sufficient discharge and stream temperature that are critical for salmon in the North Fork Nooksack. Some cold-water trout and salmon species are already constrained by warm water temperatures and additional warming will result in net habitat loss (Isaak et al 2012). In the Fraser River and Thompson River, BC fish community thresholds were obsrved for mean weekly average temperatures of about 12°C and again above 19°C (Parkinson et al 2015). Below 12°C the community were characterized by bull trout and some cold water species, between 12°C and 19°C by salmonids and sculpins and above 19°C by minnows and some cold water salmonids (Parkinson et al 2015). These thresholds indicated small temperature changes can be expected to drive substantial changes in fish communities. During the 24 warm weather events noted in the North Fork only two events exceeded 12°C, while in the South Fork 15 of the events exceeded 19°C. This suggest that both rivers are near a threshold that could alter the fish community.
In the North Fork Nooksack the number of returning chinook is divided into natural and hatchery spawned salmon. The Chum and Coho salmon data for the Nooksack River during the 1999-2013 interval indicate there are two salmon population peaks for each species. The early peak is in 2002 and the second peak occurs in 2010 (Washington Dept. Fish & Wildlife, 2020). Overall numbers have not sustained an increase and remain endangered.
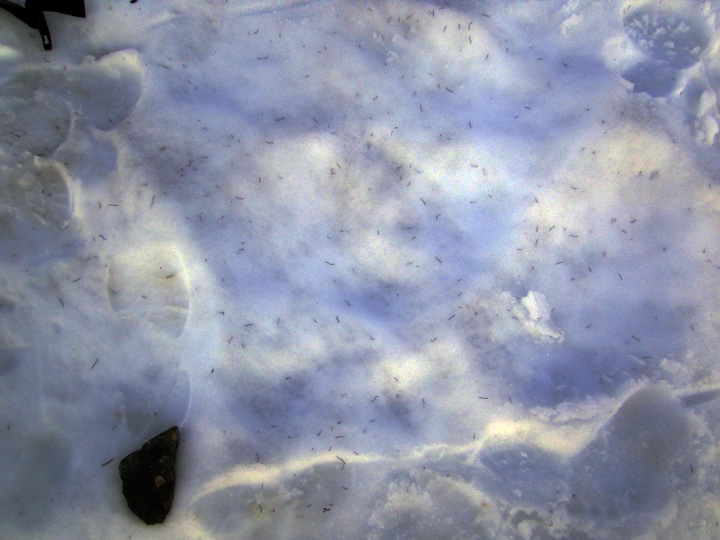
Ice Worm counts as the sunsets, 110 worms per square meter.
The climatology and glaciology has been difficult for ice wormology On the glacier itself ice worm population density surveys conducted annually indicate the density of ice worms has decreased since 2000 and that even 10 m beyond the edge of the glacier on snowpack they do not exist. This combined with the reduction in glacier area indicate population decline of ice worms.
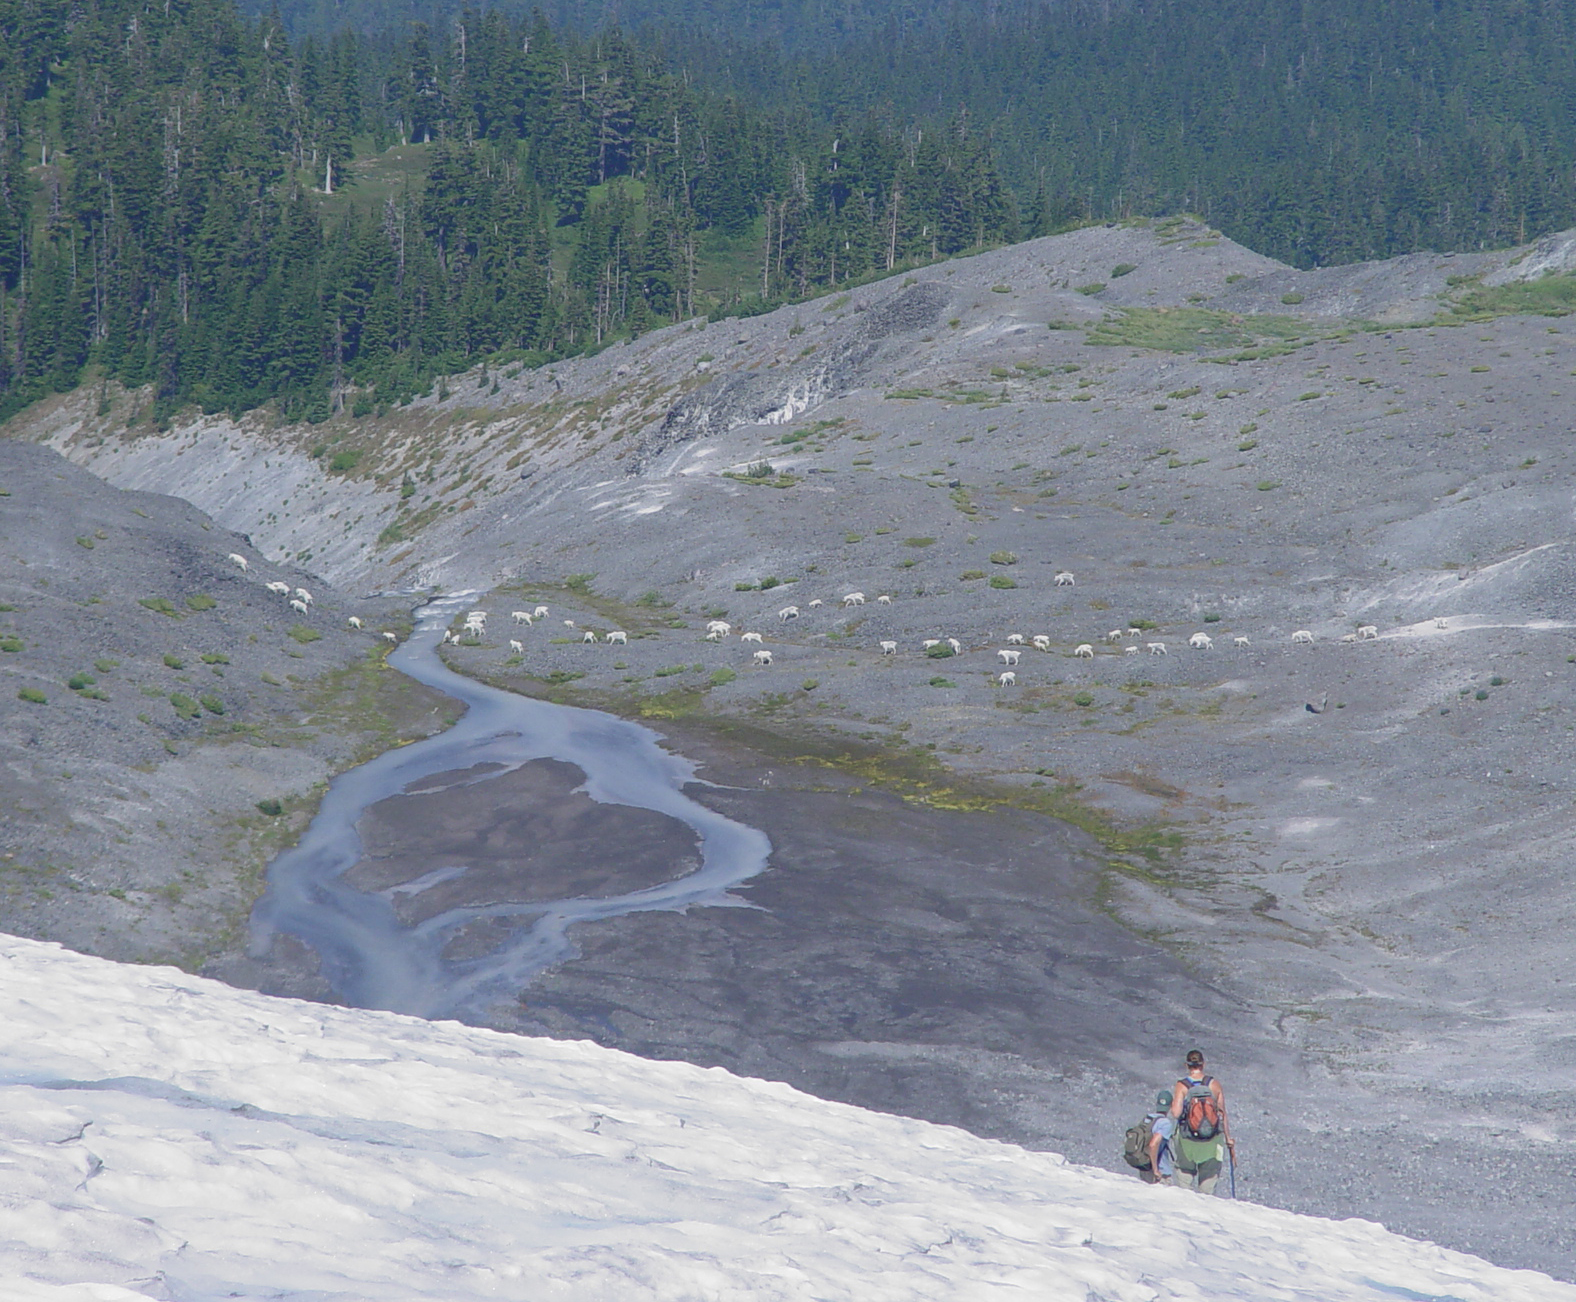
In 2009 we observed the largest goat herd 62 goats (13 kids), some of them seen here below Sholes Glacier.
The climatology has been more favorable in terms of Goatology.We have conducted annual mountain goat surveys in the Ptarmigan Ridge-Sholes Glacier region each years since 1984. Populations stayed steady from 1984-2000, before rising dramatically through 2010. The difficult winters of 2011 and 2012 reduced the population, followed by a recovery up to 2021.
Three year running mean of mountain goat census conducted each summer while we are working on Ptarmigan Ridge, Sholes Glacier and Rainbow Glacier.
 Dean of Academic Affairs at Nichols College and Professor of Environmental Science at Nichols College in Massachusetts since 1989. Glaciologist directing the North Cascade Glacier Climate Project since 1984. This project monitors the mass balance and behavior of more glaciers than any other in North America.