
May 10, 2018
Ablation Variation with time Across Variable Glacier Surface
Posted by Mauri Pelto
Bands of clean and dirty ice on Sholes Glacier
This post was prompted by comments from Ruth Mottram about funding for ablation process studies and the work by Fausto et al (2016) that noted non-radiative forces dominated the energy fluxes for ablation on the Greenland Ice Sheet during a period of high ablation in July 2012. This reminded me of a study we conducted some 25 years ago on the variation of ablation through time across a variable glacier surface. The surface had both rough and smooth sections, debris covered and clean ice, plus stream channels.
We drilled four stakes into the glacier and ran a wire between each stake pair, then measured the distance from this wire to the surface at a 1 m interval over the span of one one month of the ablation season. The study was designed to examine a question developed in a conversation with Henrik Thomsen at an International Glaciological Society conference in 1988. The question focused on his ablation studies on the Greenland Ice Sheet in the 1980’s. I had been on Jakobshavn Glacier previously, but had not done any ablation work as the focus was on glacier velocity (Pelto et al 1990). We both had observed variable surface melts rates across adjacent small areas, but such a differential ablation could not be sustained for long, without increasing the surface relief and in turn altering ablation. How then did ablation rate vary spatially and temporally across the rough surface ?
-

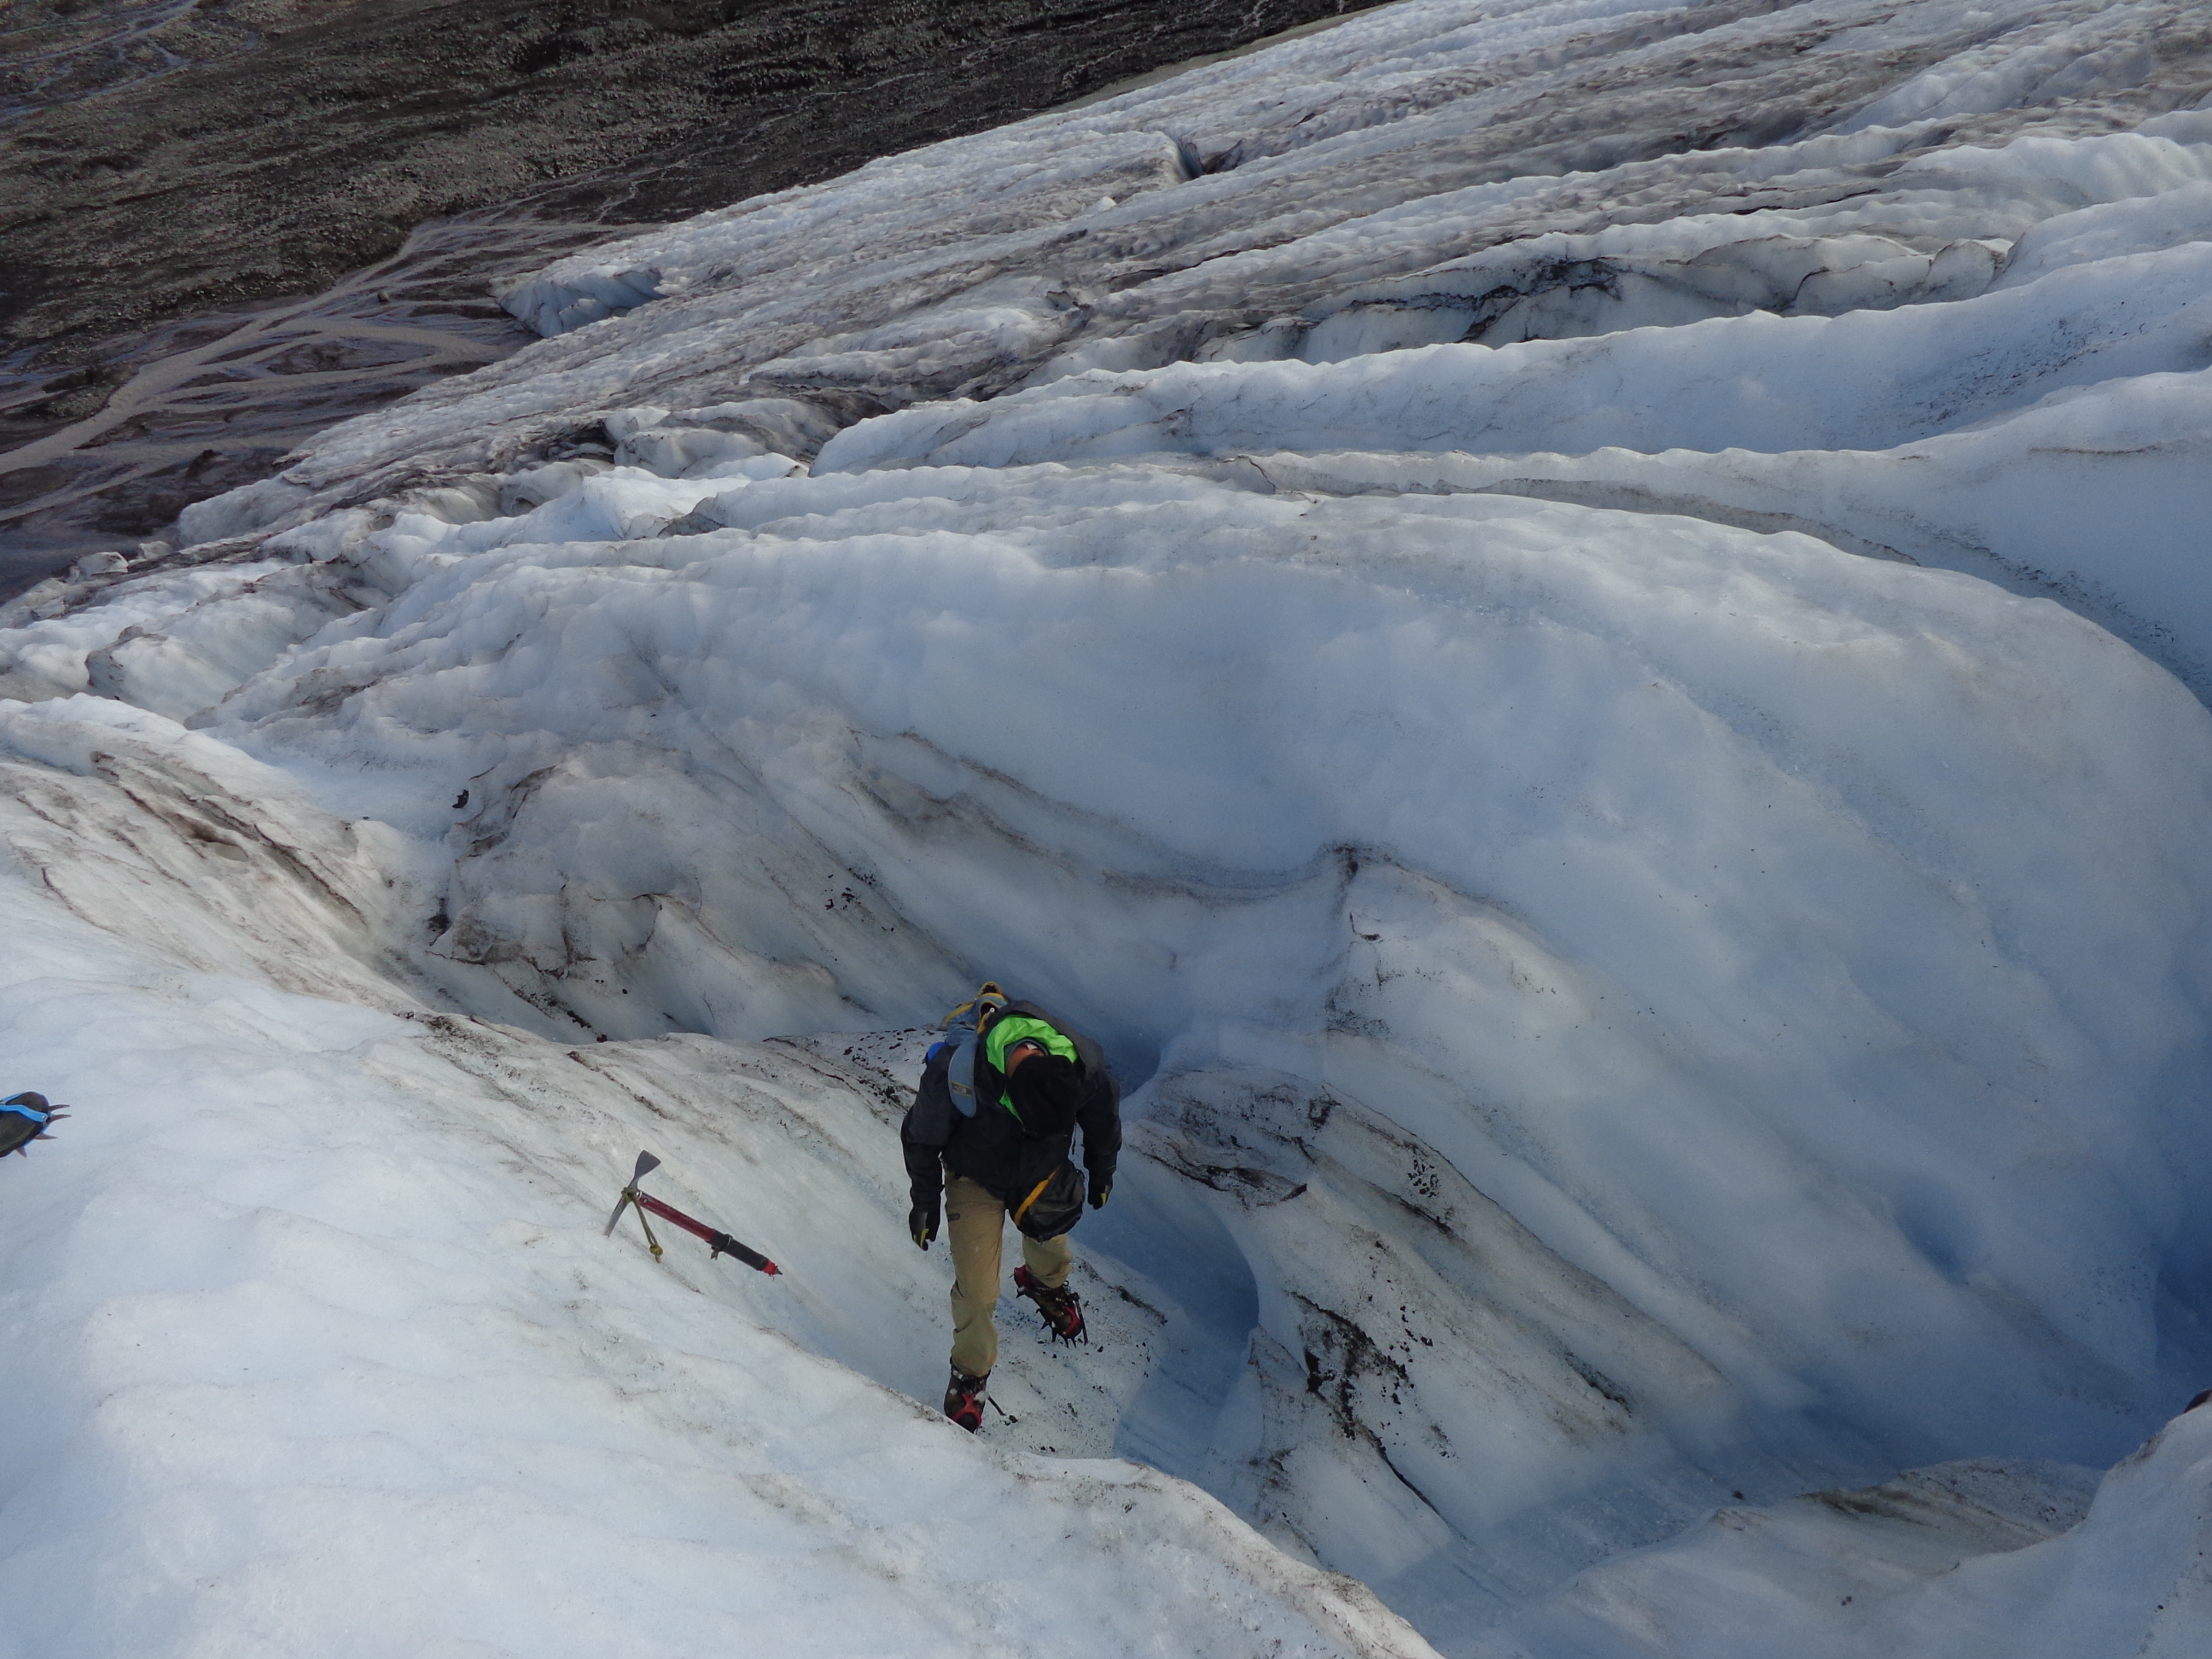
- Rough glacier surface on Rainbow Glacier
-

- Surface depression on Rainbow Glacier
-

- Down slope ice bands and surface roughness on Sholes Glacier
-

- Easton Glacier surface roughness and albedo changes
-

- Surface streams on Easton Glacie
-

- Easton Glacier ablation surface
-

- Columbia Glacier debris banding not sufficient to reduce ablation
-

- Surface stream on lower Sholes Glacier
-

- Surface stream immature channels Sholes Glacier
-

- Clean and dirty ice bands Sholes glaciers
-

- Sholes Glacier surface roughness
-

- Columbia Glacier surface roughness
-

- Columbia Glacier surface roughness
The conversation focused on the example of an average area of the ablation zone of the GIS where the surface has varied albedo as well as surface roughness across small regions. Take an area the size of a tennis court for example that has 0-1 meter variations in ice surface level, what is the spatial and temporal variation of ablation. If we start with a relatively flat surface the areas of low albedo will have a higher ablation rate and develop into depressions. If we have a 1 m wide band of lower albedo ice that ablates faster, how deep can the depression be before other processes slow the ablation of this new depression. The topographic high now experiences greater solar radiation and sensible radiation. If we have relatively clean ice, the surface high points experience greater wind and solar radiation ablation, but the lows can have greater water saturation, which can enhance melt, or reduce it if the surface refreezes.
The measurements of ablation variation conducted did lead to a publication focussed on the debris cover change impact (Pelto, 2000). The changes simply due to surface roughness did not. Why you ask? What was observed in several cases of ridges that were on the order of 1-2 m wide and 30-70 m high in an environment lacking surface streams, was the ridges shifted in both relief and location with time. This illustrated that small bands/areas of high ablation were not sustainable, as they become depressions. The surrounding surface prominence’s become the focus of increased ablation, hence the surface tries to return to a somewhat level form. Overall ablation rate had a limited variation across the tennis court size area, with the mean ablation for the month of 1.4 m, and a standard deviation of 0.23 m. The areas of the glacier the dirty parts of the glacierThe question I emerged with was does this homogenizing of the ablation rate increase the mean as faster ablation rate areas raise overall ablation or lower the ablation rate as lower ablation rate areas are a limiting factor? The observations of extreme melt in the North Cascades in 2015 left me thinking the former (Pelto, 2018).
 Dean of Academic Affairs at Nichols College and Professor of Environmental Science at Nichols College in Massachusetts since 1989. Glaciologist directing the North Cascade Glacier Climate Project since 1984. This project monitors the mass balance and behavior of more glaciers than any other in North America.