
21 August 2017
Regent landslide in Sierra Leone: the causes of the disaster
Regent landslide in Sierra Leone: the causes of the disaster
The latest tally of losses from the Regent landslide in Sierra Leone has been released by the coroner. To date 499 bodies have been recovered, with about 600 people still reported missing. As expected, this is now the worst landslide of the calendar year to date.
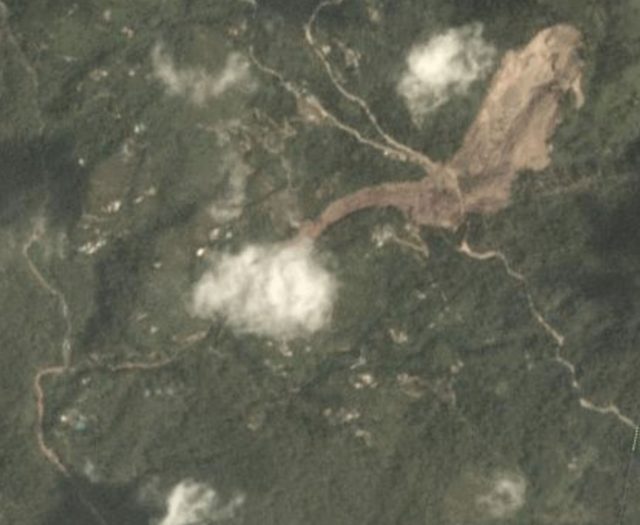
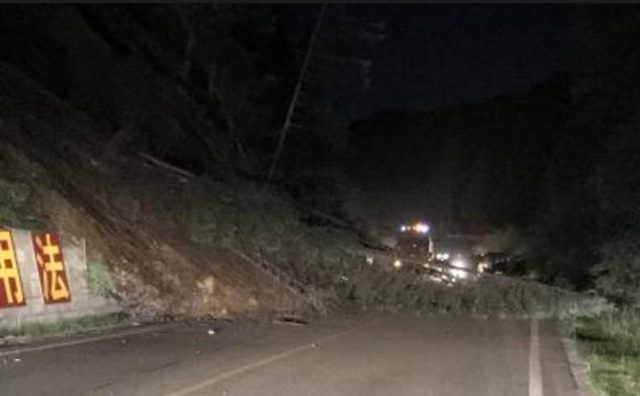
It is increasingly clear that this disaster was caused by a large, but not huge, failure on the bedrock – regolith interface on a slope above the town. This event would undoubtedly have caused mass fatalities, but the true magnitude of the disaster was the result of this failure transitioning to become a high mobility channelised debris flow. This image, from Ultimate FM online, is the most revealing:
The track of the Regent landslide in Sierra Leone, via Ultimate FM online.
.
Note the broad landslide track heading downstream from the camera. Given that victims from this disaster have been recovered from the sea, it is likely that this landslide travelled about 6.5 km as the crow flies, probably transitioning into a mudflow en route. The slope that failed is about 300 m long and about 130 m from toe to crest. This is a March 2017 Google Earth image of the slope that failed in the Regent landslide disaster:-
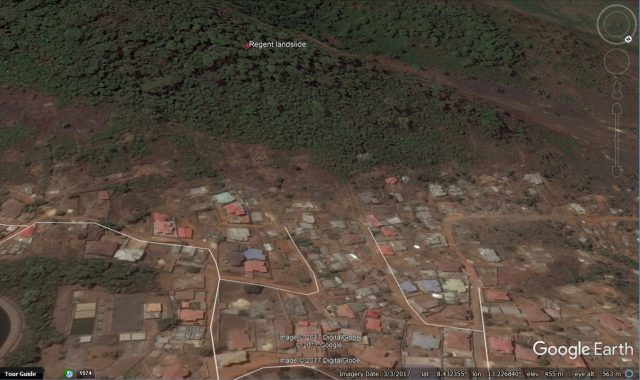
March 2017 Google Earth imagery of the slope that failed in the Regent landslide disaster.
.
Whilst this slope does show signs of some distress, it is highly unlikely that it could have been identified as being dangerous to this degree from visual imagery alone. Identifying potentially hazardous slopes in such settings remains a major challenge. Of greater interest perhaps is to compare the above image with the first high resolution image available in the Google Earth archive:-
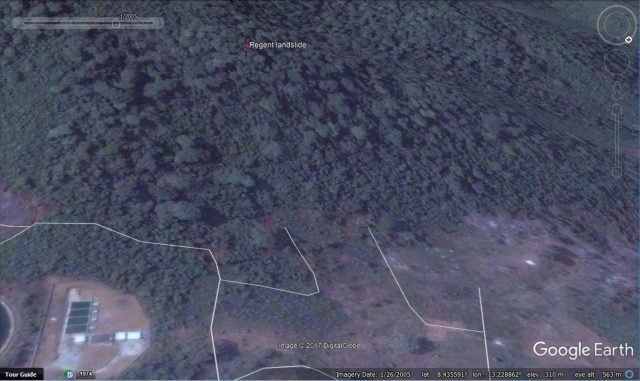
Google Earth imagery from 2005 showing the location of the Regent landslide.
.
The slope has lost some forestry, but the scale of deforestation here is not huge. What is more notable is the change in land use at the toe of the slope. In 2005 this area was mostly unpopulated; immediately prior to the Regent landslide it had dozens of houses. Needless to say it is this growth of urban areas in unsuitable sites that is driving an increase in losses from these events. The combination of this effect with increased rainfall intensities as the climate warms is lethal.
20 August 2017
Dynamic analysis of the Oso landslide – a contribution by Oldrich Hungr and colleagues
Dynamic analysis of the Oso landslide – a contribution by Oldrich Hungr and colleagues
One of the last important research contributions by Professor Oldrich Hungr is a paper to be published on 1st September 2017 (but now available online) providing a dynamic analysis of the Oso landslide. This paper (Aaron et al. 2017) plays of course to Oldrich’s greatest strength – his understanding of, and contributions to, the mobility of landslides. As I have noted previously, Oso remains controversial in terms of its pre- and post-failure behaviour. This paper is a follow-up to an earlier article (Stark et al. 2017) that examined the material properties of the landslide. I note that the conclusions of that earlier paper are not accepted by some prominent people who have studied the Oso landslide.
Aaron et al. (2017) model the runout behaviour of the landslide using two well-documented and highly regarded models for the dynamic analysis of landslides – DANW (which is a 2 dimensional model) and DAN3D (the three dimensional equivalent), both developed by Oldrich and his colleagues. The approach that they have used has been to model the landslide in two dimensions first to understand the parameters that control the landslide behaviour, and then to use these to model the landslide in three dimensions. They have calibrated the models on the basis of detailed mapping of the landslide deposit – in other words, they required that the models were able to account for the spatial distribution of different remnants of the landslide as well as the overall morphology of the deposit. In particular, they observe three distinct zones of the landslide mass post-failure (quoted from Aaron et al. (2017):
1. The source zone, which contains a nearly intact although heavily deformed block at the head, bordered by highly sheared but massive blocks that appear to have travelled for a limited distance down a sloping, steplike surface from a higher elevation;
2. The valley floor, which consists of widely spread fluid deposits bearing rafts of intact sand and clay; and
3. Distal splash zone, which consists only of fluidized material and organic debris.
These features can be quite readily identified on the Google Earth imagery of the landslide:-
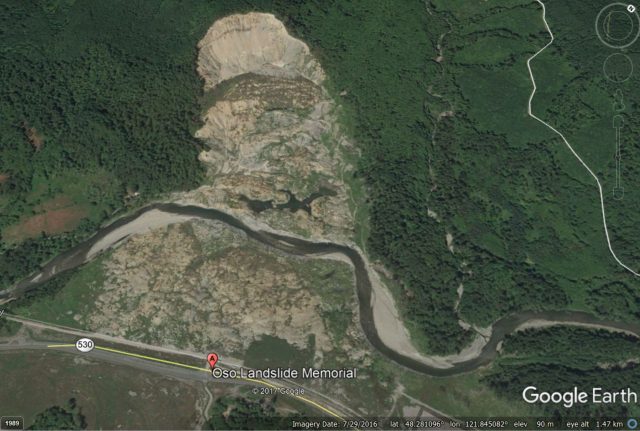
Google Earth imagery of the Oso landslide. The regions that form the basis of the dynamic analysis are readily identifiable.
.
I noted above the controversy about the failure mechanisms of the landslide. Aaron et al. (2017) note this controversy, but observe that the various mechanisms make little difference to the runout analysis. I suspect that this may be a point of contention. The models proposed by Aaron et al. (2017) are reported to be able to reproduce the key features noted above, and many of the fine-grained elements such as the location of various displaced rafts containing identifiable trees. The most important aspect of this model is that not all of the landslide material is assumed to have undergone liquefaction. In the model presented here, material in the upper part of the landslide, consisting of overconsolidated glaciolacustrine silt and clay, underwent brittle failure but did not undergo liquefaction. Material on the lower part of the slope, consisting of colluvium (effectively debris from earlier landslide events) failed as a result of the impact and loading of the upper portion of the landslide, and underwent “significant undrained strength loss (liquefaction)“, allowing it to travel more than 1.4 km across the valley floor. It was this mobility that caused the landslide to induce such heavy loss of life.
Aaron et al. (2017) note that their analysis does not explain why this colluvial material was so prone to liquefaction; further laboratory testing is going to be needed to explore this behaviour, and thus to provide evidence for what is likely to be a controversial mechanism. But the approach described in this paper, and the use of detailed mapping, evidence from previous high mobility failures and high quality 2d and 3D modelling is a fitting tribute to the skills, knowledge and contributions of Oldrich Hungr and of course his co-authors.
References
Aaron, J., Hungr, O., Stark, T. and Baghdady, A. 2017. Oso, Washington, Landslide of March 22, 2014: Dynamic Analysis, Journal of Geotechnical and Geoenvironmental Engineering, 10.1061/(ASCE)GT.1943-5606.0001748, 143:9, (05017005).
Stark, T. D., Baghdady, A., Hungr, O., and Aaron, J. 2017. “Case study: Oso landslide on 22 March 2014—Material properties and failure mechanism.” Journal of Geotechnical and Geoenvironmental Engineering, 10.1061/(ASCE)GT.1943-5606.0001615, (05017001).
19 August 2017
Professor Oldrich Hungr

Professor Oldrich Hungr
Professor Oldrich Hungr
It was with great sadness that I learnt this week of the passing of Oldrich Hungr, Emeritus Professor of Engineering Geology at UBC, in Grenoble last Friday. Oldrich was one of the most significant landslide scientists, with a string of awards and medals that honour his pioneering work. The landslide world will miss him greatly.
Oldrich completed his PhD at the University of Alberta before moving into consultancy for 15 or so years. From there he moved into academia when he joined the Department of Earth, Ocean and Atmosheric Sciences at the University of British Columbia as a Professor of Engineering Geology, where he was to spend the remainder of his career. Oldrich is best known for his work on the mobility of landslides, and in particular for the development of the DAN-W software series that allows the modelling of complex flows. Working with a succession of graduate students, Oldrich refined this model to allow the analysis of the likely runout dynamics of flows across 3D surfaces. This approach is brilliant in its conception and execution, and it has formed the basis of both prospective and back analyses around the world. Oldrich was remarkably modest about this work, but it is fundamentally and practically excellent.
It would be wrong to imply that this was his only significant research contribution. A review of his publications on Web of Science brings up significant and very well-cited papers on the classification of landslides (especially on flow-type slides, and more recently an update to the Varnes classification that is now very much the standard approach); on rockfall hazards; on slope stability analyses; on failure prediction; and on specific landslide events such as the Frank Slide. Oldrich was also a good friend to the landslide community, playing a key role on JTC-1 (the coordinating body for landslide research), organising meetings, editing volumes and of course acting as a critical friend to all. In return the community has honoured him through, for example, the award of the Varnes Medal in 2015 and the Heim Lecture in 2016.
Professor Oldrich Hungr giving a rerun of his Heim lecture in Hong Kong in 2016
I most recently featured his work in relation to the first of two papers he has written about the Oso landslide. In the aftermath, he and I exchanged emails about the reception that this paper, and my blog post, had received from some quarters. Oldrich was wryly amused, if perhaps a little nonplussed, by aspects of this.
Of course Oldrich was also an educator, and over 50 graduate students have benefited from his dedicated and attentive supervision, and thousands of undergraduates have been inspired by his teaching. Oldrich worked closely with industry throughout his career, providing guidance and advice to many projects both within Canada and more widely.
I have known Oldrich for many years, but most notably in the last three when, together with Suzanne Lacasse, Oldrich and I have constituted the Slope Safety Technical Review Board in Hong Kong. For the last two years we have spent a week working together each autumn in Hong Kong, providing oversight and guidance to the GEO. Oldrich was a wonderful colleague on these occasions. He was deeply dedicated to the task, inspiring and notably perceptive. He had a remarkable ability to identify key issues, and to engage in discussion in a way that was constructive and educative. I learnt a huge amount from him on these occasions; he will be sorely missed when we convene again later this year.
Oldrich was a great friend and an exceptional landslide scientist. He will be an inspiration for decades to come.
18 August 2017
A tale of two major slides: understanding the Regent and Kotrupi / Kotropi landslides
A tale of two slides: understanding the Regent and Kotropi landslides
Details are starting to emerge of the devastating Regent and Kotropi (also known as Kotrupi) landslides, in Sierra Leone and India respectively. With respect to the Regent landslide, which killed close to 400 people (and maybe many more), I noted earlier that there was considerable confusion about the relationship between reported flooding and this, and possibly other, landslides. Through an activation of the International Charter on Space and Major Disasters, UNITAR have generated an initial satellite map of the main portion of this event:-
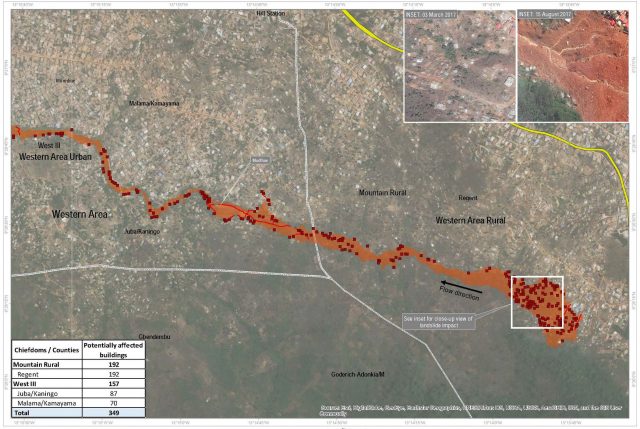
UNITAR map showing the impact of the Regent landslide in Sierra Leone
.
The map confirms my speculation after the event that this is a high mobility, long runout landslide. Whilst most of the debris remained close to the source (devastating a large number of houses – those are the red dots on the image), a portion transitioned into a very high mobility flow that travelled down the channel, inundating a large number of houses. This explains the description of the Regent landslide as both a mass movement and a flood – it was indeed both, but the initial landslide was the common cause.
Meanwhile, the NRSC/ISRO in India has posted an initial but detailed report about the Kotrupi / Kotropi landslide. This confirms the location that I identified in my post earlier this week, and it indicates that the slope that I identified as being the likely culprit did indeed fail. They include this satellite image of the site:-
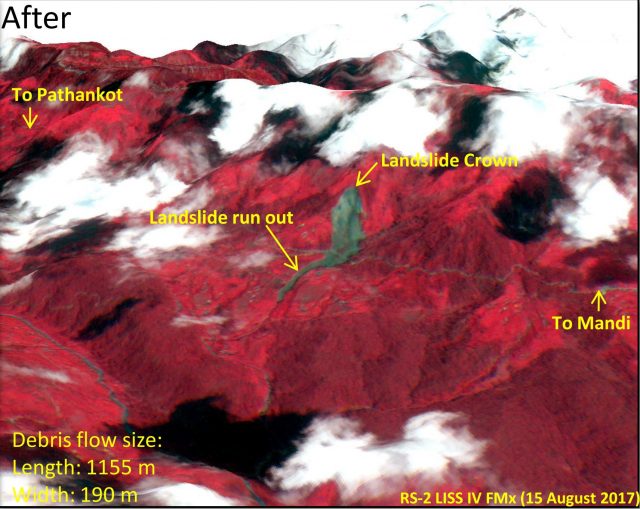
NRSC / ISRO satellite image of the Kotropi landslide.
.
In comparison with the Regent landslide, the Kotropi event was also large but does not appear to have had high mobility, with the flow appearing to cease on a steep portion of the slope. Once again one cannot escape the vital role that material properties play in determining landslide behaviour. This image does raise a key question about the landslide though. News reports in the last day or so have raised concerns that it is a valley blocking slide. This article for example states that:
The Mandi administration today evacuated five villages near Kotrupi as after a massive landslide on August 13 a lake has been formed in the upper side of villages. The Kotrupi landslide killed 46 people...Ex-pradhan of Gram Panchayat Urla Tek Singh said five villages — Saraj Bagla, Badvaan, Ropa, Sharsti and Jagehad — had been vacated in view of the safety concerns.
But the image above does not suggest a valley blocking landslide. I am unsure as to what is going on here. This is the Planetlabs image from 14th August:-
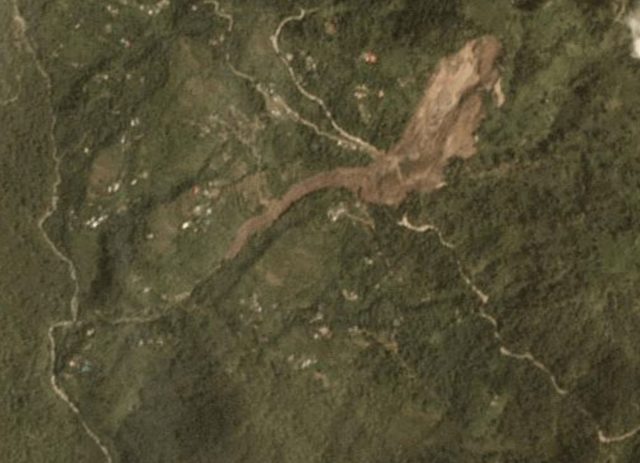
Planet Team (2017) image of the Kotropi landslide, taken on 14th August 2017
.
This shows much the same as the Indian image above, though with a better level of detail. It is clearly not valley blocking. This is a further Planetlabs image taken on 16th August:-
Planet Team (2017) image of the Kotropi landslide, collected on 16th August 2017
.
On first inspection there is little change. But, is there an indication that debris has mobilised at the toe of the slide (unfortunately under the cloud) and travelled down the gully. This image appears to show fresh sediment in the lower channel that is not apparently there in the earlier image? This might be an artefact in the image, or it could be a real effect. If the latter then this might explain the concerns about blocked channels.
I would welcome thoughts from others.
Acknowledgement
Planet Team (2017). Planet Application Program Interface: In Space for Life on Earth. San Francisco, CA. https://api.planet.com
15 August 2017
Regent landslide, Sierra Leone: an uncertain picture
Regent landslide, Sierra Leone: an uncertain picture
There is widespread, front page reporting this morning of the Regent landslide tragedy in Sierra Leone. This is without doubt the biggest event (so far) in a bad year for landslide accidents worldwide; sadly, with some months of the main global landslide season to run the losses will continue to mount. The Sierra Leone tragedy was triggered by heavy rainfall, with the main event appearing to be a large landslide in the Regent area, on the margins of the city of Freetown. The best image that I have found that provides an overview of the Regent landslide is this one, from Switsalone:-
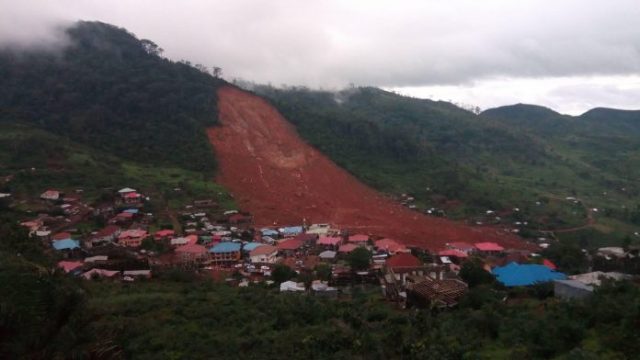
Overview of the Regent landslide in Sierra Leone. Image via Switsalone.
.
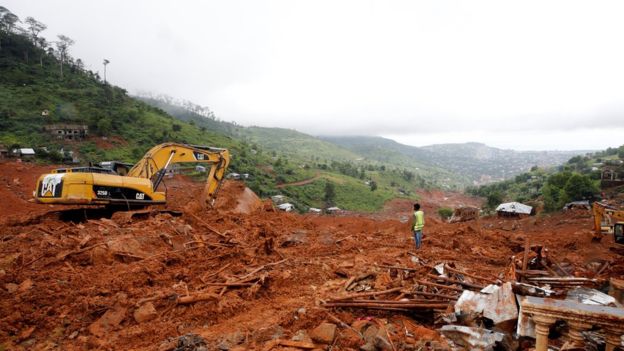
This is a large slide, but for a slide of this size to kill so many (estimates of the death toll are currently around 400, with at least another 300, and possibly 1500, still missing) is unusual and a little perplexing. The landslide appears to be in deeply weathered soil (typical of this area), with the slide occurring on the boundary between bedrock and weather material, based on this image from NBC / Reuters:
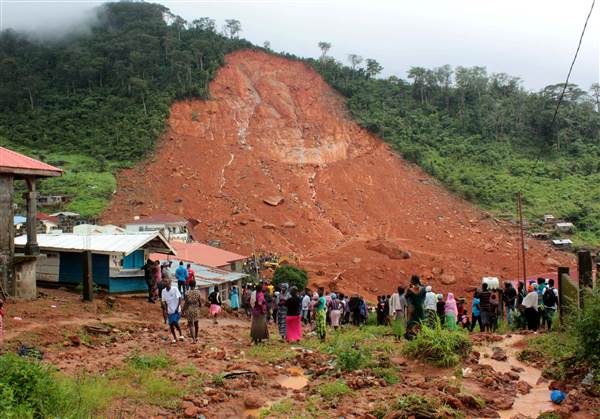
The Regent landslide scar, via NBC / Reuters / Ernest Henry.
.
Even with densely packed housing at the foot of the slope, this level of loss seems surprising to me. I wonder if the images are not capturing a high mobility component of the landslide, similar to Oso? This image, via the Guardian, is intriguing, but I cannot find an explanation for it:-
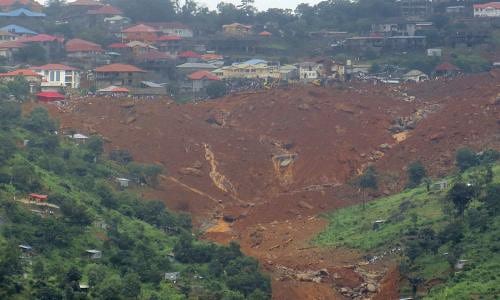
An alternative view of the Regent landslide. Image via the Guardian
.
On the face of it this appears to be a different landslide. But perhaps it is the lower portion of the main Regent landslide, showing evidence of very high mobility and, crucially, the transition into a channelised flow. This would account for the videos of high mobility flows downstream (and reports of bodies being found in the sea), and it would explain how the losses have reached such terrible numbers.
This is of course speculation at the moment, but my sense is that if lessons are to be learnt we need to piece together the dynamics of this disaster properly.
13 August 2017
Kotrupi: a landslide in northern India kills at least 46 people
Kotrupi: a landslide in northern India kills at least 46 people
On Sunday 13th August 2017 a large landslide struck two buses at Kotrupi (sometimes spelt Kotropi) on National Highway 154, the road between between Mandi and Pathankot in Himachal Pradesh, northern India. As I write, rescue operations are ongoing, but to date 46 people are known to have lost their lives. A small number of people remain missing.
The landslide occurred in a period of extreme monsoon rainfall that has triggered landslides across a large swathe of the Himalayas in India and Nepal. News reports that both buses had stopped for a tea break when the landslide occurred a little after midnight. The vehicles were swept 800 m down the slope, and were buried by the debris.
This is the Google Earth image of Kotrupi / Kotropi on SH154:-
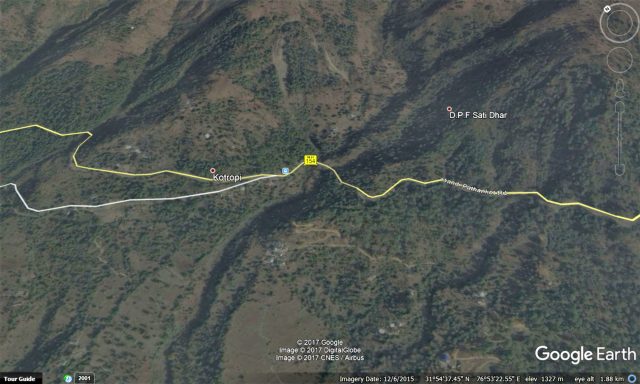
Google Earth image of Kotrupi in Himachal Pradesh, India. This is the likely location of the 13th August 2017 landslide that killed at least 46 people
.
News reports suggest that the landslide damaged some houses, so if this is indeed the setting then the location is most likely to be in this area:-
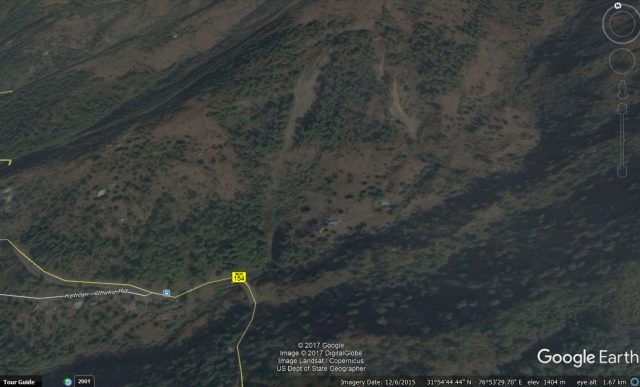
Google Earth image of the possible location of the landslide at Kotrupi.
.
Note the apparently unstable area defined by two smaller slides in the image, This may be a candidate for the disaster? This would seem to be in accordance with this image of the site, from News World India:
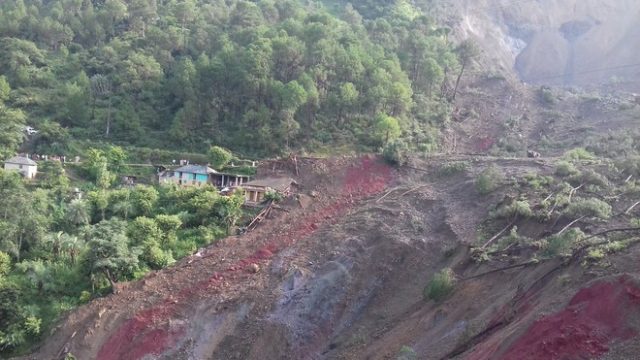
News World India image of the site of the landslide at Kotrupi in Himachal Pradesh
.
And this dramatic video of the site posted on Youtube by Deshvardhan Sharma:-
.
It is clear that this was a large, very dramatic landslide. It seems extraordinarily unfortunate that it happened when two buses were in the path of the debris. But buses in northern India are regularly struck by landslides. This extraordinary video shows an amazingly lucky escape when a bus was caught in a landslide at Pauri in Uttarakhand last week:
.
Somehow the bus remained upright in this case.
12 August 2017
La Calera landslide in Colombia – a very interesting, complex failure
La Calera landslide in Colombia – a very interesting, complex failure
Helbert Garcia of the Colombian Geological Survey has sent to me very interesting information about the somewhat complex La Calera landslide, located about 10 km to the west of Bogota in Colombia. This landslide became active on 18th July 2017 on the right bank of the Rio Blanco as a result of a period of heavy rainfall. Helbert notes that the landslide is:
classified as a rock planar slide (mudstones and shales) with a rotational slide developed at the toe on colluvium deposits.
The landslide partially blocked the Rio Blanco, leading to three towns downstream declaring a state of emergency. Fortunately, the blockage has now breached.
Helbert has kindly sent some images of this most impressive landslide to me, and I use them here with his agreement. This image shows the toe of the landslide, including the newly active section:-
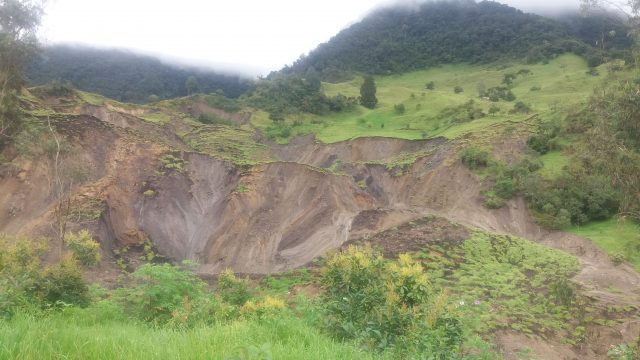
La Calera landslide in Colombia. Image by Helbert Garcia
.
Whilst this image shows the active failure in more detail:-
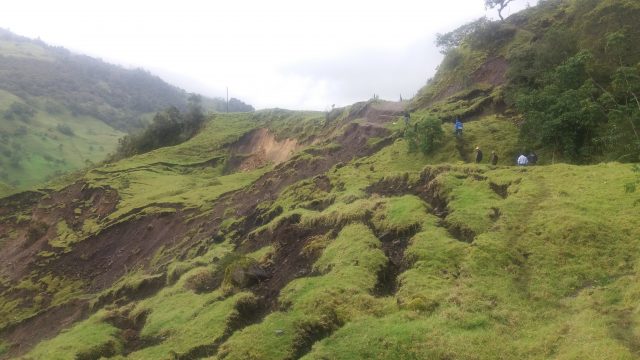
La Calera landslide in Colombia. Image by Helbert Garcia.
.
Helbert pointed out to me a very interesting aspect of this landslide that is visible in the Google Earth imagery of the site:-
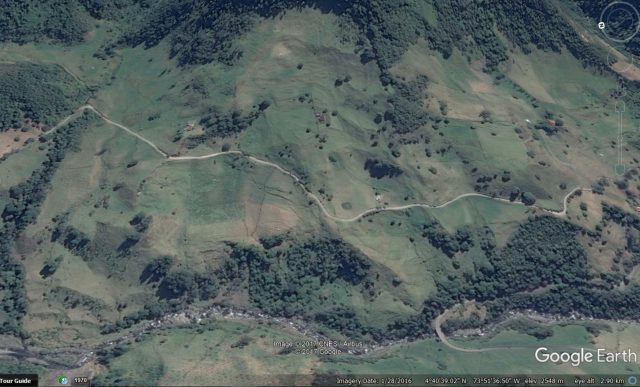
Google Earth image of La Calera landslide, Colombia.
.
Note the clearly visible tension cracks in the lower part of the landslide, just below the road,. This is the section that failed last month. But this appears to a part of a much larger landslide system, with the scar of the earlier failure extending almost to the trees. The area affected by this older landslide is much larger than the current failure, both laterally and in terms of slope length.
It is interesting to think through what this might represent. In the North Island of New Zealand we see landslide systems that are driven by incision of the river – essentially the river cuts down to expose a weak layer, and the slope then slides in a mostly planar manner until the weak material has evacuated. The system then stabilises, leaving a landslide scar, until the weak layer is exposed. We have documented this for both the Utiku landslide (Massey et al. 2013) and the Taihape landslide (Massey et al. 2016).
Colombia is tectonically active, so could this be the case here as well? This may be slightly different in that river incision is allowing the development of rotational failures at the toe, which then debuttress the slope to allow planar sliding? To test the hypothesis requires much more detailed analyses, including field mapping. But judging by the imagery I do not think this setting is unique in this area, so understanding the dynamics might allow better characterisation of the landslide hazard.
References
Massey, C.I., Petley, D.N. and McSaveney, M. 2013. Patterns of movement in reactivated landslides. Engineering Geology 159, 1-19.
Massey, C.I., Petley, D.N., McSaveney, M.J. and Archibald, G. 2016. Basal sliding and plastic deformation of a slow, reactivated landslide in New Zealand. Engineering Geology, 208, 11-28.
11 August 2017
Planet Labs imagery of landslides triggered by the Jiuzhaigou Earthquake
Planet Labs imagery of landslides triggered by the Jiuzhaigou Earthquake
The private satellite imagery company Planet Labs (Planet Team 2017) have very kindly made satellite data available showing the effects of the M=7.0 Jiuzhaigou earthquake in Sichuan Province, China on 8th August 2017. The impacts are dramatic and extraordinary. As I noted in my post immediately after the event, we expected that this earthquake would be efficient in terms of landslide generation, and this is indeed the case.
This is a Planet Labs image of the epicentral area collected the day before the earthquake:-
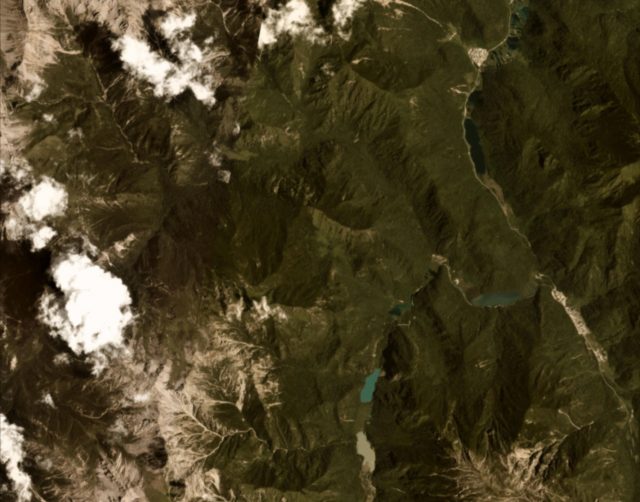
Planet Team (2017) image of the epicentral region of the Jiuzhaigou earthquake, dated 8th August 2017
.
And this is the same area the day after the earthquake:
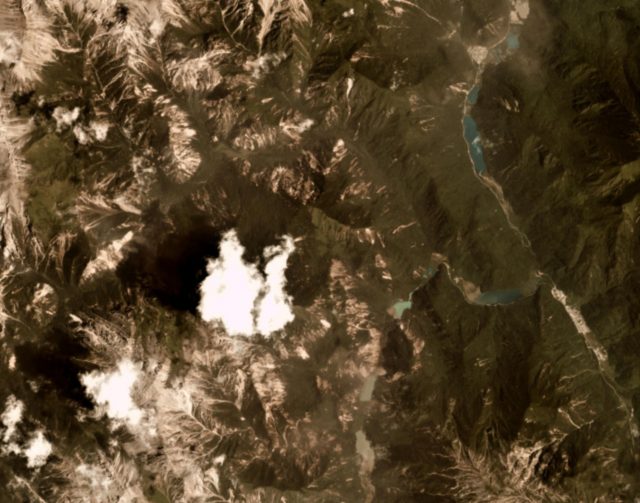
Planet Team (2017) image of the epicentral region of the Jiuzhaigou earthquake, dated 9th August 2017.
.
It is clear that the earthquake has generated a large number of landslides in the epicentral region. These slides appear to have the characteristic form of earthquake induced slides – there are large numbers in close proximity, many of which extend to the ridge lines. This reflects the effects of topographic amplification in triggering the slides at the ridges, which then travel down to the drainage line, given this landslides a long length relative to their width. Most of the slides appear to be shallow rockslides.
We can get a better understanding of this by zooming in to an area at the top of the image. This is the imagery of before the earthquake on 8th August 2017:-
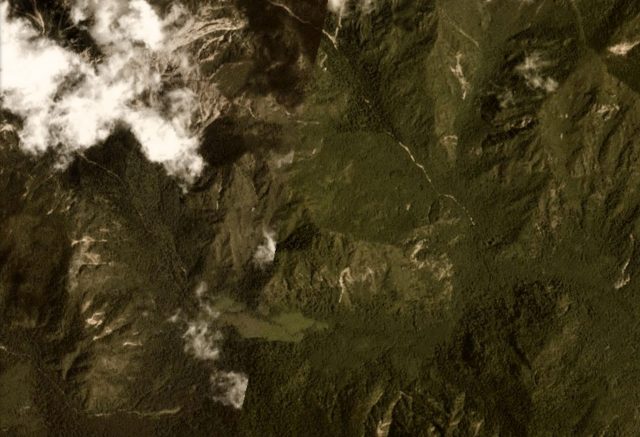
Planet Team (2017) imagery of a part of the area affected by the Jiuzhaigou earthquake, dated 8th August 2017.
.
And this is the same area a day later:-
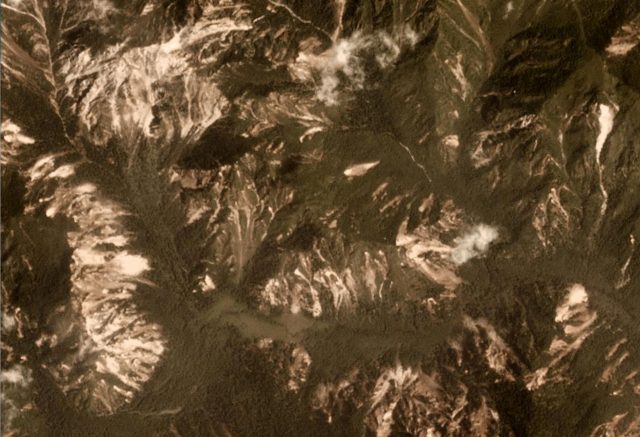
Planet Team (2017) imagery of part of the epicentral from the Jiuzhaigou earthquake, dated 9th August 2017.
.
The area affected by landsliding appears to be comparatively compact, as expected for a predominantly strike-slip event of this magnitude. In that area the landslide density is high though.
Acknowledgement
Planet Team (2017). Planet Application Program Interface: In Space for Life on Earth. San Francisco, CA. https://api.planet.com
8 August 2017
Jiuzhaigou County: a shallow magnitude 7.0 earthquake in Sichuan Province on 8th August 2017
Jiuzhaigou County: a shallow magnitude earthquake in Sichuan Province on 8th August 2017
At 13:49 UT (21:49 local time) on 8th August 2017 an earthquake struck Jiuzhaigou County in Sichuan Province in China. At the time of writing the magnitude of this event is unclear – the Chinese media are reporting M=7.0, whilst the USGS currently has M=6.5 – but either way this is a significant event. In both cases the depth is considered to be very shallow – c. 10-20 km – which means that there is a high potential for landslides. Currently, the level of loss is not clear, and is unlikely to be so until the sun comes up in a few hours, but estimates range from 40 to 190 fatalities, with a median value of 102, according to James Daniell of EDIM – CAT news.
Of course this area is no stranger to significant earthquakes. The earthquake in Jiuzhaigou County has occurred to the west of the ruptures that generated the 2008 Wenchuan earthquake. It is a characteristic of earthquakes in this area that they generate large numbers of landslides. The landscape in this region of China is steep and high, and the slopes have been preconditioned for failure by frequent earthquakes and intense rainfall events. Early indications are that this was predominantly a strike-slip earthquake – experience suggests that these events tend to generate intense landsliding close to he fault rupture, with rapid attenuation of landslide density away from the fault. It will be interesting to see if this event matches this pattern. Certainly the overlay of USGS estimates of intensity over the terrain in Google Earth suggests the potential for landslides is high:
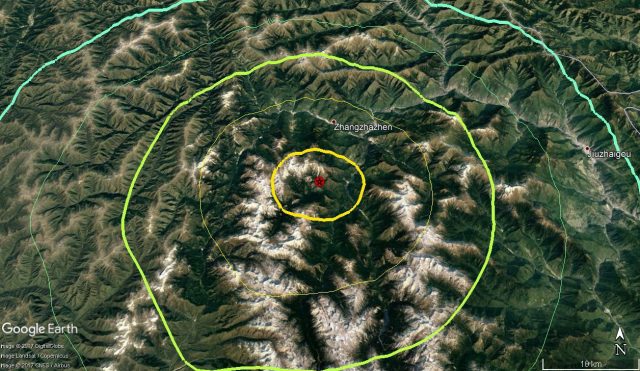
USGS intensity contours for the Juizhaigou County earthquake overlain onto a Google Earth terrain image for the area.
.
There are some early indications of landslides. This image, via Twitter, appears to show significant rockfall activity:-
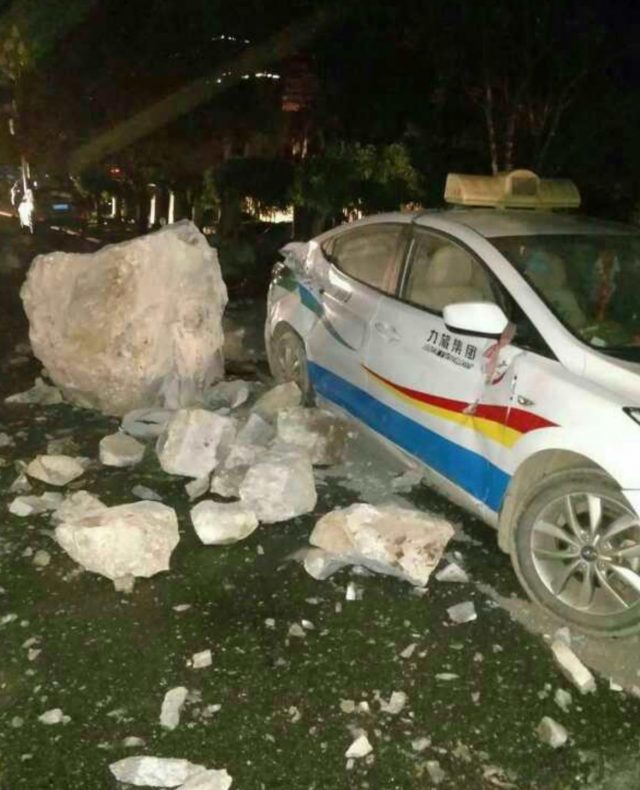
Image via Twitter of rockfall activity after the Juizhaigou County earthquake.
.
Meanwhile Earthquake Report has this image of a shallow slide (though the main issue seems to be felled trees):-
A landslide triggered by the Juizhaigou County earthquake, via Earthquake Report.
.
Meanwhile Xinhua has some reports of landslides too:
Jiuzhaigou, or Jiuzhai Valley, is a national park known for spectacular waterfalls and karst formations. More than 34,000 people visited the tourist attraction on Tuesday. “Now it is the peak travel season and there is a large number of tourists in the scenic area,” said Ye Zhi, a villager in Zhangzha. “The tourists were in panic when the quake struck and there were also stones falling down the mountain.”
Fearing risks from the complicated terrain, tourists and residents have been led to large open spaces for safety, said Ye. To avoid potential further deaths and injuries, the scenic area stopped accepting tourists.
A landslide in the tourist site left more than 100 visitors trapped, but no deaths or injuries were reported among them.
It is likely that the picture will become clearer in the next few hours.
Updates from the Karrat Fjord landslide in Greenland
Updates from the Karrat Fjord landslide in Greenland
In the aftermath of the tsunamigenic landslide in Greenland, which is now widely known as the Karrat Fjord landslide, a number of groups have been working on an analysis of the event. The NSF Rapid Team led by Hermann Fritz have some amazing 3D models online and accessible via a Vimeo page. This video provides a nice summary of their analysis:
.
In summary, their 3D models suggest a volume of 49.6 million m³, a fall height of 1200 metres to the fjord, and a total volume entering the water of 45 million m³. In that context the resultant tsunami is perhaps unsurprising.
Note also the very clear imagery of the second area of intense slope deformation, with up to 50 metres of displacement. This site remains a concern.
There are also some nice analyses of the seismic signal from the landslide. Notable is an excellent IRIS Special Event page, which presents various analyses of the seismic data. It is worth taking a look at the comments section too, and in particular an observation by John Vidale that there are clear indications of precursory seismic events in the data:
Jackie Caplan-Auerbach noticed these accelerating precursory pops on the NUU record spectrogram. This probably indicates that the failure process started at least several hours earlier.
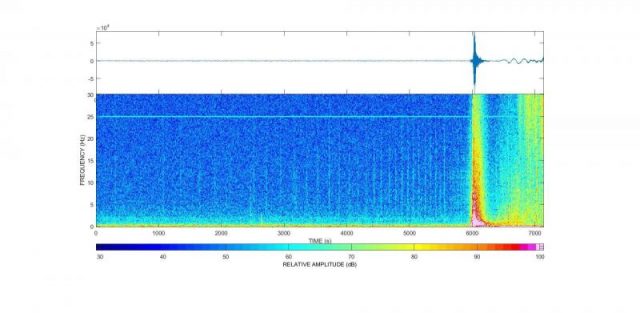
Analysis of the seismic data from the Karrat Fjord landslide, possibly showing precursory events. Image by Jackie Caplan-Auerbach via John Vidale.
.
Temblor also has a very nice initial analysis of this event. The interpretation here is incorrect – they made the common mistake of interpreting the seismic signal as an indication of the event that triggered the landslide, not of the landslide itself. We saw similar misinterpretations with respect to the Seti River landslide in Nepal too. It is notable that they have been honourable in leaving the uncorrected page online, allowing experience to be learnt. They have subsequently published a corrected interpretation, which provides additional insight.
Finally, Nature has a nice article, subsequently picked up by others, on the work by local scientists. Interestingly, they suggest that in the immediate proximity to the landslide the tsunami may have been 90 metres high, and 50 m on the other side of the fjord.
 Dave Petley is the Vice-Chancellor of the University of Hull in the United Kingdom. His blog provides commentary and analysis of landslide events occurring worldwide, including the landslides themselves, latest research, and conferences and meetings.
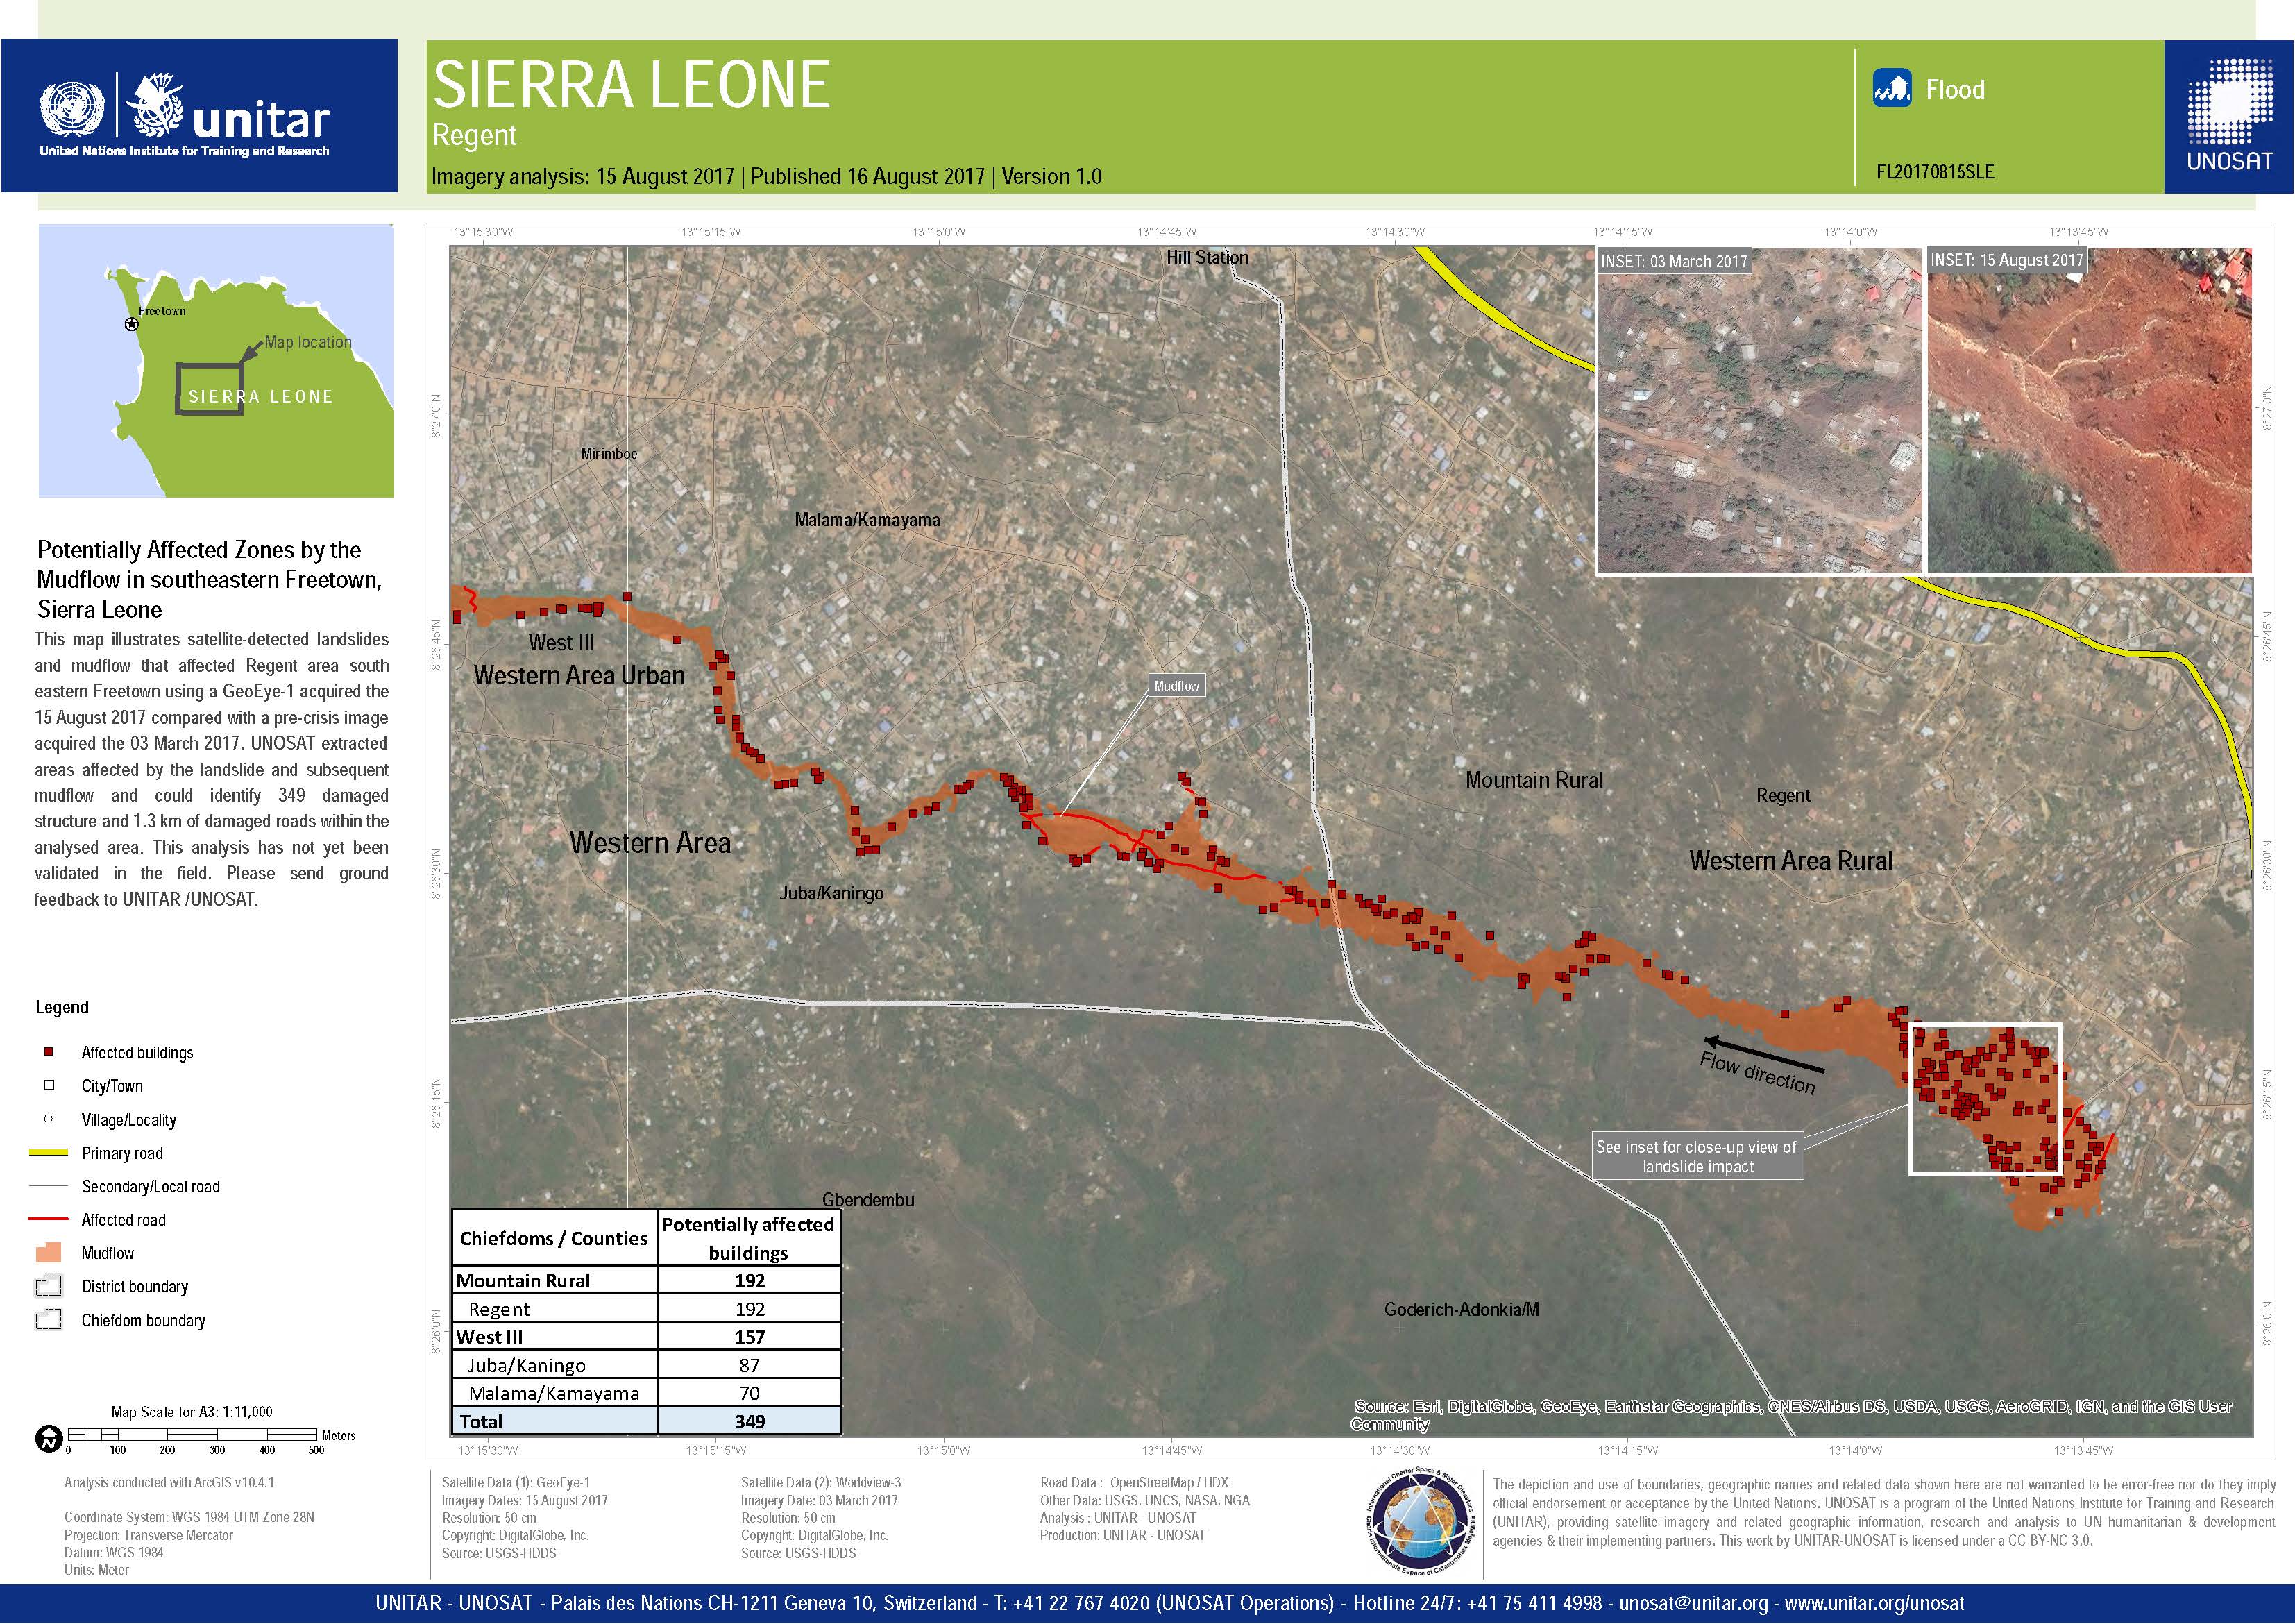
Recent Comments