
19 September 2010
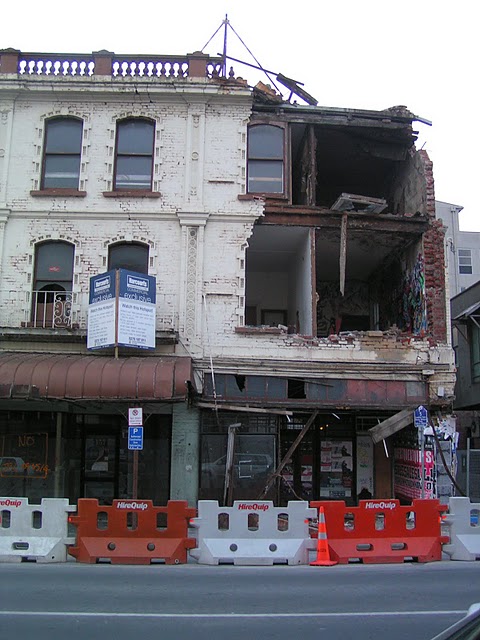
Earthquake damage in Christchurch – an ironic billboard
This billboard, which predates the Darfield earthquake, was attached to a building in the Central Business District of Christchurch in New Zealand:

Do you think this is what they had in mind when they described the “open plan office with balcony access” and “cool funky office environment”?:
18 September 2010
Images of the Darfield (Canterbury) earthquake fault rupture
Yesterday I was exceptionally fortunate to be able to spend the morning looking at the surface expression of the fault responsible for the Darfield earthquake, which hit the Canterbury plains area of New Zealand a fortnight ago. I was kindly guided around by Russ Van Dissen of GNS Science, and the visit was organised by Chris Massey, also of GNS – so many thanks to them. This GNS map shows the surface expression of the fault across the Canterbury Plain:
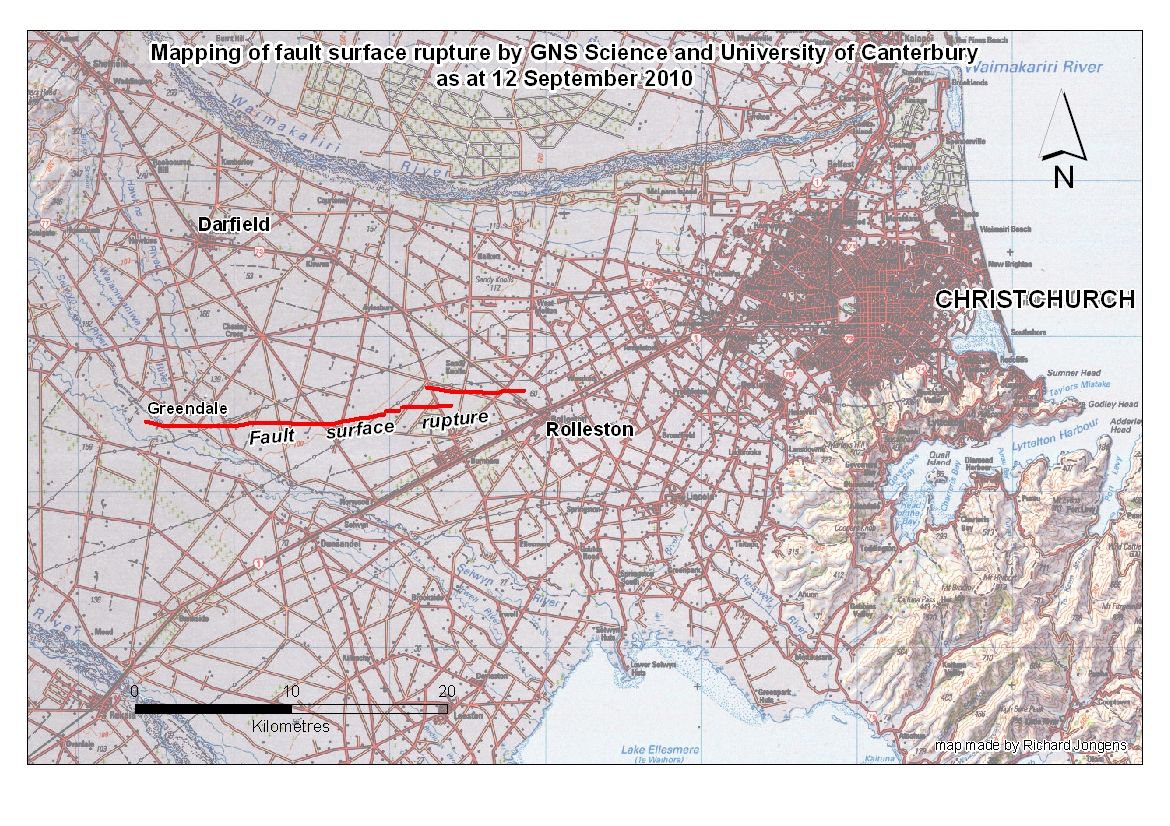
These pictures will work from east to west.
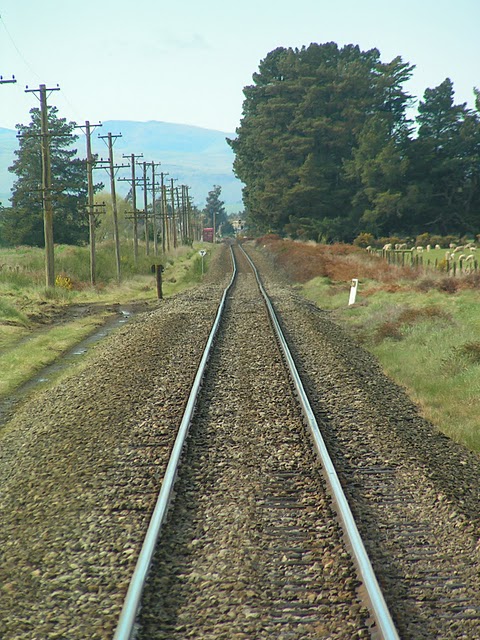
The east-most expression of the fault occurs close to the town of Rolleston, where a railway track crossed the fault. The rails have been repaired, but the kink in the formerly straight railway track is fairly obvious.
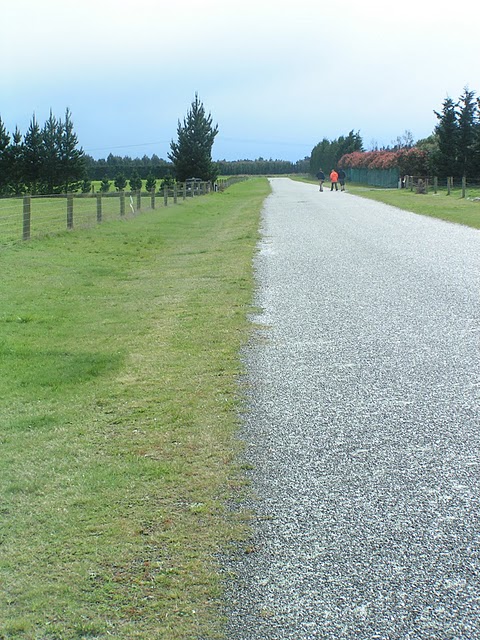
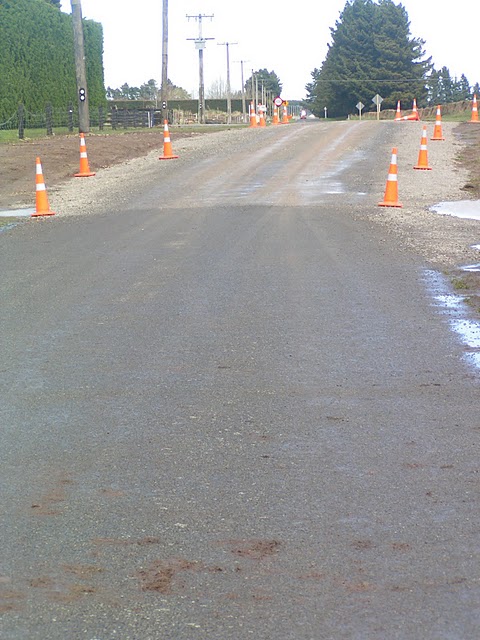
Just around the corner a road crosses the fault as well. Here the damage, again to the formerly straight road, is unrepaired as the fault is expressed as a broad deformation zone accommodating about 60 cm of movement:
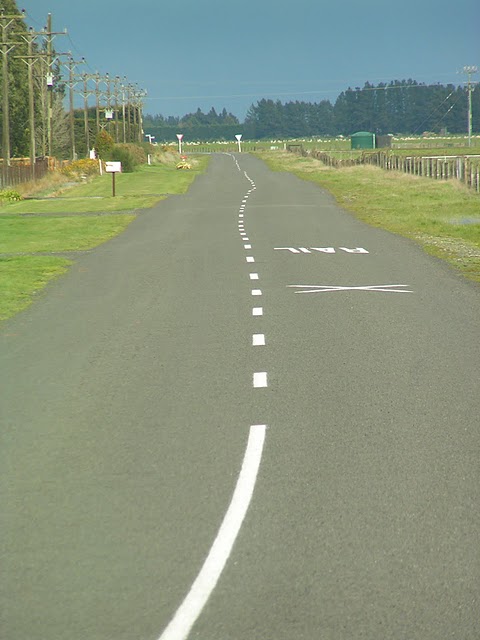
If you are struggling to see the feature, remember that the road stretching into the distance (not the bit at the very bottom of the picture) was straight before the earthquake. You should be able to see that from the middle of the image the road has been shifted to the right. In this area there is little evident vertical change, bearing in mind that the surface was not perfectly flat before the earthquake.
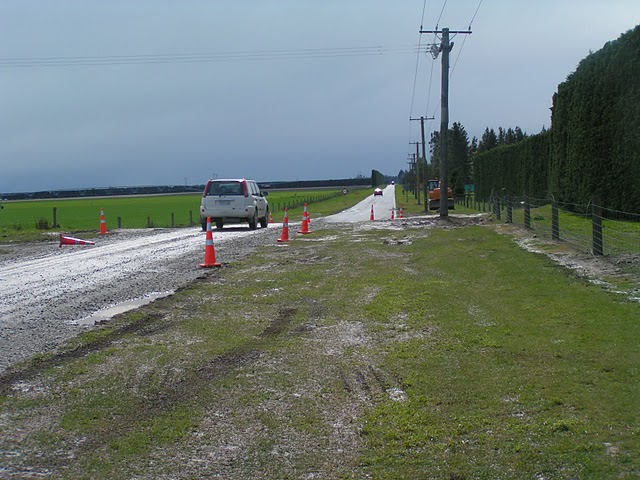
A few kilometres to the west there is another formerly-straight road crossing the fault. Here we see a little more lateral movement – actually about a metre. Again, there is no vertical movement. The movement is evident in this image – look at the alignment of the edge of the road:
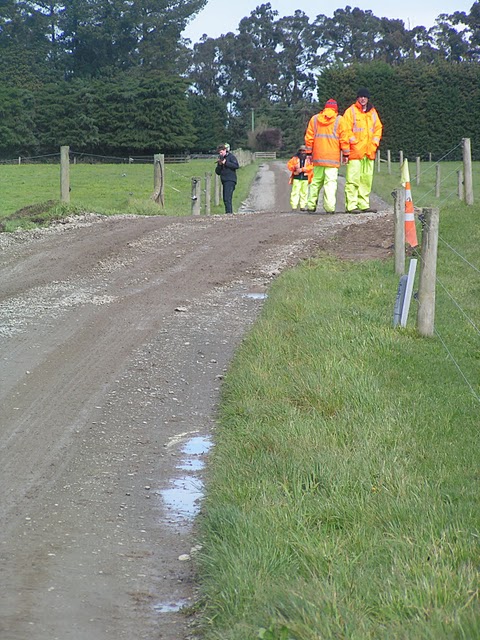
Lets now jump a few more kilometres to the west, where things start to get really interesting! Another formerly straight road is our indicator of strain – but now it is becoming difficult to believe that this happened in a single 30 second event (I can assure you it did):
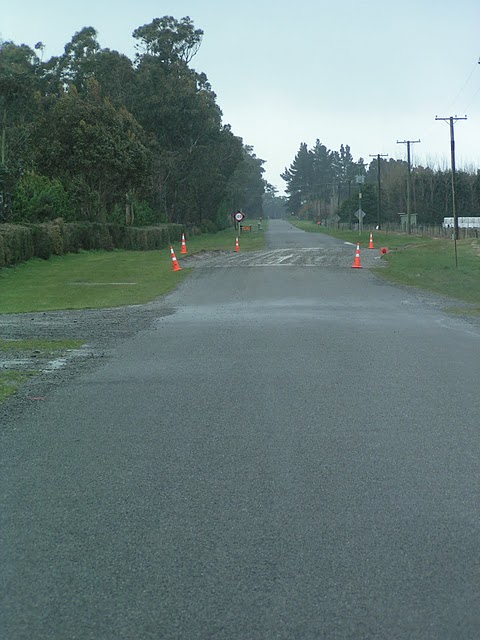
Note here the highway people have resurfaced the road, so the original cracks are no longer visible. There is a ditch running down the side of the road that also shows the deformation rather clearly:
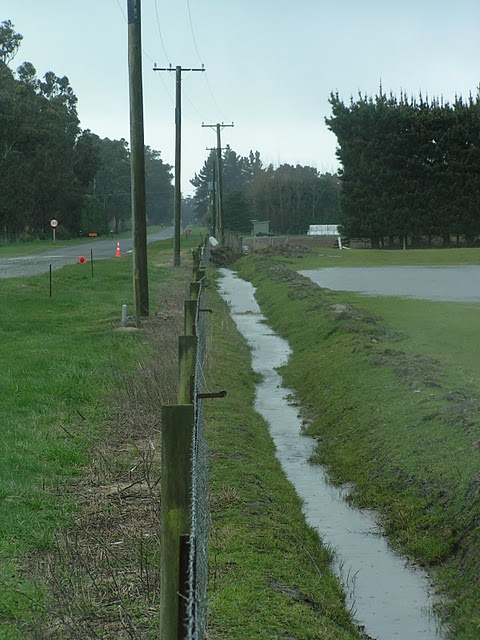
The movement here is about 3 metres or so. Again there is little evidence of vertical deformation.
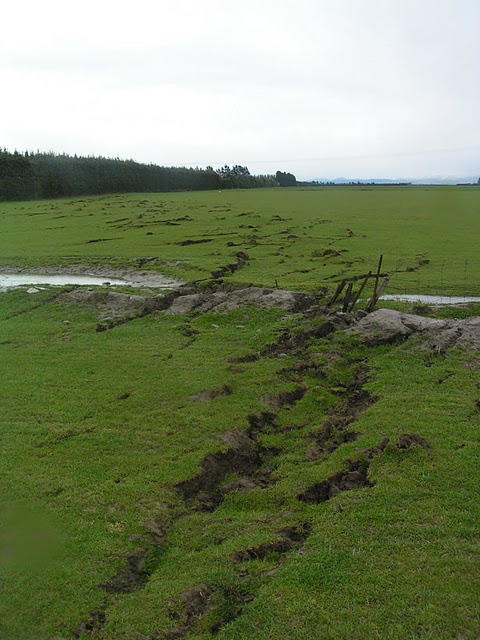
The farmer at this site very kindly allowed us to enter his field (please do not do this without permission), where the array of cracks, and associated deformation, is astonishing. GNS have an aerial view of the field here; below is the ground view:
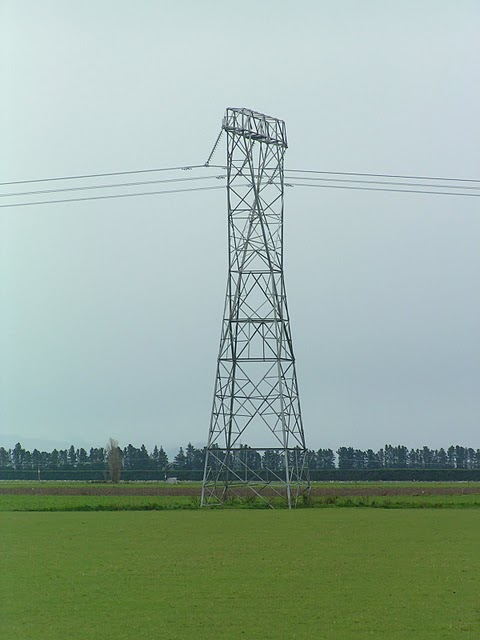
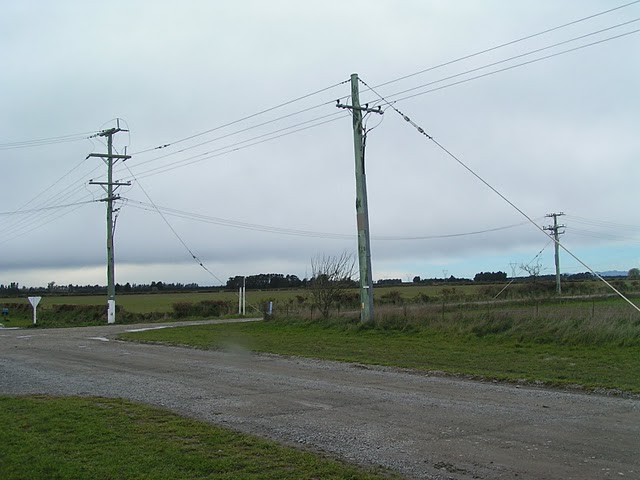
The movement of the fault is evident in the power lines that cross the fault here. The movement of the fault has put the cables under tension, meaning that the insulators (the pieces that join the cable to the pylon) are no longer hanging vertically:
A few more kilometres to the west and we are into the maximum displacement area. Here we see over 3 metres of horizontal deformation and about 1.5 metre vertically. This is the view from the hanging wall side – the drop down onto the footwall, and the lateral motion should be evident:
The picture below was taken on the footwall side looking back towards the fault – note the horizontal motion (the road has been patched up) and the vertical change. Remember that this was a straight road across a flat plain before the earthquake:
The maximum deformation is recorded a little to the west again, where a road is offset by almost its entire width, indicating movement of about 4 metres. There is some vertical deformation to
o, but this appears to be more of a ground roll than a true vertical movement of the hanging wall block:
Our last site is at the western end of the fault trace. Here the surface expression of the fault is reducing, leaving a small step in the road that is quite hard to see. The best evidence is from the power cables, some of which are now very tight (those on the upper right), whilst others are very slack (those linking to the pole on the far right). Note how the tension cable supporting the pole on the left has also gone loose – this would have been taut before the earthquake:
It is at this point, almost perfectly on the fault, that the highest accelerations were measured.
I hope this gives a useful overview of the fault. I am happy to answer any questions, though Geonet and GNS Science are the experts.
Comments welcome
16 September 2010
Zhouqu landslide – NASA satellite image
NASA have somehow managed to find a gap in the clouds to collect a satellite image of the Zhouqu landslide site. Readers at the time of the landslide last month will remember that I was wondering about the source of the slides. Although this image does not give a full answer, it gets us a part of the way there:
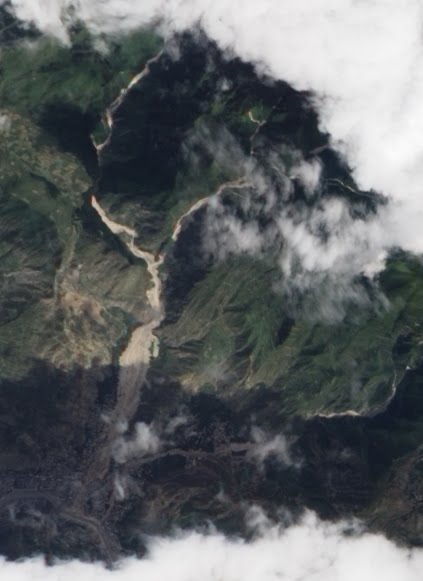
A zoom into the affected area yields this:
The slides (note the smaller one to the right of the main event) clearly originated as a series of smaller slips on the walls and headwaters of the upstream catchments. These appear to have coalesced to form the main events. This is consistent with processes observed elsewhere during periods of exceptional rainfall.
Meanwhile, I am now in Christchurch in New Zealand, site of the earthquake of 12 days ago. Every 30 minutes or so my chair shakes as an aftershock rattles the area, which is a very surreal experience.
14 September 2010
Road failure video from Thailand
Thanks to my former student Kurtis Garbutt for the heads up on this one. The video below shows the progressive development of a road in Thailand. I suspect that this initiated as a culvert failure, with multiple collapses due to undercutting:
The final frames of the video show an overview of the site. Check out where the people are standing!
As an aside, Kurtis also runs a very interesting blog on natural hazards – take a look. It is a very useful resource with a scope that goes way beyond my site.
11 September 2010
Pakistan floods – the extraordinary duration of the elevated water levels
The floods in Pakistan may have faded from the headlines in Europe, but unfortunately the impact continues, even though the rainfall events that caused them occurred more than a month ago. The most dramatic illustration of this is a set of satellite images collected by NASA using the MODIS instrument.
This is an image of the area around Sukkur taken on 7th July, before the rainfall event that initiated the disaster:

By way of comparison, this image was taken on 7th September, showing the same area:
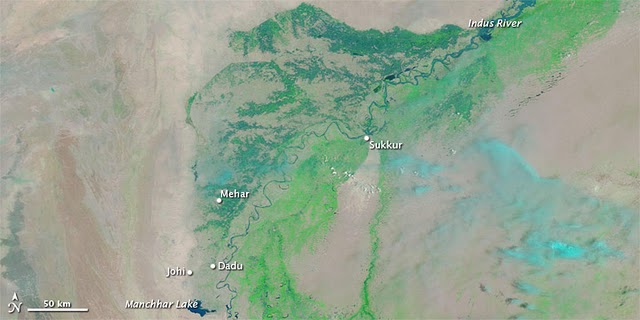
Two things to note. First the extensive flooding along the line of the main part of the Indus remains. This may well be an indication that water is draining very slowly from behind the broken levees, which are now serving to keep water in despite their failure to keep the water out in the initial event. Such problems with broken levees are common. Second, note the parallel course of the Indus that has been created, where the flooding is much more intense. I assume that this is the river occupying one of its old drainage paths. The problem here may be that the downstream end of this huge (check out the scale bar on the imagery) new watercourse is Mancchar Lake. This is an artificial lake, created in the 1930s, with a range of existing environmental problems. The lake appears to be connected to the main Indus River by just two small canals (see Google Earth image below):

This limited drainage path is may cause the floods to drain very slowly, prolonging the agony for those affected. The flood waters must now be highly polluted, increasing the potential for health problems for the affected population.
10 September 2010
Ruapehu lahar information
One of the many highlights of the splendid IAEG Congress in Auckland this week was a talk by GNS geologist Chris Massey on the 18th March 2007 lahar at Mount Ruapehu on North Island. The lahar occurred as a result of the failure of a tephra wall holding back the crater lake at the summit, and is shown by this NASA image:
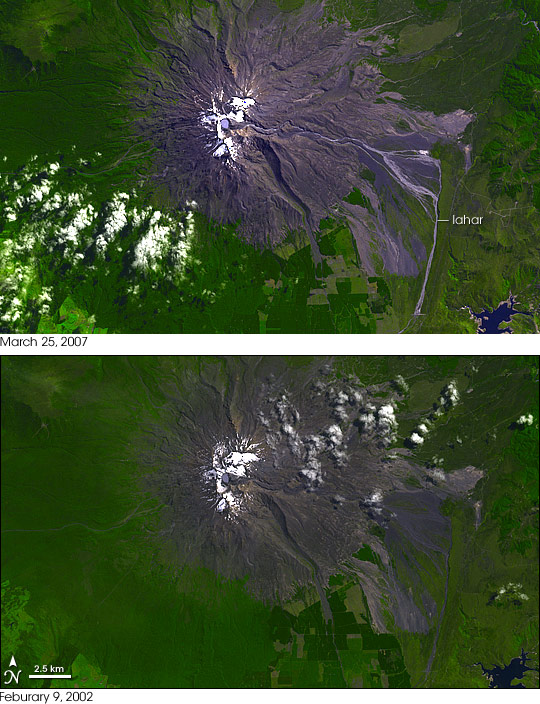
The potential for a lahar had been anticipated and the site was intensively monitored with real time instruments such as water level sensors and geophones; with two web cams; and with periodic surveys using a terrestrial laser scanner. An emergency plan was in place and worked well. The need for caution was undeniable – on 24th December 1954 a lahar from the same site demolished a railway bridge at Tangiwai, killing 151 people on a train that tried to cross a bridge that had been destroyed by the lahar.
The event has been written up in a paper (Massey et al. 2010), and there is a spectacular set of images of the event captured by the web cam available here (NB it took me a while to get my eye into these images).
An interesting aspect of this event is that one can examine just how good the natural hazard science community is at assessing hazard. There is a New Zealand Civil Defence report, written in 2002, about the threat of a lahar at Ruapehu online here.
Reference
Massey, C., Manville, V., Hancox, G., Keys, H., Lawrence, C., and McSaveney, M. 2010. Out-burst flood (lahar) triggered by retrogressive landsliding, 18 March 2007 at Mt Ruapehu, New Zealand—a successful early warning. Landslides 7 (3),303-315, DOI: 10.1007/s10346-009-0180-5.
Italian debris flood video
Thanks to Ivan Montanari for highlighting this one. Youtube has an extraordinary video of a debris flood that appears to have occurred yesterday at Atrani on the Amalfi Coast in Italy:
The video makes a slowish start, so keep watching. This is the first debris flow of cars that I have seen on video…! This is a Google Earth perspective image of Atrani:
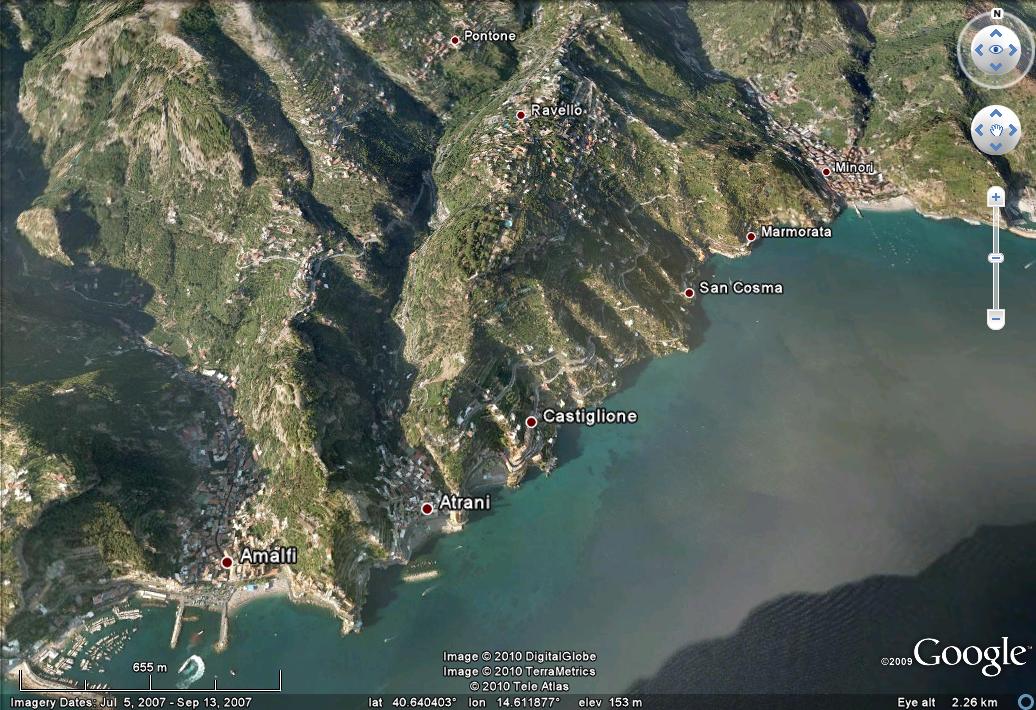
I guess it is not hard to see how very heavy rainfall, or another hydrological event in the catchment, can lead to such an event.
9 September 2010
A round up of intersting events and documents in the world of landslides and slopes
1. Please vote for a slope monitoring project
One of the recurrent themes of the IAEH Congress is the growing importance of slope monitoring techniques to provide warning of the development of failure. One of the most exciting projects is the ALARMS project, led by Prof. Neil Dixon at Loughborough University, which is developing techniques that use acoustic emissions to monitor slope movements. The project has been entered into an Enterprise competition at Loughborough University, which will be decided by a free vote. So, please can you visit this page: http://www.lboro.ac.uk/business/enterprise-awards/ and vote for the Alarms project. It would be a very worthy winner of the prize.
2. Manual on Engineering Geological Practice in Hong Kong
On behalf of the Hong Kong Geotechnical Engineering Office, AECOM have produced a new manual on engineering geological practice in Hong Kong. Unsurprisingly, it has a strong slopes and landslide component, and it is relevant in areas outside of Hong Kong itself. This can be downloaded as a pdf for free here. I recommend it – I think that it will become a very useful guide and reference text.
3. 11th Symposium on Landslides (ISL)
The big four yearly slopes event is the ISL, which was last held in Xian, China. The next event is in June 2012, and will be held in Banff, Alberta Canada. This should be a fantastic event in a wonderful location. The meeting now has a website, and the call for abstracts has been released, with submissions due by 15th April 2011. Get writing!
4. Slope Stability 2011
In September 2011, Canada will also host a conference on rock slope stability, with a strong emphasis on the mining industry. This event, which will be held in Vancouver, will be a great opportunity for academics and practitioners to interact. The site has a website, and again a call for abstracts is out, with a deadline of 7th January 2011.
IAEG presentation and paper on Attabad
Today I presented an invited paper at the 11th Congress of the IAEG in Auckland, New Zealand on the topic of landslide hazards along the Himalayan Arc. This paper starts by looking at global and regional landslide hazard before presenting the state of play at Attabad. As usual, I have uploaded the PowerPoint file to Authorstream, such that you should be able to both view and download it below:
10_09 IAEG petley v2
http://www.authorstream.com/player/player.swf?p=510367_634195791590085000
The written paper has been published in the conference proceedings. I do not have a pdf of the actual printed version but I do have one of the final manuscript. I am working on putting that online, so watch this space.
A pdf of the paper itself is available here:
http://www.mediafire.com/file/w34v38zb4uvzcj4/10_06%20Petley%20invited%20final.pdf
Note that this paper contains a map of global landslide losses in terms of fatalities and some data both for global losses and for those in the Himalaya.
Note that the typeset format is slightly different from that of the actual published paper, but the content is the same. The reference to the paper is:
Petley, D.N., Rosser, N.J., Karim, D., Wali, S., Ali, N., Nasab, N. and Shaban, K. 2010. Non-seismic landslide hazards along the Himlayan Arc. In: Williams, A.L., Pinches, G.M., Chin, C.Y., McMorran, T.J. and Massey, C.I. (eds) Geologically Active. CRC Press, London, pp. 143-154.
3 September 2010
Updated: The New Zealand earthquake
Bizarrely, I am currently sitting in the QANTAS lounge at Sydney Airport waiting for a flight to New Zealand, where the IAEG Congress starts on Monday. The theme of the conference is “Geologically Active”…
So, what do we know about the earthquake so far. The best source of information is the Geonet site – http://www.geonet.org.nz/ – which puts seismic data online in real time. They are reporting that the earthquake occurred at 4:35 am local time 30 km west of Christchurch at a depth of (now updated to) 10 km. The reported magnitude is (now updated to) 7.1 – USGS is reporting 7.0, but this is probably a moment magnitude. This is the isoseismal map from Geonet:
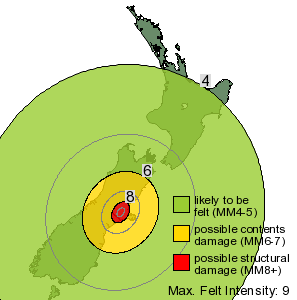
This suggests that some damage in the Christchurch area is likely, which seems to be confirmed by the initial news reports. Hopefully the timing of the earthquake, and the high level of preparation for earthquakes in New Zealand, will mean that casualties will be light and damage manageable. Perhaps the most interesting data at this stage is the map of locations in which people have reported they felt the earthquake. This looks like this at the time of writing. The dark orange dots represent an intensity sufficiently large to cause significant damage:
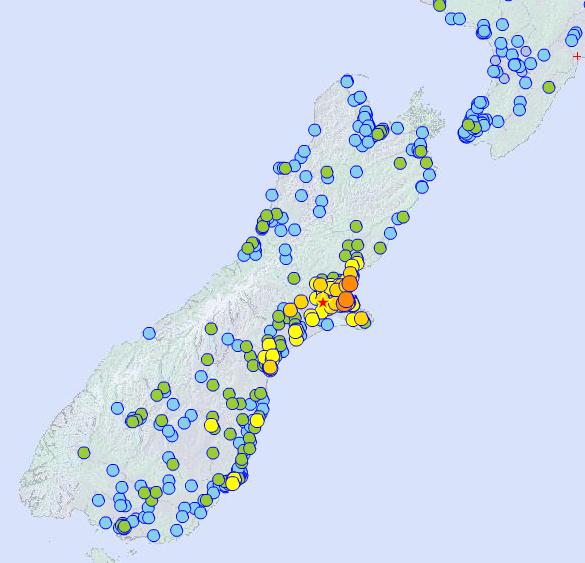 |
| GEONET shake map |
| There are no reports of landslides as yet, but given the proximity of the Southern Alps some landslides are likely: | |
 |
|
| More later. | |
 Dave Petley is the Vice-Chancellor of the University of Hull in the United Kingdom. His blog provides commentary and analysis of landslide events occurring worldwide, including the landslides themselves, latest research, and conferences and meetings.
Recent Comments