
9 December 2016
The landslide distribution from the M=7.8 Gorkha Earthquake in Nepal
The landslide distribution from the M=7.8 Gorkha Earthquake in Nepal
In the aftermath of the M=7.8 Gorkha Earthquake in Nepal last May, there has been a sudden and very welcome interest in landslides in that country. A number of groups undertook mapping of the landslide distribution, and the publications are now starting to appear. In a paper just published in Landslides (Martha et al. 2016), a group from the National Remote Sensing Centre and India have analysed an inventory of coseismic landslides triggered by the earthquake. The results are interesting. They have used a range of high resolution satellite instruments to generate a high quality landslide map. India has some wonderful satellites that represent ideal tools for this purpose, although the team have also used a range of other instruments as well. The upshot is probably the best landslide inventory published to date.
The raw statistics are important. Martha et al. (2016) have mapped 15,551 landslides triggered by the M=7.8 Gorkha Earthquake in total, including 213 landslides triggered by the large aftershock in Dolakha. The total volume of the landslides is about 620 million cubic metres. Whilst this number of landslides sounds high, it is probably much lower than we had anticipated for an earthquake of this magnitude in the highly unstable mountains of Nepal. The reasons for this remain unclear.
The most interesting aspect of the paper though is that the spatial correlation between the landslides triggered by the earthquake and the peak ground acceleration is weak. There is a strong correlation with slope angle (this is always the case), but the landslides occurred in a zone to the north of the earthquake affected area that does not correspond with the high peak ground accelerations. This diagram, from the paper, shows this rather nicely:-
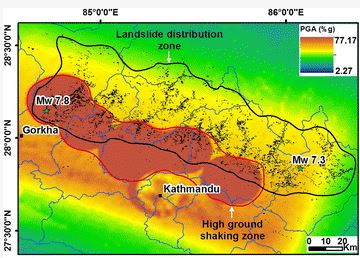
The landslide distribution in relation to the Peak Ground Acceleration, from Martha et al (2016)
.
Whilst it might be tempting to explain this by the distribution of steep slopes, I do not think that this alone explains the result. Thus, in the case of the M=7.8 Gorkha Earthquake, the landslide distribution is more complex than one might have expected. Martha et al. (2016) make the point that the landslide distribution seems to have been strongly controlled by the behaviour of the fault rupture, and that the spatial termination of the landslides towards the east seems to be controlled by the termination of the rupture event. I think this is spot on. Below is an INSAR map of the tectonic ground deformation caused by the earthquake. You can get an idea of the location in relation to the map above using the location of the epicentre of the mainshock to the west and the M=7.3 Dolakha aftershock to the east (with the cluster of aftershocks that followed that event:
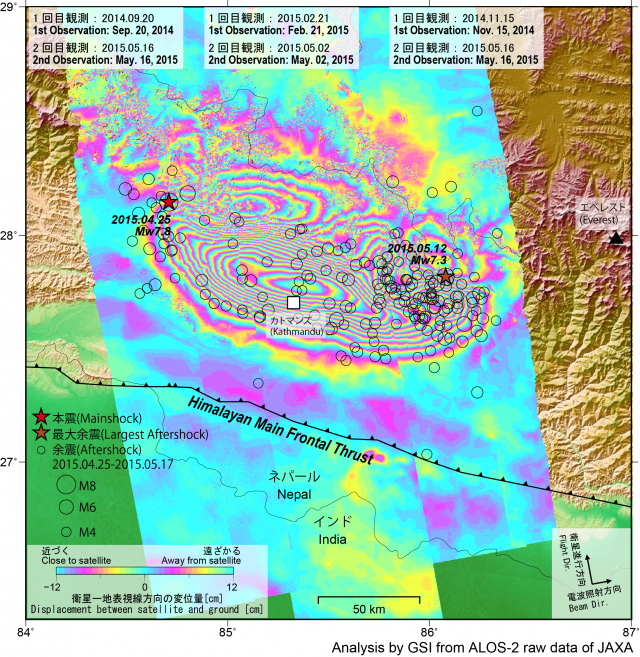
INSAR data showing tectonic deformation from the M=7.8 Gorkha Earthqhquake in Japan, via GSI Japan
.
And this is a map of the aftershocks, published in an open access paper by Ichiyanagi et al. (2015). Note that this is from an array in Kathmandu, so the distribution towards the west may not be as complete:
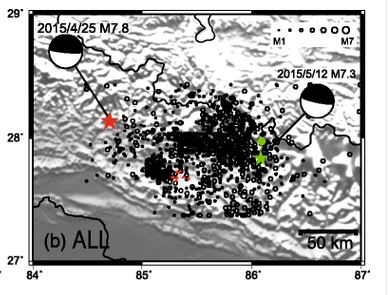
The distribution of aftershocks from the M=7.8 Gorkha earthquake in Nepal, from Ichiyanagi et al. (2016)
.
In general the high density of aftershocks lies in the northern area of the fault rupture, as does the landslides. These aftershocks did not trigger the landslides, but the similarity in extent suggests that the dynamics of the behaviour of the fault plays a strong role in controlling the landslide distribution.
The authors of the paper in landslides have made the inventory data available via the Bhuvan tool.
References
Ichiyanagi, M., Takai, N., Shigefuji, M., Bijukchhen, S., Sasatani, T., Rajaure, S., Dhital, M.R. and Takahashi, H. 2015. Aftershock activity of the 2015 Gorkha, Nepal, earthquake determined using the Kathmandu strong motion seismographic array. Earth, Planets and Space, 68, 25. DOI: 10.1186/s40623-016-0402-8.
Martha, T.R., Roy, P., Mazumdar, R. et al. (2016). Spatial characteristics of landslides triggered by the 2015 Mw 7.8 (Gorkha) and Mw 7.3 (Dolakha) earthquakes in Nepal. Landslides. doi:10.1007/s10346-016-0763-x
8 December 2016
Civita di Bagnoregio: the worlds first landslide museum?
Civita di Bagnoregio: the worlds first landslide museum?
The village of Civita di Bagnoregio in the Province of Viterbo of Central Italy is located about 120 km from Rome. The settlement was founded about 2500 years ago, but was essentially abandoned in at the end of the 17th Century as a result of a major earthquake on 11th June 1695, which triggered a major landslide below the town. The vulnerability of this site to landslides in evident from photographs of the village:
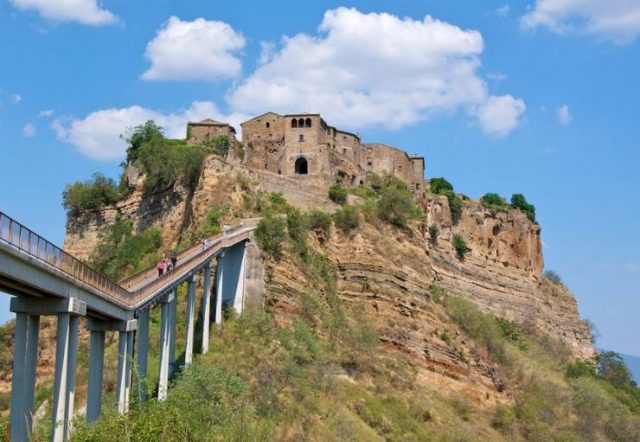
The village of Civita di Bagnoregio via nomocch on Panoromio
.
The town is located on a cliff 200 m high formed from a c.20 m thick layer of jointed Quaternary ignimbrite (a deposit formed from pumice fragments deposited by pyroclastic flows) sitting over a layered pyroclastic deposit. Sitting below this is a weak Tertiary clay formation. This is a classic setting for landslides, of which Civita di Bagnoregio has a long history. Indeed, in a new paper in Landslides, Margottini and Di Buduo (2016) document over 150 landslide events dating back to 1373 AD, but noting that this might well be an underestimate. A quick look at the Google Earth imagery explains why:
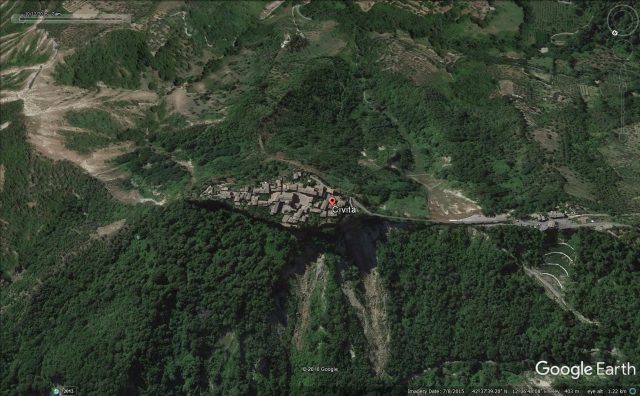
Google Earth imagery of the village of Civita di Bagnoregio
.
In recent years the town has gone through something of a revival due to tourism, perhaps unsurprisingly. To capitalise, the local government (Administration of Bagnoregio) has established a Geological and Landslide Museum in the Palazzo Alemanni in the centre of the village. The museum opened in April 2012. It cover three floors, dedicated to providing information about research on landslides. Unsurprisingly there is a strong focus on the nature and impact of landslides in the Civita di Bagnoregio locality. The museum also organises conferences, temporary exhibitions and educational activities.
I am not aware of any other museum dedicated to landslides. I have yet to visit – I think a trip to Italy might be in order!
Reference
Margottini, C. & Di Buduo, G. 2016. The Geological and Landslides Museum of Civita di Bagnoregio (Central Italy). Landslides doi:10.1007/s10346-016-0778-3
7 December 2016
The Icy Bay landslide in Alaska: a nice video describing the link with glacial melting
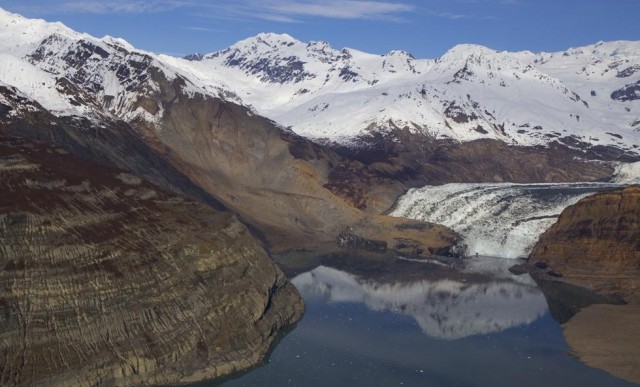
The Icy Bay / Tyndall Glacier landslide via Chris Larsen at the Geophysical Institute of The University of Alaska Fairbanks
.
The Icy Bay landslide in Alaska
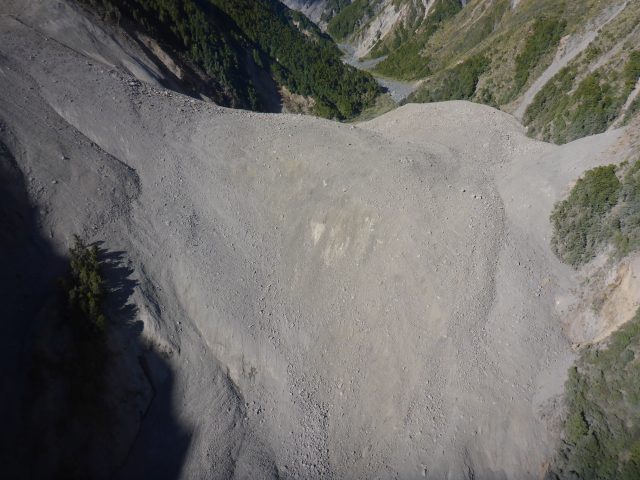
A very nice video has been posted on Youtube describing the link between the giant Icy Bay landslide in Alaska in 2015 (this landslide is also variously known as the Taan Fjord landslide and the Tyndall Glacier landslide), which is the largest known recent landslide in North America, and the melting of the adjacent glacier. The video features Dr Michael Loso, physical scientist at Wrangell-St. Elias National Park. The landslide, pictured above, occurred on 17th October 2015 occurred on the flanks of Taan Fjord in Icy Bay in Alaska. I featured this landslide, which was detected via the seismic detection system developed by Goran Ekstrom and Colin Stark, in a blog post at the start of this year. As noted above, this is the largest recorded landslide in North America, with a volume of about 72 million cubic metres and a mass of about 180 million tonnes. The landslide generated a large tsunami that caused extensive damage along the flanks of Taan Fjord.
.
Many thanks to Nathan Soboleff for pointing this one out to me.
A video about the landslides from the Kaikoura earthquake
Meanwhile, work to manage the many landslides from the Kaikoira earthquake continues. GNS Science has posted a nice video in which Dr Chris Massey explains some of the key features of the landslides, and the work they are doing to try to monitor them:
.
Other posts that might be of interest regarding giant landslides in Alaska
- Glacier Bay Landslide in Alaska: a satellite image and new videos
- Lamplugh Glacier rock avalanche: A massive new landslide in Alaska on Tuesday
- The Tyndall Glacier landslide: images from the University of Alaska Fairbanks
- The Tyndall Glacier landslide in Alaska: the largest recorded non-volcanic landslide in North America
- Sitka landslide in Alaska – the potential power of simple geomorphic mapping
- Ferebee Glacier: another rock avalanche in Alaska
- Mount La Perouse: Sunday’s rock avalanche in Alaska has been found
- Breaking news: a very large landslide in Alaska on Sunday
5 December 2016
Lidar – the amazing landslide mapping tool
Lidar is defined by Wikipedia as:
a surveying method that measures distance to a target by illuminating that target with a laser light. The name lidar, sometimes considered an acronym of Light Detection And Ranging, (sometimes Light Imaging, Detection, And Ranging), was originally a portmanteau of light and radar. Lidar is popularly used to make high-resolution maps, with applications in geodesy, geomatics, archaeology, geography, geology, geomorphology, seismology, forestry, atmospheric physics,[4] laser guidance, airborne laser swath mapping (ALSM), and laser altimetry. Lidar sometimes is called laser scanning and 3D scanning, with terrestrial, airborne, and mobile applications.
The Washington State Department of Natural Resources has the most brilliant example of the ways in which Lidar can transform landslide mapping. One of the great strengths of Lidar is that it can give the form of the land surface through dense vegetation. This works because a small proportion of the laser pulses make it through the vegetation and back to the sensor. These pulses can be filtered from the main data to provide a model of the land surface. Although these returns represent only a small proportion of the total data points, the density of information generated by Lidar can mean that in all but the most densely vegetated areas there is enough data to resolve the ground surface.
This is a Google Earth image of an area of the Cedar River south of North Bend in Washington State.
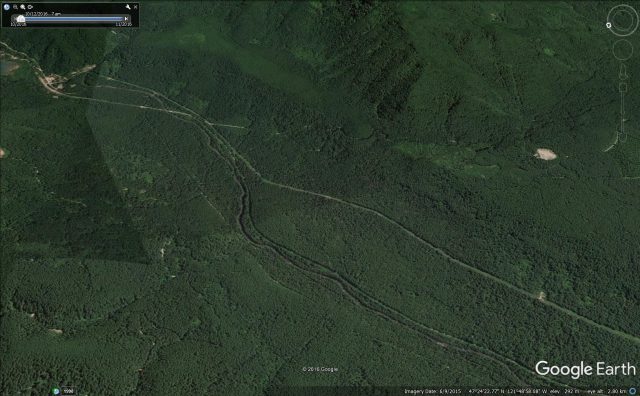
Google Earth image of landslides on the Cedar River Valley south of North Bend by Rattlesnake Ledge.
.
The only obvious morphological feature that hints at the presence of landslides in this image are the small arcuate scoops out of the ridge, although there are no obvious landslide features on the slopes below. Looking at this area in a true vertical image provides no improvement in understanding:
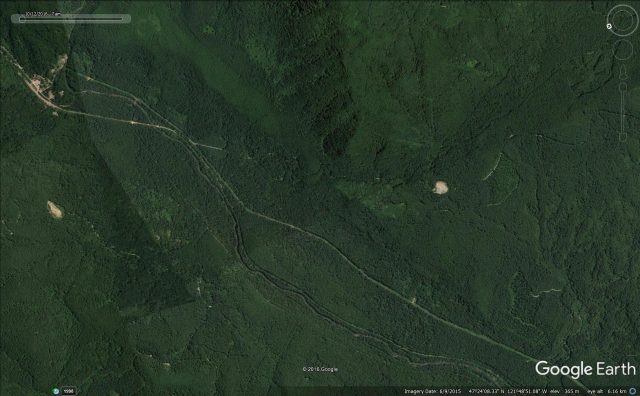
Geeogle Earth image of the Cedar River Valley south of North Bend by Rattlesnake Ledge.
.
But the Lidar image, which is online as part of an article about landslide mapping in Washington State, provides a completely different understanding:
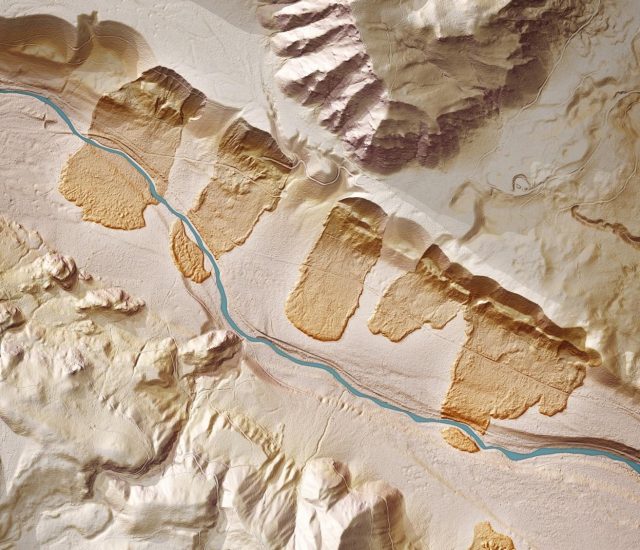
Lidar image showing landslides in the Cedar River Valley south of North Bend by Rattlesnake Ledge. Image by Washington State Department of Natural Resources.
.
Now five major landslides, all long runout flows, are evident. These have taken indeed taken a scoop out of the ridge, and have shown high mobility to flow across the plain below. In three cases the river has then eroded through them. Note the one on the left of the image has even flowed up onto the terrace on the far side of the river.
Others will be able to comment on the origin of these remarkable landslides, but in a seismically-active area my starting point might be an historic earthquake. Understanding the presence of these flowslides transforms any analysis of the risk associated with landslides in this area. Without the Lidar these landslides would probably have been undetected.
2 December 2016
The North Canterbury Landslide Dams website
The North Canterbury Landslide Dams website
The aftermath of the Kaikoura Earthquake last month is increasingly becoming focused on the impact of the very large number (possibly over 80,000) landslides generated by the seismic event. In common with other major earthquakes in mountainous areas, the immediate concern is focused upon valley blocking landslides – also known as landslide dams or quake lakes. A small proportion of these can collapse rapidly, allowing the generation of a major flood / debris flow that can be devastating downstream. Unsurprisingly, the Kaikoura earthquake has generated a large number of landslide dams, although none pose an immediate high level of risk. The potentially more dangerous dams are being monitored by Environment Canterbury and GNS Science. My old friend Sally Dellow is providing much of the technical coordination; I know of no-one better to play this vital role.
Canterbury Maps have now put together a wonderful web resource to provide information about the landslide dams – North Canterbury Landslide Dams – this is exemplary risk communication. The site provides an interactive map of the location of the landslide dams, with the key dams being highlighted in red:
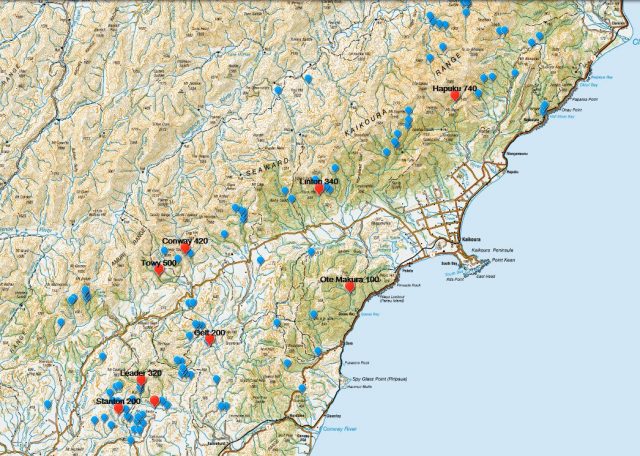
The North Canterbury Landslide Dams map of the major valley blocking landslides after the Kaikoura earthquake
.
The site provides a table of information about the status of the key landslide dams as well, which will be updated as each reconnaissance flight is completed. For example, one of the dams, Linton 340, is described as follows:
Dam remains intact, but face starting to erode. High chance of failure. Could affect some areas around Inland Road.
This is the image of the dam that the site has provided:
The Linton 340 landslide dam as photographed on 18 November 2016. Image via North Canterbury Landslide Dams
.
These landslide dams are being managed in a very measured way. Unfortunately they will present a substantial challenge for some time to come.
30 November 2016
Earthquake induced landslides in the Himalayan mountains – new evidence for earthquake potential in Bhutan
Earthquake induced landslides in the Himalayan mountains – new evidence for earthquake potential in Bhutan
In terms of large earthquakes Bhutan has always been something of a conundrum. The ongoing collision between the Indian and Eurasian plates that has generated the Himalayas occurs along a huge set of faults that run through the frontal range of the mountains and then dip below them. It is this fault that generated the 2015 earthquake in Nepal. Considerable work has been done to understand the palaeoseismology of this fault system, which has yielded a long history of large earthquakes – except for the Bhutan segment. There has been some very slender evidence of an earthquake in the early 18th Century, but nothing very detailed. This has led to speculation that this section of fault might behave differently in some way – perhaps that it undergoes slow slip to release the stress.
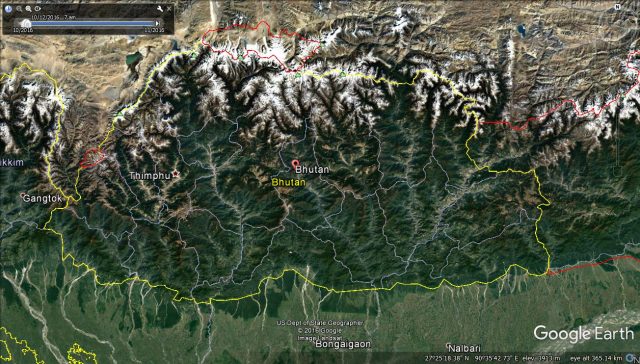
Google Earth image of Bhutan
.
When I was in Bhutan a few years ago I raised the issue of earthquake triggered landslides with a range of people, to be told that there was no problem as Bhutan does not get large earthquakes. I found that this troubling. The country is very landslide prone, and the problem is becoming worse as the country develops. Everything about the landscape suggests that earthquake triggered landslides would be a big problem during a large seismic event, and issue that has been emphasised by the Nepal and New Zealand earthquakes. So understanding whether Bhutan suffers major earthquakes really matters.
I am glad to say that this problem appears to have been resolved at last. In a paper published last month, Hetenyi et al (2016) reported archive and field work, and resultant modeling, that they have undertaken that has unearthed details of a large earthquake, likely to have been approximately M=8.0 (the range is 7.5-8.5), in Bhutan in 1714 AD. The evidence includes a series of documentary accounts of the damage caused by the earthquake, and data from trenches across the fault that provide evidence of the movement. From this information Hetenyi et al (2016) have modeled the earthquake to get an estimate of its likely magnitude.
To me this feels like a really important study. We now know that the entirety of the Himalayan Arc has the potential to generate devastating earthquakes, and thus to suffer earthquake-induced landslides. The implications for hazard management in Bhutan are clear.
Reference
, , , , , , and (2016) Joint approach combining damage and paleoseismology observations constrains the 1714 A.D. Bhutan earthquake at magnitude 8 ± 0.5, Geophysical Research Letters, 43, 10,695–10,702.
28 November 2016
A revised landslide map for the M=7.8 Kaikoura earthquake
A revised landslide map for the M=7.8 Kaikoura earthquake
Valkaniotis Sotiris of the Earthquake Geology Research Group and the Aristotle University of Thessaloniki has posted a revised map of the landslides triggered by the M=7.8 Kaikoura Earthquake in New Zealand on his blog. This map is available as a high resolution download:
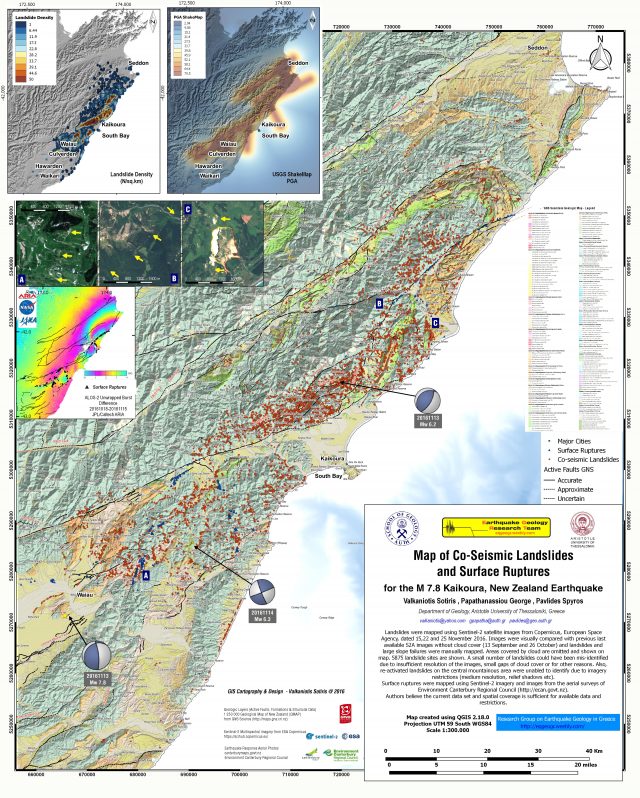
Map of Co-seismic ruptures and landslides from the M=7.8 Kaikoura earthquake in New Zealand
.
To generate this map, which shows 5,875 landslides is a remarkable effort. The maps of the density of landslides is particularly interesting to me:
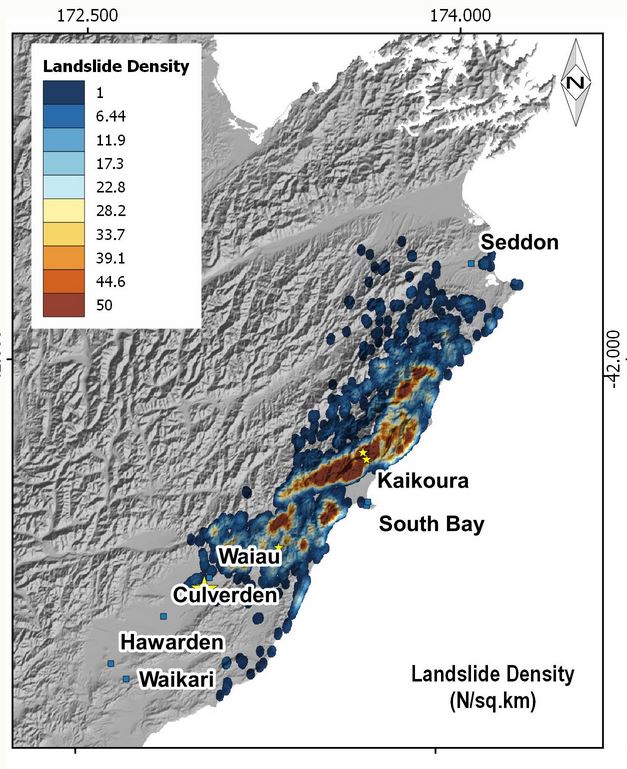
Map of landslide density from the M=7.8 Kaikoura earthquake, via Valkaniotis Sotiris
.
I noted in my earlier post that a reasonable first order estimate of the landslide locations can be obtained from the coincidence of the topography and the aftershock sequence. This is a map of the aftershocks from the earthquake, mapped as a KML by Geonet.
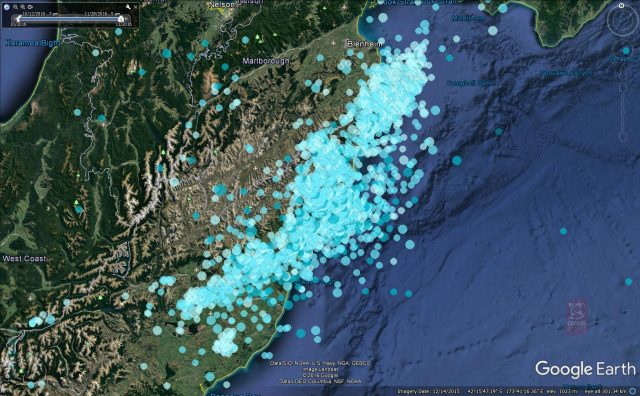
Geonet / GNS data showing the locations of the aftershock sequence triggered by the M=7.8 Kaikoura earthquake, mapped on Google Earth
.
The coincidence between the two is not perfect of course (we would not expect it to be) but the aftershocks are a surprisingly good predictor of the landslide distribution. It would be interesting to know whether the aftershocks are a better predictor than the ShakeMap peak ground acceleration data. The map produced by Valkaniotis Sotiris hints that this might be the case.
Other posts that might be of interest:
- Geonet commentary on landslides triggered by the Kaikoura Earthquake
- Kaikoura earthquake landslides: the picture slowly emerges
- First news of landslides from the Kaikoura Earthquake sequence in New Zealand yesterday
- Hapuku River: a major landslide dam after the earthquake in New Zealand
- Comparing initial landslide reports: Tumbi Quarry, Papua New Guinea and Kaikora, New Zealand
- Landslides from the 2015 Wilberforce earthquake in New Zealand
- UBC distinguished lecture powerpoint file: Earthquake-induced landslides – lessons from Taiwan, Pakistan, China and New Zealand
21 November 2016
Siirt in Turkey: a desperate race to save the lives of miners buried in a landslide (with a video)
Siirt in Turkey: a desperate race to save the lives of miners buried in a landslide
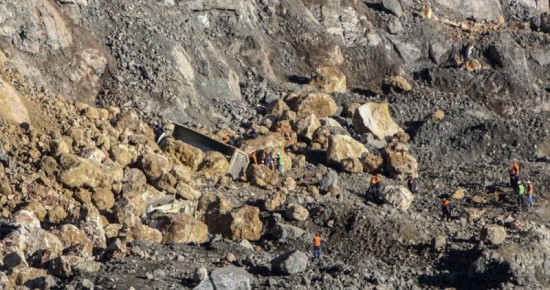
Somewhat lost in the focus on the landslides triggered by the earthquake in New Zealand has been an ongoing landslide tragedy at Siirt in Turkey. Here, a landslide on Thursday at the copper mine at Madenköy buried 16 miners. To date the bodies of six men have been recovered, and operations continue to recover the other ten. The authorities have admitted that their prospects are not promising. Heavy rainfall may have been a factor in the landslide, but to date six people have been arrested under suspicion of negligence, including the field operations manager of the mine and the owner of a subcontracting firm.
Remarkably, it appears that the landslide was captured on video. This recording is on Youtube. The panic and confusion of the person making the recording is clear:
.
There are few images that show provide a decent view of the aftermath of the landslide, allowing a proper indication of the nature of the collapse. This is the best that I can find to date, from the Haber Yerin news site (in Turkish):
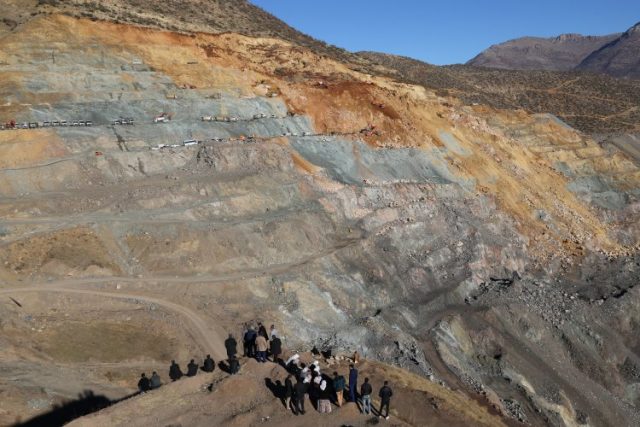
The location of the mining landslide at Siirt, via Haber Yerin
.
Based on this image this appears to be a large, reasonably shallow rockslide in a heavily benched slope. This image shows the debris pile at the foot of the slope, including the heavy equipment that was caught up and buried in the landslide, via Adana Kent:
The heavy equipment caught up in the landslide at the foot of the slope at Siirt, via Adana Kent
.
Unfortunately this is just the latest in a long line of mine related accidents in Turkey (this example remains one of the most remarkable landslides of the last decade), and of course I have highlighted previously the terrible toll that mine related landslides exact in some parts of the world.
20 November 2016
Geonet commentary on landslides triggered by the Kaikoura Earthquake
Geonet commentary on landslides triggered by the Kaikoura Earthquake
Geonet has now posted an initial commentary on the landslides triggered by the Kaikoura earthquake in New Zealand a week ago. I won’t seek to reproduce what they have stated, but the headlines are:
- There are between 80,000 and 100,000 landslides over an area of about 7,000 square kilometres.
- Based on an initial analysis of a new Worldview-2 satellite image there are 12 valley blocking landslides (landslide dams).
Many of these are likely to have breached naturally already, but all need assessment to this end, Geonet state that:
GNS has also started systematically flying landslide affected areas to visually identify landslide dammed lakes. The southeast flank of the Seaward Kaikouras, was flown on the 16th November and seven landslide dams were found. These flights will continue over the next three or four days. The purpose of these flights is to systematically cover affected areas where no data is currently available. The second purpose is to photograph the landslide dams to allow assessment of the hazard at each site.
The have provided a map of some of these landslide dams:
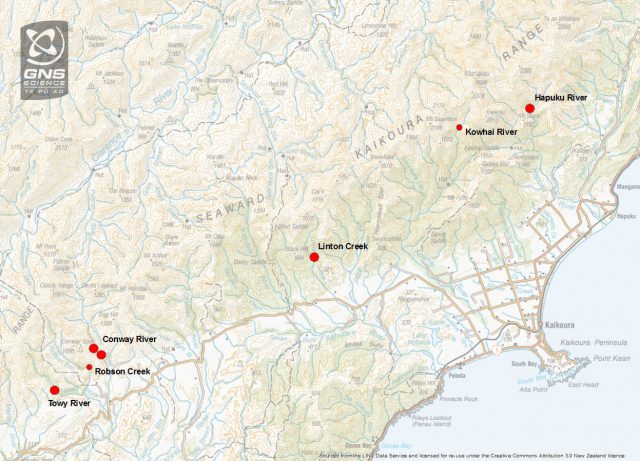
Geonet map of some of the landslide dams following the Kaikoura Earthquake.
.
Meanwhile, Environment Canterbury is now posting a series of videos showing aspects of the damage caused by the earthquake. The Youtube channel can be found here. Some of the landslides are impressive. I particularly recommend the Waipapa Landslide video:
.
This is a very deep seated slump on an unusually large scale:
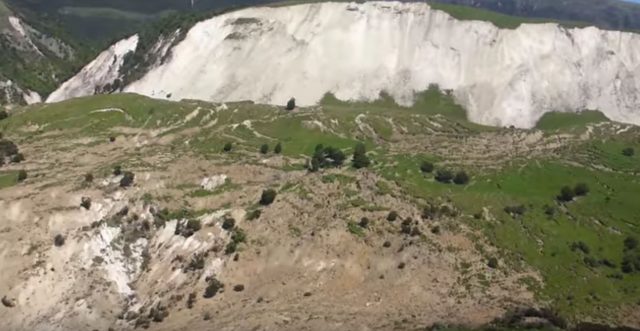
The unusually large large slump at Waipapa, via Environment Canterbury
.
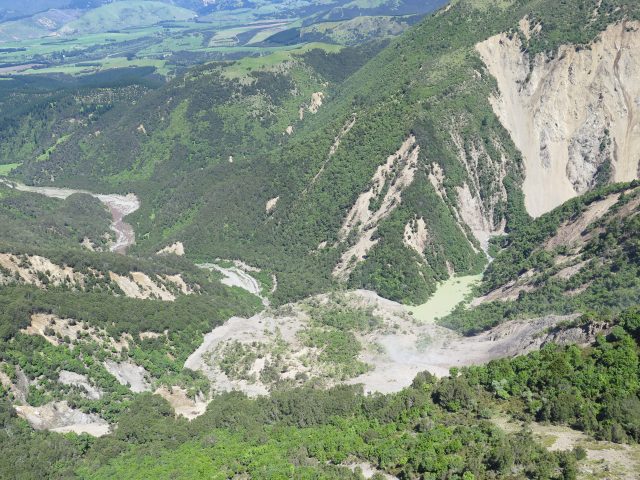
There is also a nice video of a large, complex and quite long runout landslide on the Leader River:
.
Again, this appears to be a deep-seated slump. Interestingly, in both cases the landslides have a very planar rear scarp:
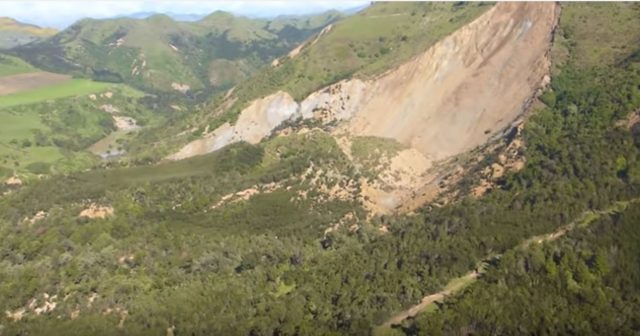
A deep-seated slump on the Leader River, via Environment Canterbury
.
But the finest image is in the Geonet report that I cited above. This is an image of the valley blocking landslide on the Hapaku River:
The Hapaku River landslide, via Geonet
.
As well as the very large scale of this valley blocking landslide, this image shows the vast number of additional landslides triggered by the earthquake. Experience from elsewhere suggests that this number will increase in the first very heavy rainfall event after the earthquake.
17 November 2016
Hapuku River: a major landslide dam after the earthquake in New Zealand
Hapuku River: a major landslide dam after the earthquake in New Zealand
With each passing day the impact of the Kaikoura earthquake becomes more clear. Whilst human losses in this sparsely populated area were low, the major legacy appears to be the landslides, of which there are very many. Resources are becoming available that provide detail, I would highlight the following as being particularly interesting:
- Canterbury Maps have put online a GIS map that provides details of their reconnaissance flights, and a large set of georeferenced photographs of the impacts, mostly landslides.
- The ESA has placed online a Sentinel satellite image that, though cloudy, allows many of the landslides to be seen. The implication from this image is that landsliding is very extensive.
- The Research Group on Engineering Geology in Greece has posted a provisional landslide map, again using the Sentinel image. This is not complete because of the cloud cover, but it starts to give an indication of what an extraordinary event this has been in landslide terms. I think we can now safely say that this is the largest landslide events since the 2008 Wenchuan earthquake in China:
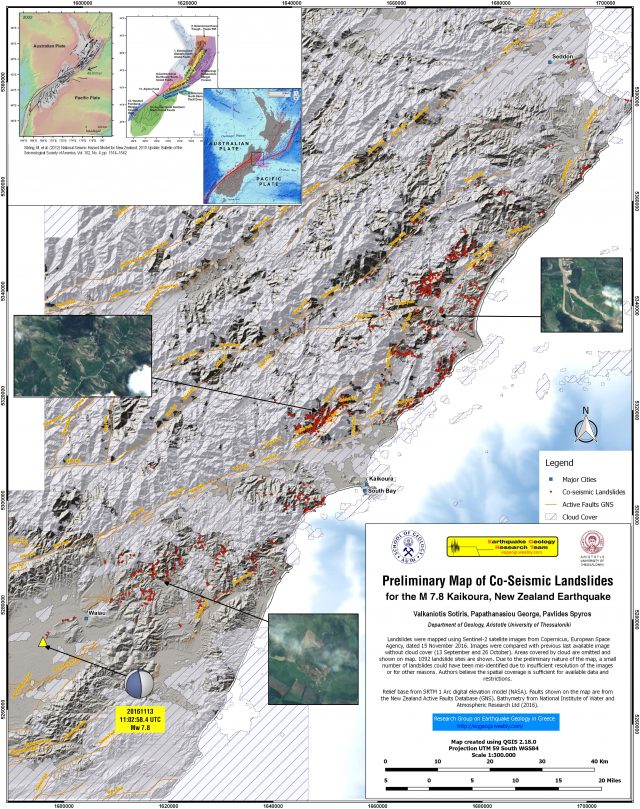
Preliminary Map of Co-Seismic Landslides for the M 7.8 Kaikoura, New Zealand Earthquake, prepared by the Research Group on Earthquake Geology in Greece
.
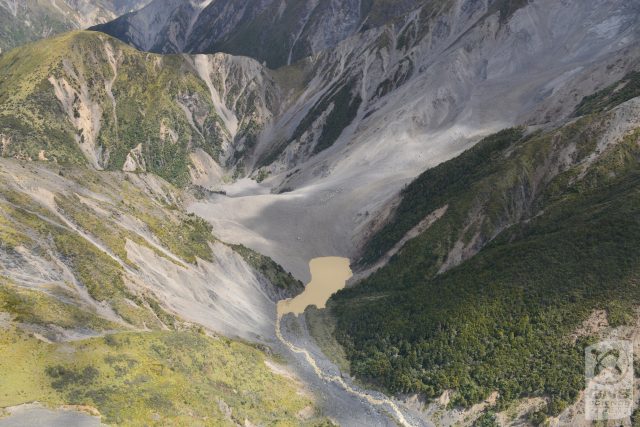
The landslide dam on the Hapuku River
At the moment the site that is causing the greatest concern is a landslide dam on the Hapuku River, which has completely blocked the flow and is about 150 m high. This landslide was witnessed and photographed by a local resident, Neil Protheroe. The Civil Defence has been circulating this photograph of the dam, and has advised those living downstream to relocate.
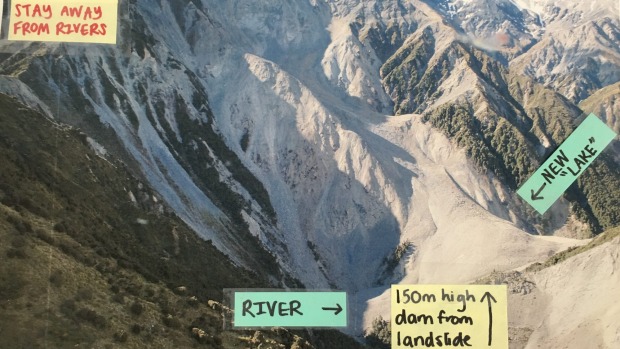
The landslide dam on the Hapuku River as posted by Civil Defence
.
There is a set of images on the Canterbury Government web server that I highlighted above, of which these are two:
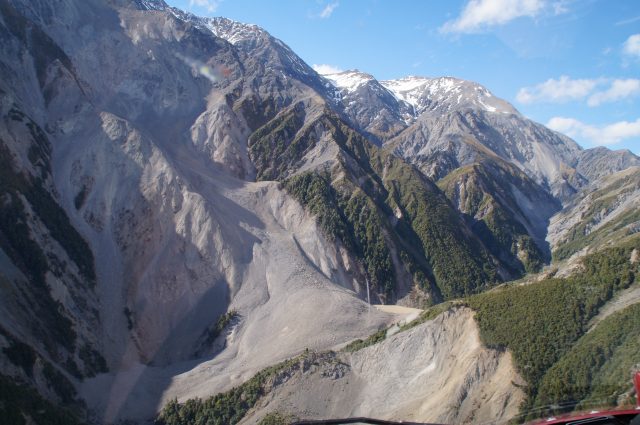
The landslide dam on the Hapuku River, image from Canterbury Maps
.
The landslide dam on the Hapuku River, image from Canterbury Maps
.
The dam appears to be tall, narrow and, at least on the surface, comparatively fine grained. The concern about the threats posed by this river blockage are not misplaced. More detailed analysis is urgently required, and will undoubtedly be underway.
 Dave Petley is the Vice-Chancellor of the University of Hull in the United Kingdom. His blog provides commentary and analysis of landslide events occurring worldwide, including the landslides themselves, latest research, and conferences and meetings.
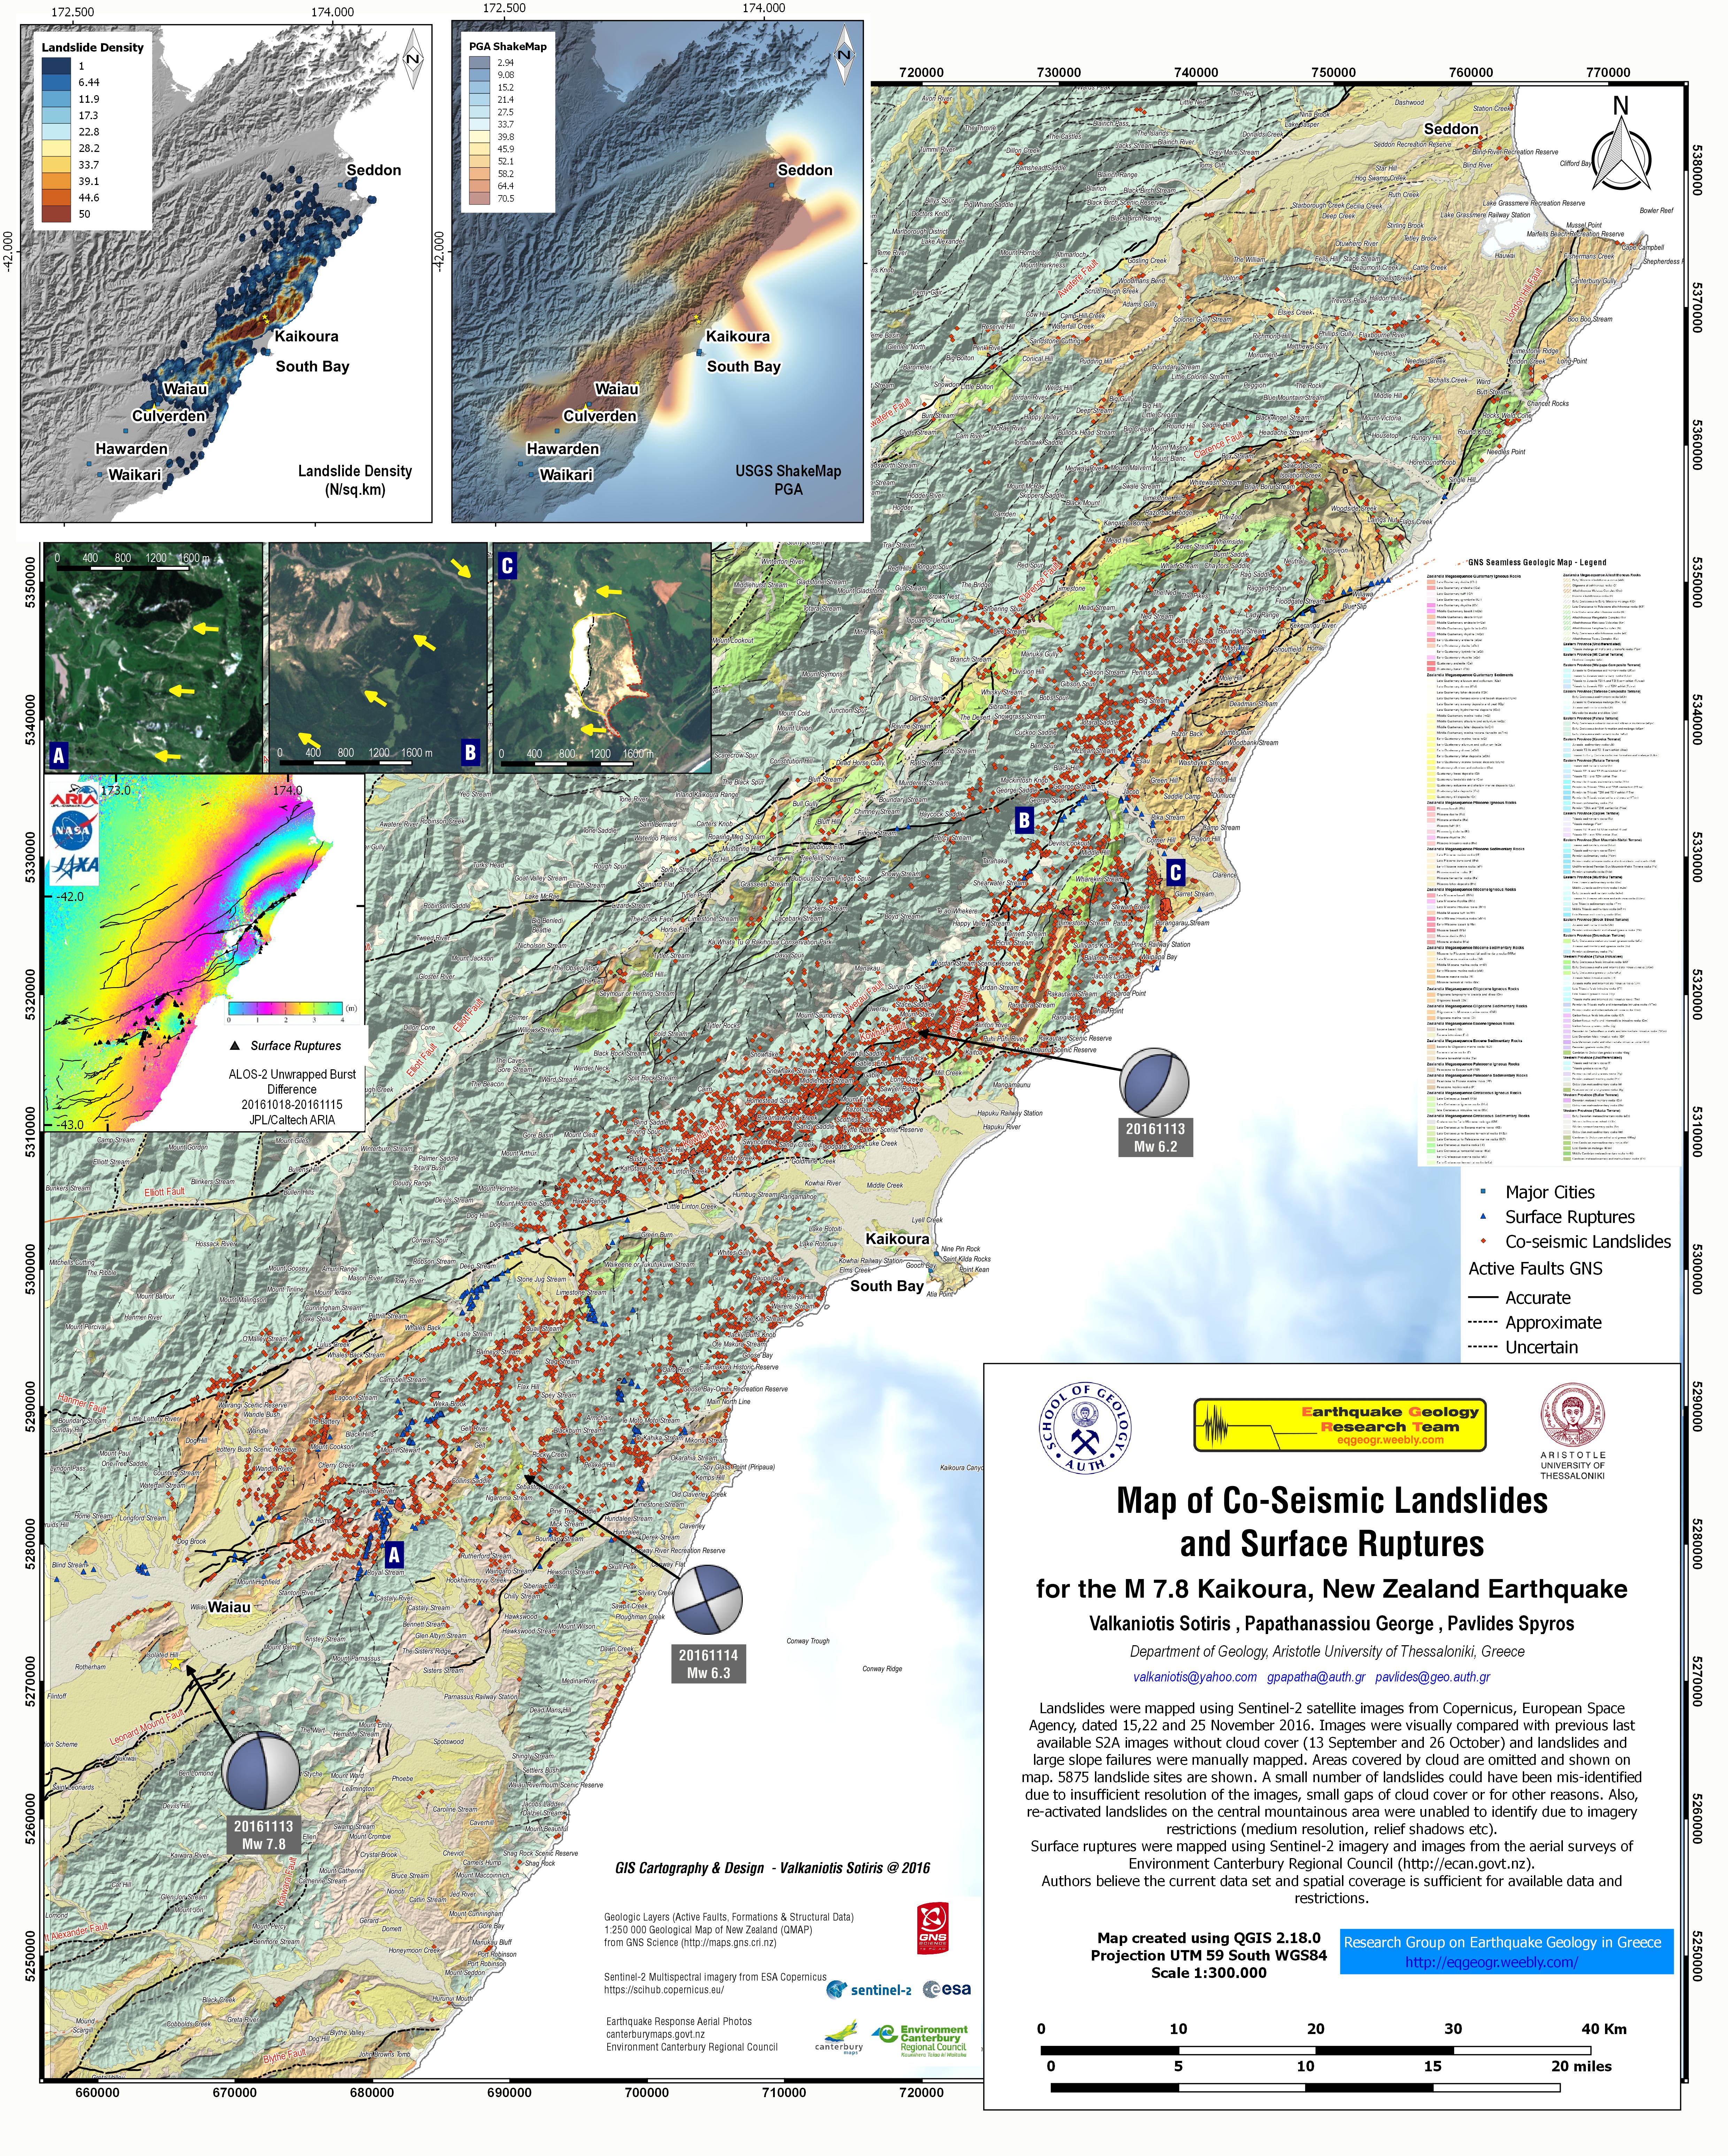
Recent Comments