28 April 2016
Forecasting the time of failure: the Preonzo rockslide
Posted by Dave Petley
Forecasting the time of failure: the Preonzo rockslide
In recent years there has been increasing interest in the development of techniques, and of the understanding that underpins them, to provide early warning of large landslides. One key component of this has been the use of ground movement monitoring, typically using a combination of extensometers and surface movement markers, to detect movements and to infer likely future behaviour. In a paper just published in Landslides (Loew et al. 2016), Simon Loew and his colleagues from ETH have provided details of an unusually detailed – and successful – monitoring campaign for a rockslide in Switzerland. The landslide in question is the Preonzo rockslide, a 210,000 cubic metre rockslope failure that occurred near to the village of Preonzo on 15th May 2012. I featured this landslide at the time, so won’t describe it again here, but the one of the failure events (but neither of the main collapses) was captured in a spectacular video:
.
Movement of this slope was first noted in 1989, with more substantial movements starting in 2006. To protect the population and infrastructure in the valley, a early system was installed in 2010. The landslide itself was anticipated and the roads below were closed. The failure occurred in two phases – an initial rockslope collapse followed, three hours later, by a remobilisation event that generated a rock avalanche (note that the events caught on video were neither of these two main failures). No-one was injured and no infrastructure was damaged.
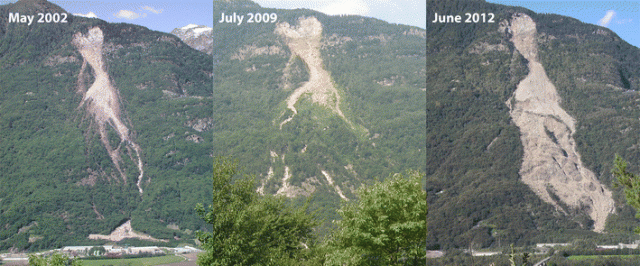
The evolution of the rockslope failure is shown in three images in the paper:

The evolution of the Preonzo rockslide over a ten year period, from Loew et al. (2016)
.
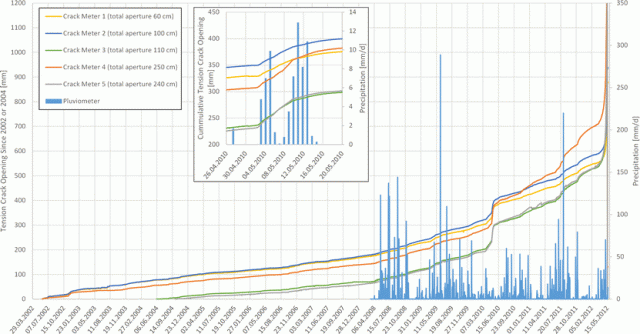
There is much to admire in this paper, but I will focus on just one element, the movement record. The authors present a wide range of fascinating data capturing the evolution of the failure over a 10 year period. One set of data comes from measurements using a robotic total station and prisms on the rockslide, whilst another (shown below) captures the opening of the main tension crack at the rear of the mobile body of rock:

Movement of the Preonzo rockslide from Loew et al (2016), captioned: “Long-term opening displacements of main tension crack at Alpe di Roscioro between May 2002 and May 2012 as derived from five crack meters. Also shown are daily precipitation since 2008 and total apertures normal to opening direction as measured in April 2012”
.
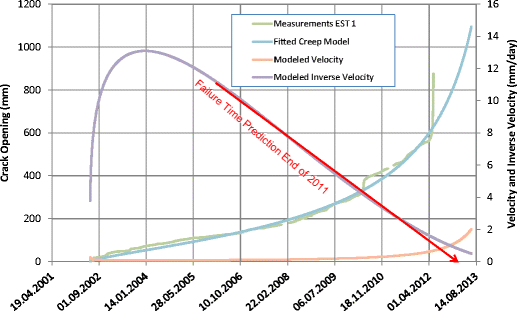
These data are amazing – note the gradual acceleration of the landslide over time, the response of the slide to rainfall events (which create bumps in the displacement plot), and the change in behaviour into rapid movement at the end of the record. It was this change that allowed the impending collapse of the slope to be observed. Loew et al. (2016) note that a distinct change in behaviour occurred in 2006, when the systematic acceleration to failure started. In fact, the authors observe that use of the inverse velocity technique from the data from 2006 onwards provides a forecasted failure in 2012, although this give no more than an approximation:

Forecasting the time of failure of the Preonzo rockslide from Loew et al. (2016), captioned “Measured displacements of crack meter 1, fitted creep curve (Xiao et al. 2009) at the end of 2011, velocity, and inverse velocity calculated from fitted creep curve and example estimation of failure time based on inverse velocity extrapolation, using displacement data until end of 2011”
.
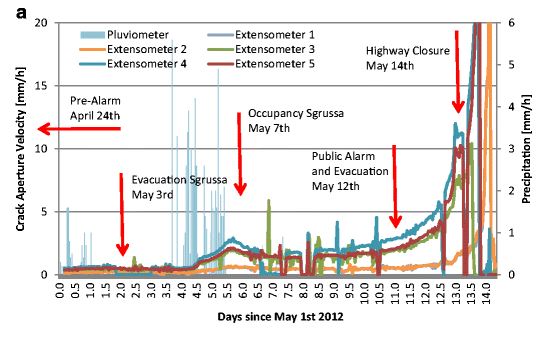
Loew et al. (2016) also look carefully at the data for the final failure event. In this case the progression to failure is clearly evident:

The final failure event of the Preonzo rockslide from Loew et al (2016). Captioned: “Hourly displacement velocities (a) … of all crack meters, hourly rainfall and decisions taken by cantonal officials. Days since May 1, 2012”
.
But note also that the data is very noisy. Failure is a complex process, and forecasting the time of failure is immensely challenging, even with the very best data. I think this paper should be read by anyone planning to use surface monitoring techniques to forecast landslide failure.
Reference
Loew, S., Gschwind, S., Gischig, V., Keller-Signer, A. and Valenti, G. 2016. Monitoring and early warning of the 2012 Preonzo catastrophic rockslope failure. Landslides. Doi: 10.1007/s10346-016-0701-y


 Dave Petley is the Vice-Chancellor of the University of Hull in the United Kingdom. His blog provides commentary and analysis of landslide events occurring worldwide, including the landslides themselves, latest research, and conferences and meetings.
This video has clear imagery and an overview of the region.
http://www.youtube.com/watch?v=s4sOO5MPYV4