6 October 2017
Murchison Glacier: more information about the slowly developing rockslope failure that is affecting the hut
Posted by Dave Petley
Murchison Glacier: more information about the ongoing rockslope failure that is affecting the hut
Earlier this week I posted about the reasoning behind the closure of Murchison Hut, the climbing and skiing refuge located above the Murchison Glacier in Aoraki/Mount Cook National Park in the South Island of New Zealand. To recap, analysis of aerial imagery and satellite images by Dr Pascal Sirguey at the University of Otago and Dr Simon Cox from GNS Science has indicated that the location of the hut has shifted 9 m laterally and 9 m vertically since November 2008, indicating that there is a large-scale rockslope failure occurring beneath the hut. Clearly there is the potential for a major failure event onto Murchison Glacier at some point (without further monitoring this is essentially impossible to predict), such that the hut has had to be closed.
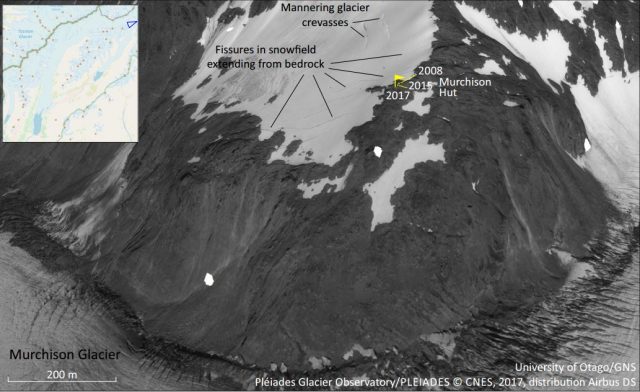
Pascal has very kindly provided some additional images to illustrate the problem, and I post them here with his permission. First, this is a Pleiades high resilution satellite image draped onto a digital terrain model, that shows the location of the hut, the morphology of the slope, and the tension cracks that extend into the snow pack. The scale of the rockslope failure that is developing is clear:-

Pleaides image showing the rockslope failure developing above the Murchison Glacier in New Zealand. Image credit: University of Otago/GNS/Pleiades Glacier Observatory/PLEIADES © CNES, 2017, distribution Airbus DS.
.
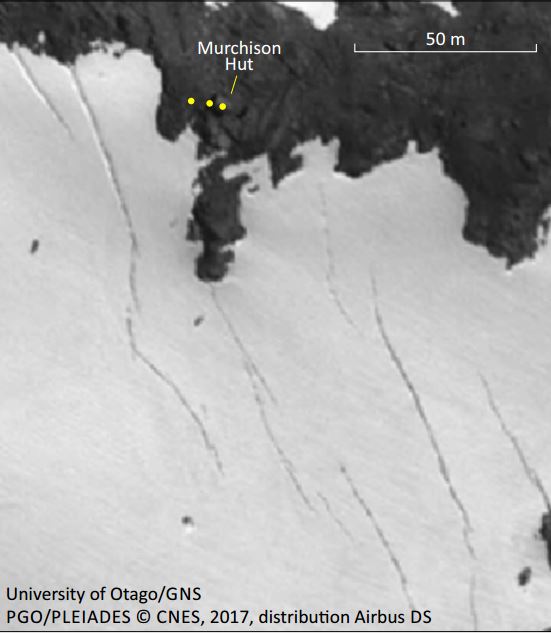
This image shows the tension cracks that have developed in the snow pack, and the change in location of the Murchison Hut as the rockslope undergoes creep:-

Tension cracks and the changed position of the Murchison Hut. Image credit: University of Otago/GNS/Pleiades Glacier Observatory/PLEIADES © CNES, 2017, distribution Airbus DS.
.
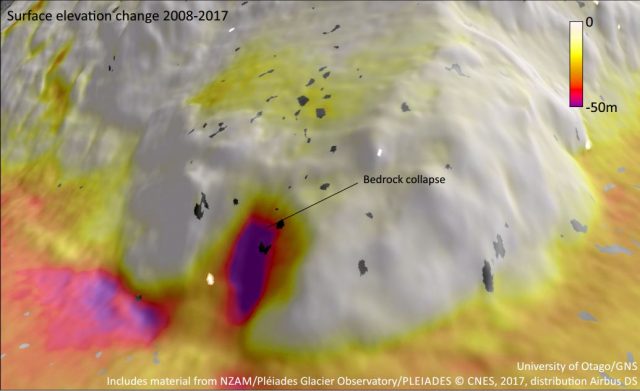
And finally, Pascal has also produced a surface elevation difference model between 2008 and 2017:-

Surface elevation change for the rockslope above Murchison Glacier. Image credit: University of Otago/GNS/Pleiades Glacier Observatory/PLEIADES © CNES, 2017, distribution Airbus DS.
.
This appears to be a site in which INSAR could very usefully provide insight into the patterns of movement, and any change in rates of creep. Anticipating what will happen next is very hard without this level of analysis; the slope could collapse today or it might still be standing in two decades.
Acknowledgement
Thanks to Pascal Sirguey at the University of Otago and Simon Cox from GNS Science for their help in putting this post together.


 Dave Petley is the Vice-Chancellor of the University of Hull in the United Kingdom. His blog provides commentary and analysis of landslide events occurring worldwide, including the landslides themselves, latest research, and conferences and meetings.
rather clearly illustrates how little we know about the actual behaviour of rock masses. We don’t really know how strain is partitioned and post peak behaviour is unclear. Has a slip surface actually formed? The evolution of this would be really interesting to know what is actually happening in the rock mass. Its probably easy enough to get a handle on the state of stress so anything else would have to be due changes in rock mass strength?
[I agree 100%. I would assume that the shear surface is forming but is not complete at this stage – measurement of strain across the slope with time would provide insight. INSAR or laser monitoring with prism reflectors would provide insight, but would be a major project. There is an excellent research opportunity here. D.].
In the top photo, note the main former landslide. Progression is developing for the next landslide. Note the development of ridges and ‘valleys’ on the slope to the right of this top photo. For the photo showing the some 10 tension cracks, I recommend labelling for Geology and Eng Geology, the tension cracks as t1, t2, t3 . . . going from the potential scarp up the mountain. Each tension crack has dimensions l1, w1 and d1.
t = tension, l = length of the tension crack, w = width and d = depth.