24 May 2011
New landslide susceptibility map for California
Posted by Dave Petley
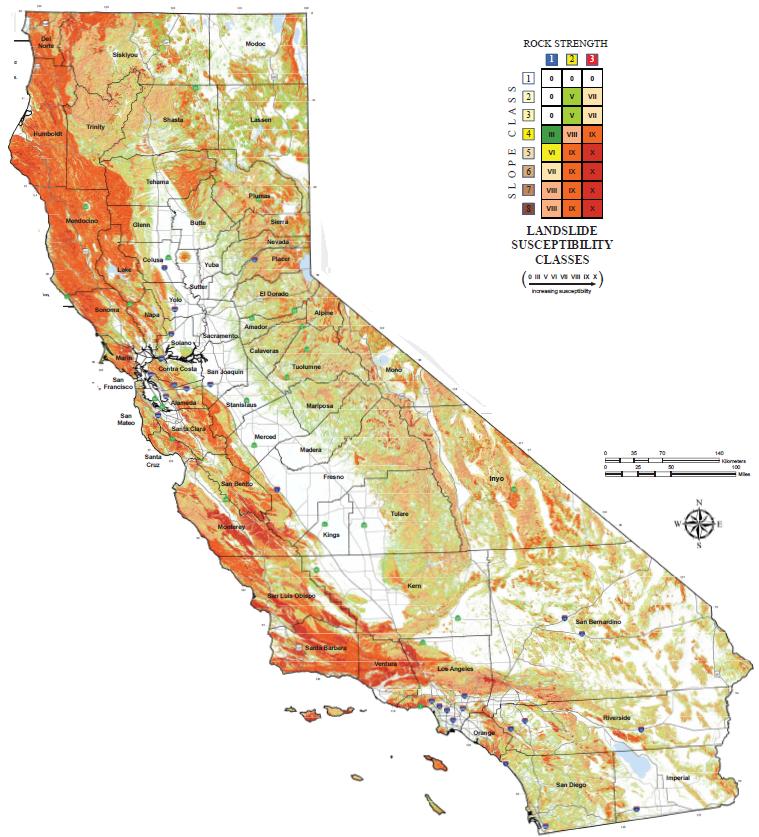
The Californian Geological Survey has just released a new map showing the susceptibility to deep-seated landslides across the whole of the state. The map is based upon an inventory of known landslides in conjunction with data regarding lithology and slope angle:
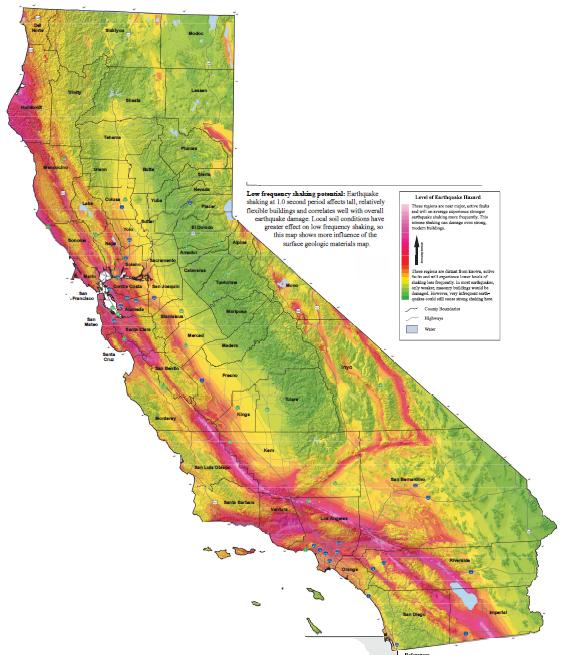
This is a susceptibility map, not a hazard map. In other words, it does not take into consideration the occurrence of triggers of the potential landslides, which of course in this area are both intense rainfall and earthquakes. However, of interest is the additional map that has been provided of the distribution of earthquake shaking potential, which is this map (taken from here):
Two things jump out regarding the landslide susceptibility map. The first is just how high the susceptibility is across large parts of western California. I suspect that most people don’t really consider California to have a substantial landslide problem; the opposite is the case of course. The second is the similarity between the shaking potential map and the landslide susceptibility map, which serves to illustrate the key role that tectonic processes play in generating landslide-prone terrain through, for example, uplift and rock fracture. It is also interesting to note the very high landslide susceptibility for Ventura County, on the coast to the northwest of the city of Los Angeles. This was of course the location of the infamous landslides at La Conchita. Of course, the map doesn’t consider the susceptibility to shallow landslides such as debris flows, and nor does it really deal with the increased landslide susceptibility in coastal areas. That is not to devalue the map, which is an impressive tool. The authorities in Malaysia, where the soul-searching about the weekend landslide that killed 16 people continues, would do well to examine the pro-active, transparent disaster management practices of California. And finally, it is also interesting to note that there is increasing concern across the western United States about the potential for floods and landslides as the very deep snowpack melts this year.


 Dave Petley is the Vice-Chancellor of the University of Hull in the United Kingdom. His blog provides commentary and analysis of landslide events occurring worldwide, including the landslides themselves, latest research, and conferences and meetings.
Canada or California?
I think the thing is ridiculous. As a seemingly orange area resident, I can’t actually get a map of a scale that allows me to see how orange I am. In other words, the scale of the map is interesting for the patterns, but, in the words of the authors
I can’t actually see the threat at any site. How can I have faith in the map then?
The CGS has many more maps about landslide hazards. Depending where you live, your county or city may, also. For greater detail, you’d need to consult a geotechnical engineer or an engineering geologist.
This is very interesting. It’s good to know if you are living in a susceptible area.