
August 17, 2019
Alpine Glaciers-BAMS State of Climate 2018
Posted by Mauri Pelto
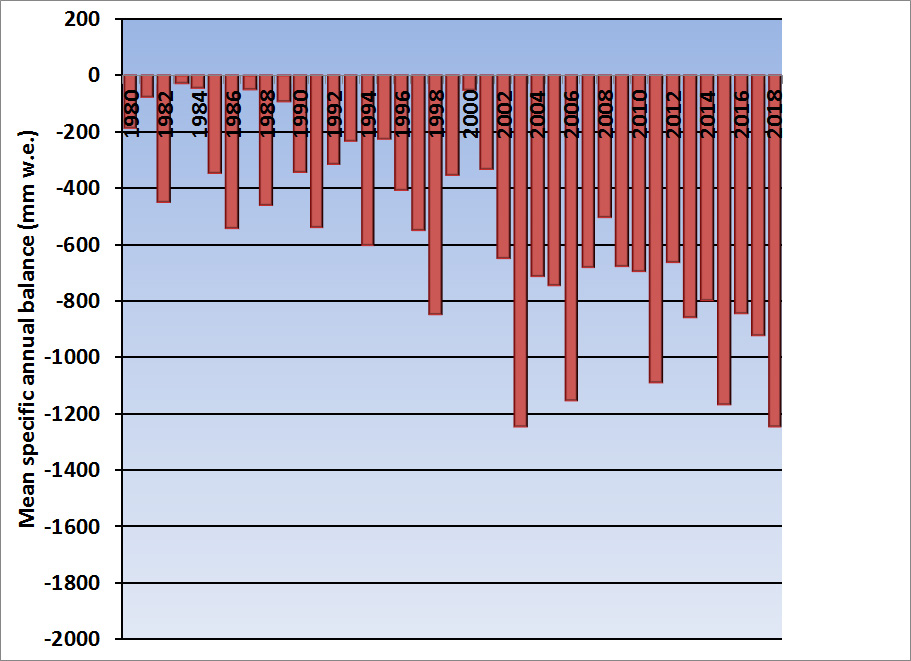
Figure 1. Global Alpine glacier annual mass balance record of reference glaciers submitted to the World Glacier Monitoring Service, with a minimum of 30 reporting glaciers.
For the last decade I have written the section on Alpine Glaciers for the BAMS State of the Climate report, the 2018 report was published this week, below is the section on alpine glaciers. The key data resources is the World Glacier Monitoring Service (WGMS) record of mass balance and terminus behavior (WGMS, 2017), which provides a global index for alpine glacier behavior. Glacier mass balance is the difference between accumulation and ablation, reported here in mm of water equivalence (mm). Mean annual regionalized glacier mass balance in 2017 was -921 mm for the 42 long term reference glaciers , with an overall mean of -951 mm for all 142 monitored glaciers. Preliminary data reported from reference glaciers to the WGMS in 2018 from Argentina, Austria, China, France, Italy, Kazakhstan, Kyrgyzstan, Nepal, Norway, Russia, Sweden, Switzerland and United States indicate that 2018 will be the 30th consecutive year of significant negative annual balance (.-200mm); with a mean balance of -1247 mm for the 25 reporting reference glaciers, with one glacier reporting a positive mass balance (WGMS, 2018). This rate of mass loss may result in 2018 exceeding 2003 (-1246 mm) as the year of maximum observed loss. as a mean. This WGMS mass balance record has now been regionally averaged before determining the global mean, this has not been done yet for 2018, which will reduce the magnitude of the negative balance.
Ongoing global glacier retreat is currently affecting human society by increasing the rate of sea-level rise, changing seasonal stream runoff, and increasing geo-hazard potential (Huss et al, 2017). The recent mass losses 1991-2010 are due to anthropogenic forcing (Marzeion et al. 2014).
The cumulative mass balance from 1980-2018 is -21.7 m, the equivalent of cutting a 24 m thick slice off the top of the average glacier (Figure 1). The trend is remarkably consistent across regions (WGMS, 2017). WGMS mass balance from 42 reference glaciers, which have a minimum 30 years of record, is not appreciably different from that of all glaciers at -21.5 m. Marzeion et al (2017) compared WGMS direct observations of mass balance to remote sensing mass balance calculations, and climate driven mass balance model results and found that each method yields reconcilable estimates relative to each other and fall within their respective uncertainty margins. The decadal mean annual mass balance was -228 mm in the 1980’s, -443 mm in the 1990’s, –676 mm for 2000’s and – 921 mm for 2010-2018. Glacier retreat reflects sustained negative mass balances over the last 30 years (Zemp et al., 2015). The increasing rate of glacier mass loss during a period of retreat indicates alpine glaciers are not approaching equilibrium and retreat will continue to be the dominant terminus response (Pelto, 2018).
Exceptional glacier melt was noted across the European Alps, leading to high snowlines and contributing to large negative mass balance of glaciers. In the European Alps, annual mass balance has been reported from 17 glaciers in Austria, France, Italy and Switzerland. All 17 had negative annual balances, with 15 exceeding -1000 mm with a mean of -1640 mm. This continues the pattern of substantial negative balances in the Alps, which will equate to further terminus retreat. Of 81 observed glaciers in 2017 in Switzerland, 80 retreated, and 1 was stable (Huss et al, 2018). In 2017, 83 glaciers were observed in Austria,; 82 retreated, and 1 was stable. Mean terminus retreat was 25 m, the highest observed since 1960, when mean length change reporting began (Lieb and Kellerer-Pirklbauer, 2018).
In Norway and Sweden, mass balance surveys with completed results are available for eight glaciers; all had negative mass balances with an average loss of -1420 mm w.e. All 25 glaciers with terminus observations during the 2007-2017 period have retreated (Kjøllmoen et al, 2018).
In western North America data has been submitted from 11 glaciers in Alaska and Washington in the United States. All eleven glaciers reported negative mass balances with a mean loss of -870 mm. The longest mass balance record in North America is from Taku Glacier in Alaska. In 2018 the glacier had its most negative mass balance since the beginning of the record in 1946 and the highest end of summer snowline elevation at 1400 m. The North Cascade Range, Washington from 2014-2018 had the most negative five-year period for the region of the 1980-2018 WGMS record.
In the High Mountains of Asia (HMA) data was reported from ten glaciers including from China, Kazakhstan, Kyrgyzstan and Nepal. Nine of the ten had negative balances with a mean of -710 mm. This is a continuation of regional mass loss that has driven thinning and a slowdown in glacier movement in 9 of 11 regions in HMA from 2000-2017 (Dehecq et al 2018).
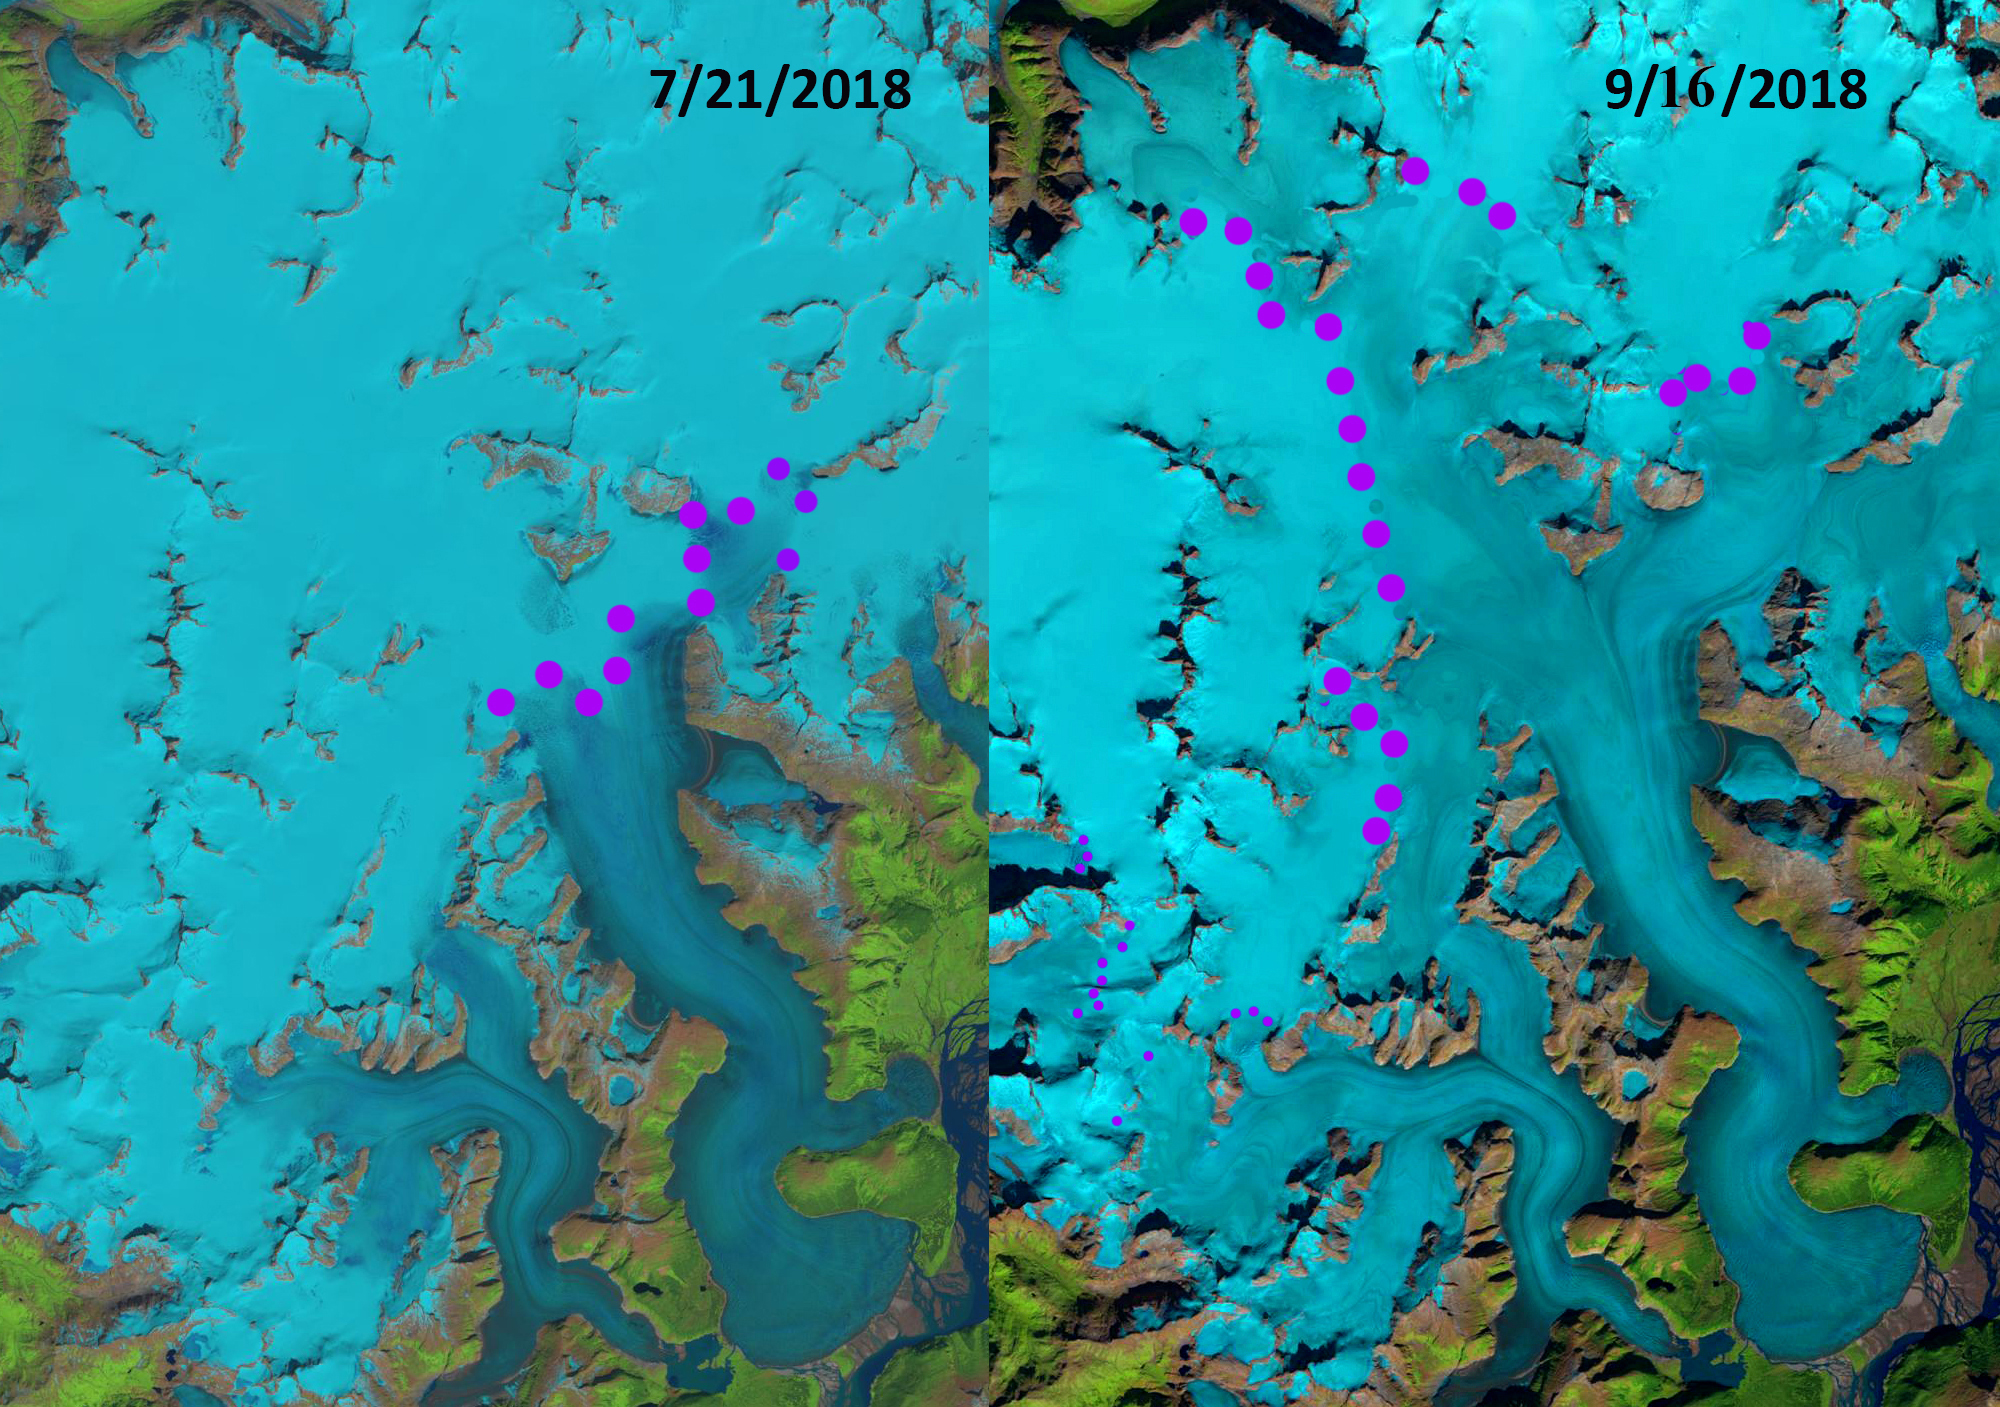
Figure 2. Taku Glacier transient snowline in Landsat 8 images from July 21, 2018 and September 16, 2018. The July 21 snowline is at 975 m and the September 16 snowline is at 1400 m. The average end of summer snowline from is m with the 2018 snowline being the highest observed since observations began in 1946.
References
Huss, M., B. Bookhagen, C. Huggel, D. Jacobsen, R. Bradley, J. Clague, M. Vuille, W. Buytaert, D. Cayan, G. Greenwood, B. Mark, A. Milner, R. Weingartner and M. Winder, 2017a: Toward mountains without permanent snow and ice. Earth’s Future, 5: 418–435. doi:10.1002/2016EF000514
Huss, M., A. Bauder, C. Marty and J. Nötzli, 2018: Neige, glace et pergélisol 2016/17. Les Alpes, 94(8), 40-45. (http://swiss-glaciers.glaciology.ethz.ch/downloadPubs/alpen_15-16_f.pdf).
Dehecq, A., N. Gorumelon, A. Gardner, F. Brun, D. Goldberg, P. Nienow, E. Berthier, C. Vincent, P. Wagnon, and E. Trouve, 2019: Twenty-first century glacier slowdown driven by mass loss in High Mountain Asia. Nature Geoscience 12, 22–27.
Kjøllmoen B., L. Andreassen, H. Elvehøy, and M. Jackson, 2018: Glaciological investigations in Norway in 2017. NVE Report 82 2018.
Lieb, G.K. and A. Kellerer-Pirklbauer ,2018: Gletscherbericht 2016/17 Sammelbericht über die Gletschermessungen des Österreichischen Alpenvereins im Jahre 2017. Letzter Bericht: Bergauf 2/2017, Jg. 72 (142), S. 18–25. (http://www.alpenverein.at/).
Marzeion, B., J. Cogley, K. Richter and D. Parkes, 2014: Attribution of global glacier mass loss to anthropogenic and natural causes. Science, 345(6199), 919–921, doi: 10.1126/science.1254702)
Marzeion, B., Champollion, N., Haeberli, W. et al.: Observation-Based Estimates of Global Glacier Mass Change and Its Contribution to Sea-Level Change. Survey of Geophys, 38: 105, doi: 10.1007/s10712-016-9394-y.
Pelto, M., 2018: How Unusual Was 2015 in the 1984–2015 Period of the North Cascade Glacier Annual Mass Balance? Water 10, 543, doi: 10.3390/w10050543.
WGMS 2017: Global Glacier Change Bulletin No. 2(2017). Zemp, M., and others(eds.), ICSU(WDS)/IUGG(IACS)/UNEP/UNESCO/WMO, World Glacier Monitoring Service, Zurich, Switzerland, 244 pp.: doi:10.5904/wgms-fog-2017-10.
WGMS 2018: Fluctuations of Glaciers Database. World Glacier Monitoring Service, Zurich, Switzerland. doi: 10.5904/wgms-fog-2018-11. http://dx.doi.org/10.5904/wgms-fog-2018-11
Zemp and others 2015: Historically unprecedented global glacier decline in the early 21st century. J. Glaciology, 61(228), 745-763, doi: 10.3189/2015JoG15J017.
 Dean of Academic Affairs at Nichols College and Professor of Environmental Science at Nichols College in Massachusetts since 1989. Glaciologist directing the North Cascade Glacier Climate Project since 1984. This project monitors the mass balance and behavior of more glaciers than any other in North America.