
June 14, 2019
Varied Snowcover Extent Diagnostic of Glacier NP Glacier Climate Response
Posted by Mauri Pelto

Snowcover extent in Landsat images from August, 1998 and 2018. S=Sperry, H=Harrison, J=Jackson, B=Blackfoot and P=Pumpelly
Five of the eight largest glaciers in Glacier National Park are clustered in a small area: Jackson Glacier, Sperry Glacier, Pumpelly Glacier, Harrison Glacier, and Blackfoot Glacier. The USGS in Glacier National Park has over the last 15 years maintained an extensive glacier monitoring program led by Dan Fagre. This program has led to consistent mass balance observations on Sperry Glacier, and repeat mapping of the 37 named glaciers, 25 of which still qualify as glaciers. The repeat mapping indicates the area lost from 1966 to 2015, (USGS, 2017). There is considerable variation between glaciers , some have lost more than 80% of their area and others having lost less than 20% during this 50 year period. Snowcover extent in late summer is a good indicator of glacier mass balance, which controls changes in glacier volume/glacier area. Glaciers that lack a persistent accumulation zone cannot survive current conditions (Pelto, 2010). Observations of the snowcover extent in years of limited snowpack illustrate which glaciers do have a persistent snowcover and can survive vs those that cannot (Pelto, 2011). Here we examine Landsat imagery from mid to late August in 1998, 2005, 2015 and 2018, all years of extensive mass loss to identify the difference in snowcover extent, which will drive mass balance loss and subsequent retreat. These images are not at the minimum snowcover extent, which usually occurs n September. For a glacier to be in equilibrium it needs more than 50% of its area to be snowcovered at the end of the melt season.
In 1998 glacier mass balance losses were significant in the region, in mid-August the accumulation area (snowcovered area) on Harrison Glacier exceeded 80%, Blackfoot Glacier was ~60 % snowcovered, Jackson Glacier ~50% snowcovered and Sperry Glacier ~30% snowcovered. In 2005 another year of minimum mass balance in the region in late August, Harrison Glacier had ~80% snowcover, Blackfoot Glacier~60% snowcover, Jackson Glacier ~40% snowcover and Sperry Glacier ~20% snowcover. In 2015 glacier volume losses in the region were again large, with Sperry Glacier having a loss of -1.22 m. The retained area of accumulation on Harrison Glacier in mid-August of 2015 was ~60%, on Blackfoot Glacier 50%, on Jackson Glacier 30-40% and on Sperry Glacier less than 20%. In mid-August of 2018 snowcover extent was greater than 75% on Blackfoot, Harrison and Jackson Glacier, while Sperry Glacier had ~40%.
The USGS identified the area of Blackfoot Glacier in 2015 as 1.5 km2, a reduction of 18% from 1966-2015 and 8% from 1998-2015 (USGS, 2017). Harrison Glacier had an area of 1.7 km2, losing 17% of its area from 1966-2015, and 10% from 1998-2015. Jackson Glacier had an area of 0.8 km2, losing 40% of its area from 1966-2015, and 6% from 1998-2015. Sperry Glacier had an area of 0.8 km2 in 2015 having lost 40% of its area from 1966-2015, and 16% from 1998-2015. The persistent pattern of limited snowcover extent on Sperry Glacier indicates why the percentage of area loss has been greater than on the other glaciers. The lack of significant retained snowcover indicates Sperry Glacier cannot survive current climate. The retention of significant snowcover on Blackfoot and Harrison Glacier even in low snowpack years indicate these glaciers, unlike most in the National Park, can survive the current climate. The Jackson Glacier is in between these two scenarios.
Jackson is the lowest elevation glacier and Harrison is the highest. Blackfoot, Jackson and Sperry are all north facing. Pumpelly which faces south has lost the least area of the five glaciers from 1998-2015. This underscores the utility of Landsat imagery in assessing glacier mass balance response. Three of the glaciers that retain significant snowcover indicates these glaciers are not as vulnerable to warming and will continue to persist until 2050 at least.
| Observation Year | LIA | 1966 | 1998 | 2005 | 2015 |
| Jackson | 3.1 | 1.3 | 0.8 | 0.8 | 0.8 |
| Harrison | 3.5 | 2.1 | 1.8 | 1.7 | 1.7 |
| Blackfoot | 5.0 | 1.8 | 1.6 | 1.6 | 1.5 |
| Sperry | 3.8 | 1.3 | 1.0 | 0.9 | 0.8 |
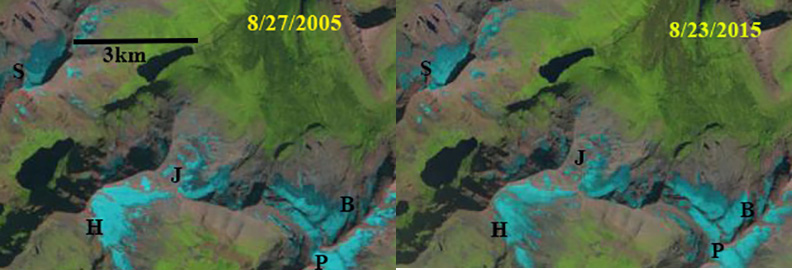
Snow cover extent in Landsat images from August, 2005 and 2015. S=Sperry, H=Harrison, J=Jackson, B=Blackfoot and P=Pumpelly
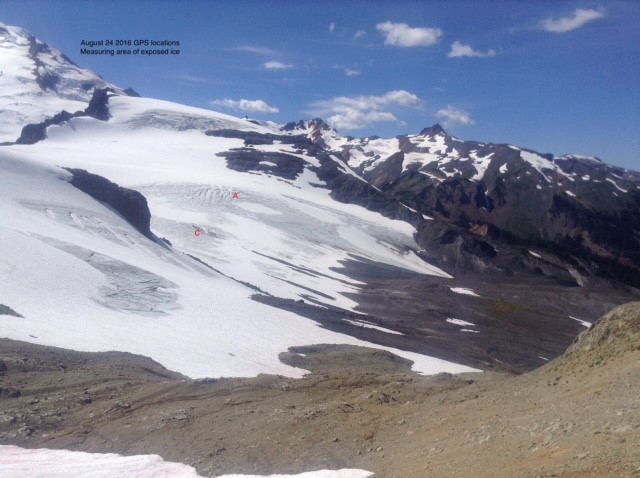
Sholes Glacier August, 24 2016 with the snowcover extent vs the exposed glacier ice.
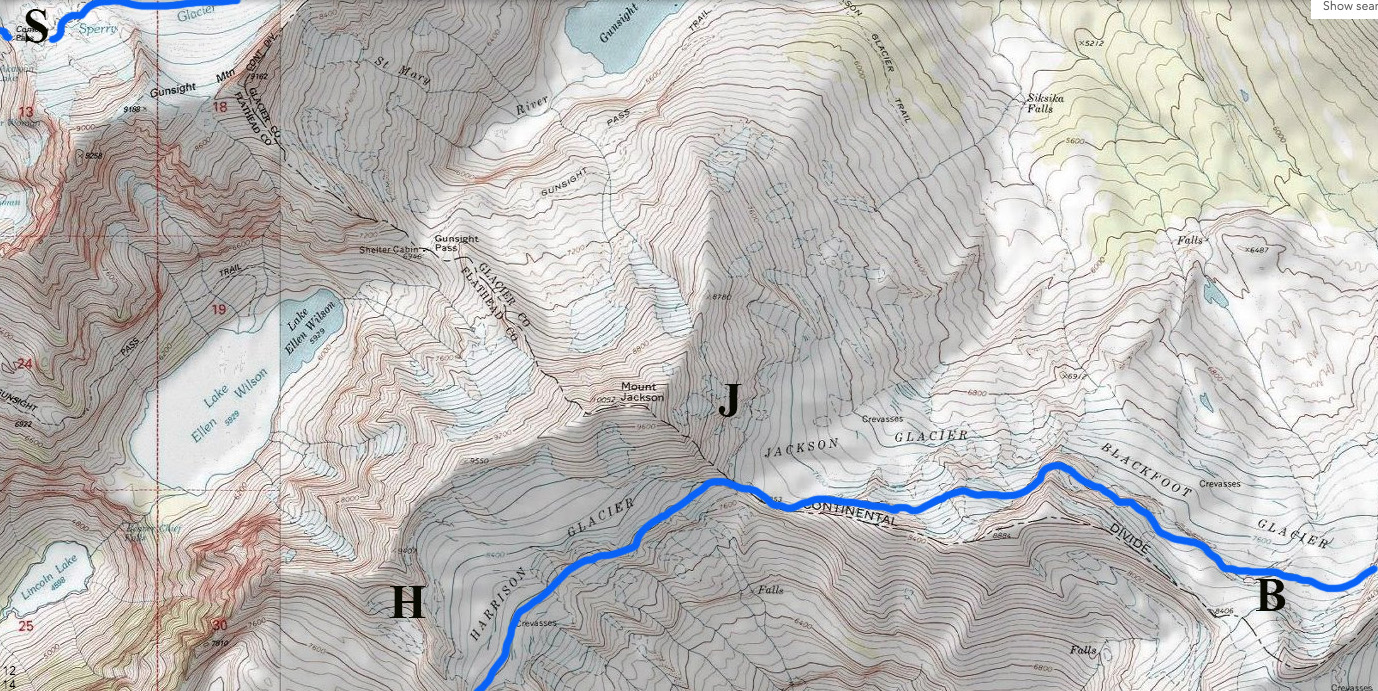
USGS Topo Map of the area with the blue line indicating the 8000 foot contour.
 Dean of Academic Affairs at Nichols College and Professor of Environmental Science at Nichols College in Massachusetts since 1989. Glaciologist directing the North Cascade Glacier Climate Project since 1984. This project monitors the mass balance and behavior of more glaciers than any other in North America.