
January 9, 2019
Drogpa Nagtsang Glacier, China Mass Balance Loss, Separation, Slow Down
Posted by Mauri Pelto

Drogpa Nagtsang Glacier change in Landsat image from 1989 and 2018. Yellow arrow indicates 2018 terminus location, red arrow 1989 terminus location, red dot the lowest elevation of clean glacier ice. Points A-E are the same locations for comparison.
Drogpa Nagtsang Glacier, China is a glacier that is 30 km west of Mount Everest that terminates in an expanding proglacial lake. The glacier begins on the Nepal border at 6400 m, and its meltwater enters the Tamakoshi River. The Upper Tamakoshi Hydropower project is a 456 MW peaking run of river is a hydropower project on the Tamakoshi that is to be finished in 2019. King et al (2017) observed the mass balance of 32 glaciers in the Mount Everest area including Drogpa Nagtsang and found a mean mass balance of all glaciers was −0.52 m water equivalent/year, increasing to -0.7 m/year for lake terminating glaciers. Dehecq et al (2018) in an exceptional paper examined velocity changes across High Mountain Asia from the 2000-2017 period identifying a widespread slow down in the region. The key take away is the same we see for alpine glaciers around the globe, warming temperatures lead to mass balance losses, which leads to velocity slow down, Mass balance is the key driver in glacier response, a sustained negative mass balance leads to thinning, which leads to a glacier velocity declines whether the glacier is in the Himalaya, Alps or Andes. This study simply could not have been completed without the availability and affordability of Landsat imagery. Here we look at one example in the region that highlights the important findings.
In 1989 Drogpa Nagtsang Glacier had a substantial number of coalescing supraglacial ponds on its relatively flat stagnant debris covered terminus. At Point A the former tributary is are no longer contributing to the main glacier, while at B, C, D and E there is a still a contribution. The snowline in 1989 is at ~5450 m. The clean glacier ice extends almost to the tributary glacier at Point B at 5200 m, red dot. In 1992 the supraglacial ponds have further expanded, but a true proglacial lake has not formed. The snowline is at~5500 m. Quincey et al (2009) observed flow of less than 10 m/a in lower 5 km of glacier in 1996 and peaking at 20-30 m/a 8 km from terminus. By 2015 a 2.7 km long lake has developed. The clean glacier ice now extends just past Point E at 5350 m. The snowline is at 5600 m. The tributaries at Point B, C and E no longer reach the main glacier. At Point D the medial moraines indicate that flow from this tributary has been reduced and now is a smaller contributor to the valley tongue. In 2018 the clean glacier ice extends to just 5400 m. The lake has expanded to a length of 2.9 km indicating a retreat of the same distance from 1989-2018. The snowline is exceptionally high at 5700 m. The former tributaries at B, C and E have also markedly retreated away from the main glacier. Only the tributary at Point D is still contributing to the main glacier. The high snowline observed in recent years are an indication that mass balance losses are even larger in this region, which causes further thinning, reduction in velocity, retreat and expansion of debris cover. King et al (2018) observed the thinning and velocity profile on Drogpa Nagtsang and noted the velocity decreased over time and was stagnant in the debris covered zone, thinning occurred along the entire profile, which began close to the ELA. The stagnant nature of the terminus tongue is evident in the Digital Globe image below from 2017. The red arrows show a deeply incised supraglacial stream that is over 2 km long, that would only develop on stagnant ice. This process has played out on other nearby glaciers such as Yanong Glacier and Lumding Glacier. The high snowlines have also been observed at the nearby Nup La on Ngozumpa Glacier in recent years and on many glaciers in the Mount Everest region in recent winters such as in 2018. This indicates continuing mass losses through a greater period of the year.
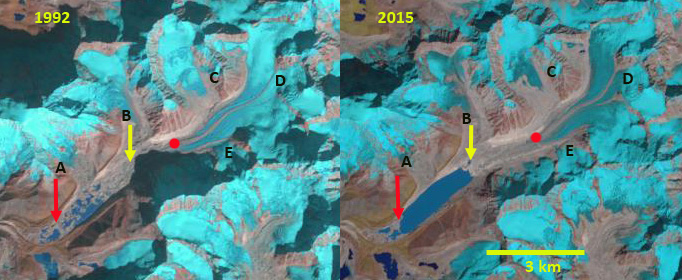
Drogpa Nagtsang Glacier change in Landsat image from 1992 and 2015. Yellow arrow indicates 2018 terminus location, red arrow 1989 terminus location, red dot the lowest elevation of clean glacier ice. Points A-E are the same locations for comparison.
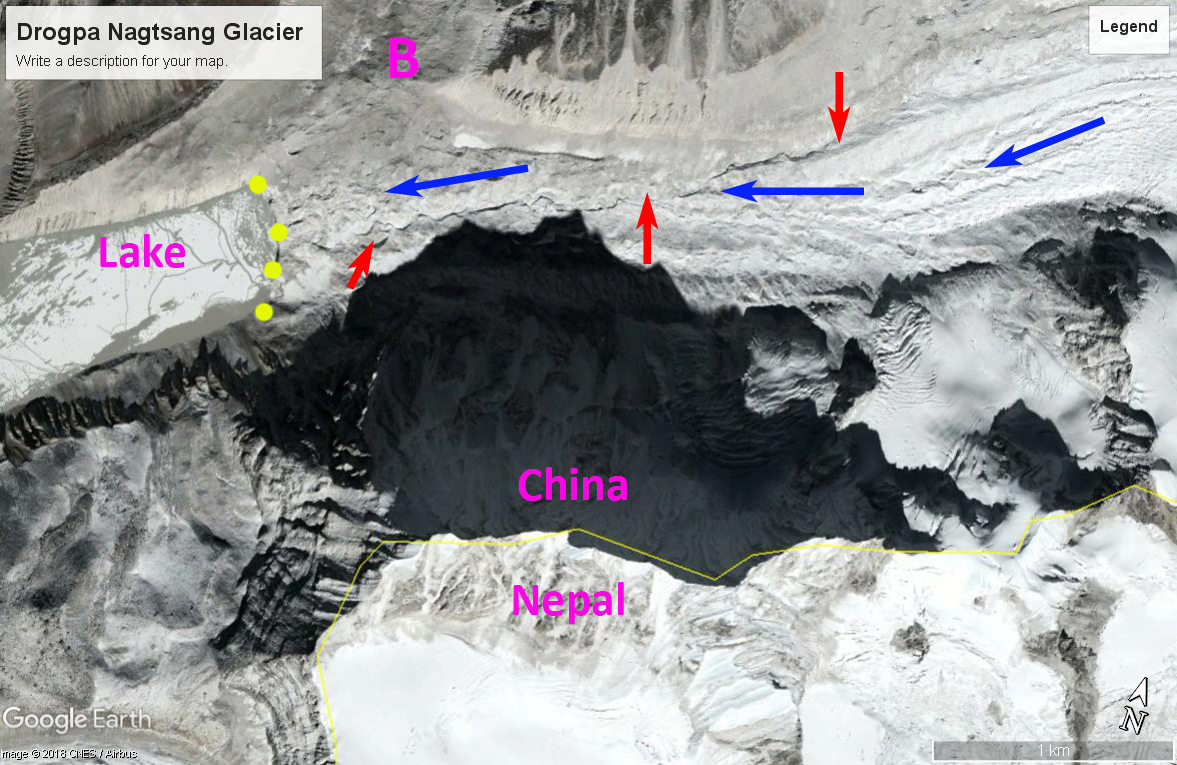
Digital Globe image with yellow dots indicating terminus, red arrows a supraglacial stream, blue arrows ice flow direction. B is the same tributary has noted in the Landsat images above.
 Dean of Academic Affairs at Nichols College and Professor of Environmental Science at Nichols College in Massachusetts since 1989. Glaciologist directing the North Cascade Glacier Climate Project since 1984. This project monitors the mass balance and behavior of more glaciers than any other in North America.