
1 February 2016
Understanding the 2015–16 El Niño and its impact on phytoplankton
Posted by lhwang
This is part of a new series of posts that highlight the importance of Earth and space science data and its contributions to society. Posts in this series showcase data facilities and data scientists; explain how Earth and space science data is collected, managed and used; explore what this data tells us about the planet; and delve into the challenges and issues involved in managing and using data. This series is intended to demystify Earth and space science data, and share how this data shapes our understanding of the world.
By Stephanie Schollaert Uz
Observations collected by NASA and NOAA satellites have monitored the progression of this year’s very strong El Niño in the equatorial Pacific by observing sea-surface temperatures and heights, winds, precipitation, air quality and chlorophyll concentrations. Additionally, buoys monitored by NOAA collect subsurface measurements of upper ocean heat content. The combination of these measurements and models indicate that El Niño peaked in December 2015 and has started to weaken, although its ripple effects will be felt around the world for some time.
One way to help the general public understand complicated Earth systems like El Niño is through ClimateBits: short, narrated visualizations of global data created through an interagency partnership among NASA’s Goddard Space Flight Center (NASA GSFC), NOAA and the University of Maryland, College Park. So far, eight ClimateBits videos have been produced. These data visualizations play on Science On a Sphere, now installed at more than 125 museums and science centers around the world. The videos have been shown on this network more than fifty thousand times; they are also available on YouTube.
The above ClimateBits video shows and describes El Niño. Because El Niño is a disruption to the normal circulation pattern in the tropical Pacific, the first data displayed in the video are ocean currents color-coded by sea surface temperatures produced by the NASA Scientific Visualization Studio from ECCO2 model output. Following global ocean circulation patterns, the concept of equatorial upwelling is introduced along with an explanation of how upwelling brings nutrients from depth to the sunlit surface waters. To illustrate the phytoplankton blooms that result, monthly composites of their green pigment or chlorophyll concentrations follow; these have been measured by MODIS Aqua since 2002. These were processed by the Ocean Biology Processing Lab at NASA GSFC and produced as monthly images by the Environmental Visualization Lab at NOAA, with assistance from Erik MacIntosh from the NOAA National Environmental Satellite, Data and Information Service (NESDIS).
Focusing on the equatorial Pacific, the El Niño events are highlighted as times when sea-surface chlorophyll concentrations decline along the equator due to the loss of the normal nutrient supply from deep water. This decrease in primary productivity is felt by species up the highest levels of the marine food web.
The video concludes with 2015 sea-surface temperature anomalies measured by NOAA AVHRR and NASA AMSR-E satellites, and produced as daily images by the Environmental Visualization Lab at NOAA. Here the west Pacific warm pool can be seen spreading eastward along the equator as the El Niño strengthens. Below the ocean’s surface, the warm pool deepens the thermocline—the level that separates warmer surface waters from cooler deep ocean waters—curtailing the usual upwelling of deep water nutrients to the east Pacific surface waters and resulting in less sea surface chlorophyll.
This video was created in October, prior to the peak of the event, yet the chlorophyll concentrations had already declined compared to the previous year and other neutral years. The image below shows the December 2015 El Niño at its peak compared to neutral and La Niña conditions.
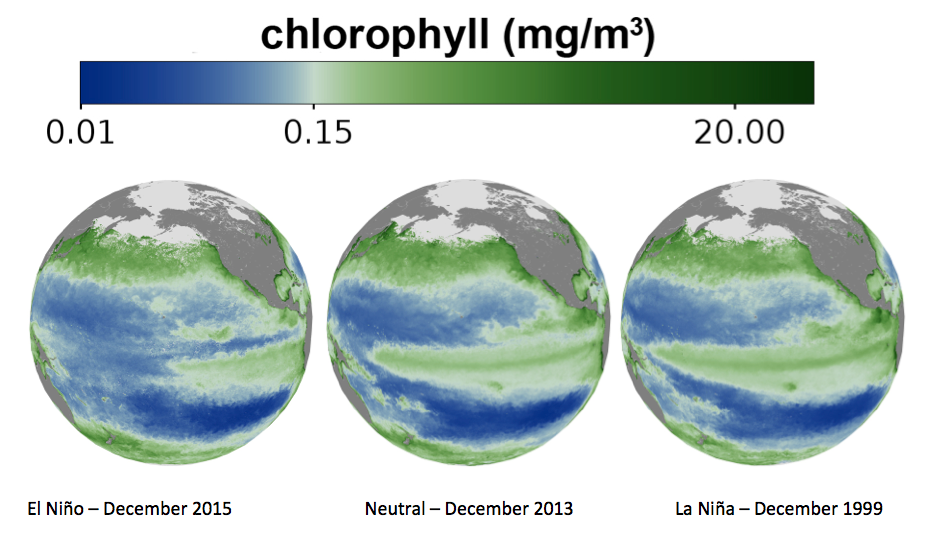
These images show sea surface chlorophyll in the Pacific Ocean observed in December 2015, 2013 and 1999. The 2013 and 2015 maps are derived from MODIS Aqua data, and the 1999 map is derived from SeaWiFS data, all processed at the Ocean Biology Processing Group at NASA GSFC using the SeaDAS image analysis package.
Credit: NASA GSFC
Shades of green indicate more chlorophyll (in milligrams per cubic meter) associated with blooming phytoplankton. Shades of blue indicate less chlorophyll and less phytoplankton. Note the difference in chlorophyll amounts along the equator: when equatorial upwelling is suppressed during El Niño, less phytoplankton bloom, resulting in lower chlorophyll concentrations (more blue). During the opposite phase of this climate oscillation, known as La Niña, upwelling is enhanced along the equator and more phytoplankton bloom, leading to higher chlorophyll concentrations (more green).
The last time such a strong El Niño occurred was 1997–98. A strong La Niña followed in 1998–99 and had the opposite impact of an El Niño: stronger east-to-west trade winds increased upwelling that lifted nutrients from depth to fertilize the biggest phytoplankton bloom observed in this region during the entire ocean color record, accompanied by a dramatic increase in fish catch. It is too soon to say whether the current El Niño will oscillate to a strong La Niña next year, as it did after the 1997–98 El Niño.
—Stephanie Schollaert Uz Ph.D. is an oceanographer who coordinates communication for the PACE project within the Ocean Ecology Lab and the Earth Science Division at NASA Goddard Space Flight Center
References and Related Reading:
ClimateBits: El Niño
International Research Institute for Climate and Society, Earth Institute, Columbia University (January 21, 2016) IRI/CPC ENSO forecast
NOAA Climate Prediction Center, ENSO blog
NOAA Pacific Marine Environmental Laboratory Tropical Atmosphere Ocean project