
16 February 2018
Chemical Cocktails Confound Phosphorus Management
Posted by John Freeland
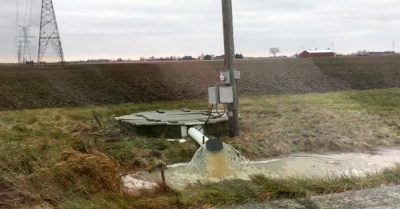
Edge of field pump station lifts and discharges subsurface drain tile water to roadside ditch in Monroe County, Michigan, 2017 (author)..
It’s been fifty years since the Canadian government at the urging of the International Joint Commission set aside the Experimental Lakes Area near Kenora, Ontario in 1968 to conduct large-scale experiments in aquatic ecology. There, the young Director named David W. Schindler, who would go on to become a world-renown limnologist, and others conducted experiments with nutrient loading and produce one of the most iconic photos in the field of ecology: the split-basin image of Lake 226 showing the effects of added phosphorus on algae growth. The research helped promote restrictions on phosphate-containing detergents and subsequent improvements in water quality.
This past November, according to the Cleveland Plain Dealer, Ohio Sea Grant and NOAA announced the Lake Erie Harmful Algal Bloom Severity Index was third-highest on record, apparently, because “the broad expanse of green scum was fed by high concentrations of phosphorus flushed from farm fields in the Maumee River watershed due to heavy rains in May and June.”
Today, the effects of biologically available-phosphorus on aquatic resources are well known and best management practices coupled with 4R nutrient stewardship (right source, right rate, right time, right place), aim to optimize crop production while reducing water pollution from agricultural activities. The Lake Erie harmful algal blooms of 2011, 2015, and 2017 suggest something’s still not quite right.
Today, we’re learning of additional phosphorus sources and processes that may be not be adequately accounted for as agronomists make fertilizer recommendations. Last year, No-Till Farmer reported on research linking glyphosate to phosphorus runoff in Lake Erie. The research showed that the phosphonate compound in glyphosate and soil phosphate compete for the same exchange sites on soil particles. When glyphosate is added to soil, phosphonate causes desorption of phosphate, which then enters the soil solution. According to the researcher quoted in the article,
“for every acre of Roundup Ready corn and soybeans that you plant, it’s about one-third pound of phosphorus coming down the Maumee (River)…”
Phosphonates, in addition to being found in glyphosate are constituents of household cleaners, such as bleaches and detergents, as well as pesticides and medicines – all of which can be found in biosolids. Recent research at Texas A&M University has demonstrated a multiple-step bacterial breakdown process that converts phosphonate to phosphate.
Are these phosphorus sources considered when accounting for nutrient budgets? Can they be accurately quantified? Can they be reasonably and responsibly estimated for management purposes? When it comes to environmental phosphorus and management, clearly, there’s still plenty of work to do.
 John Freeland earned a PhD in Soil Science (Pedology) at North Dakota State University and is a consultant working in the private sector. He has published soils research and taught at the high school and college levels. John is interested in wetlands, soil genesis, science communication, the intersection of art and science, and soil-water-landscape processes. John lives near the Ohio-Michigan border and plays bass in multiple music projects.