

12 June 2012
Video of the aftermath of yesterday’s earthquake triggered landslide in Afghanistan
Al Jazeira have posted a video on Youtube that shows the aftermath of the earthquake-triggered landslide yesterday in Afghanistan, which is believed to have killed up to 100 people:
Based on the images there seems to be little prospect of any survivors.
11 June 2012
A possible earthquake triggered landslide in Afghanistan
This morning there were two small earthquakes in Afghanistan. According to the USGS, the first was M=5.4 at 49 km depth, and the second was M=5.7 at 33 km. That puts the epicentres on the edge of the Hindu Kush mountains as shown in the Google Earth images below:
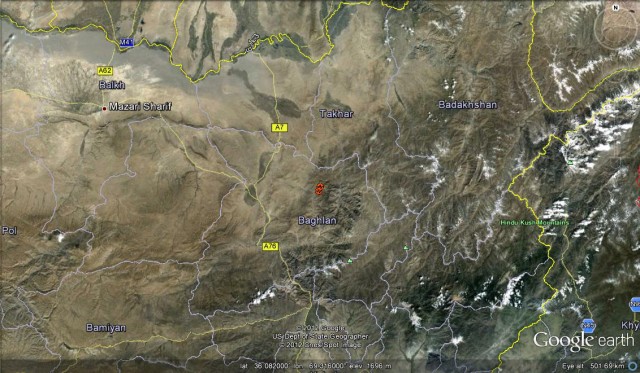
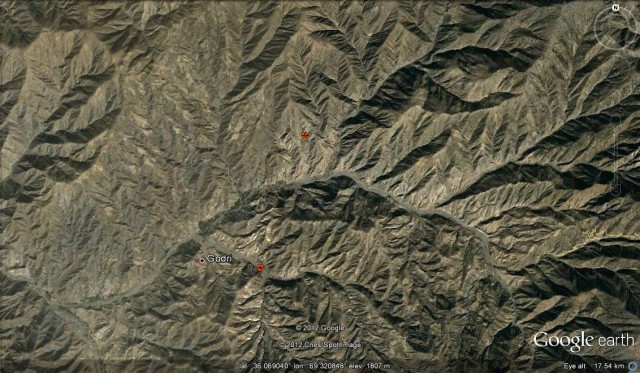 Neither of these events would normally be expected to cause substantial damage, given their size and depth, but Afghanistan is desperately poor and highly vulnerable to the effects of earthquakes. In addition, the landscape is landslide-prone during seismic events. So, reports that there may have been an earthquake triggered landslide with multiple casualties are not that surprising. As I type (in a slightly jetlagged state having just got off my plane from Canada), most reports seem to indicate that a landslide occurred in the Saya Zara area. This BBC report is typical, indicating that the landslide buried about 20 houses, and that there have been casualties. Other reports provide more detail, indicating that the affected area was the village of Dara Azara, and that about 70 people have been buried.
Clearly at the moment details are somewhat sketchy, but should become clearer in the next few hours.
7 June 2012
The Vajont (Vaiont) 2013 conference
October 2013 will mark the 50th anniversary of the Vajont landslide disaster in northern Italy, which killed over 2000 people. To mark this event, a major international conference is being organised in Padua:
 The conference website provides full details, but the call for papers is now out, with an abstract submission date of 30th June 2012.
6 June 2012
A fatal rockslide in Switzerland with major economic impacts
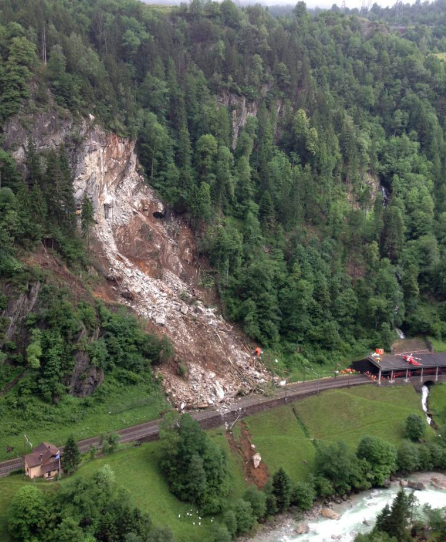
On Tuesday a rockslide occurred on the main Gotthard railway line in Switzerland, killing a railway worker and injuring two others. This image, from here, shows the landslide scar and deposit:
http://www.20min.ch/schweiz/zentralschweiz/story/31898172#showid=49816&index=1
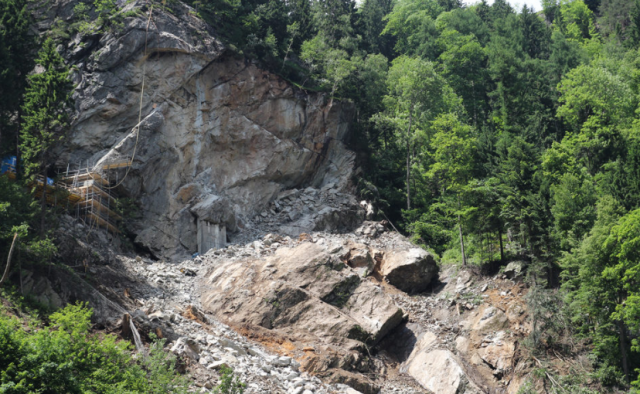
According to this report, the site of the accident suffered from a 400 cubic metre rockfall event in March. As a result, there were ongoing engineering works to stabilise the slope. This interpretation is supported by images of the site, which appear to show scaffolding against the rock face:
http://www.20min.ch/schweiz/zentralschweiz/story/31898172#showid=49816&index=5
This landslide had an estimated volume of about 2500 cubic metres. Recovery operations are being hampered by continued instability on the rock face, with an estimated 500 cubic metres of rock remaining in an unstable state. The track is expected to remain blocked for up to two weeks.
This landslide is likely to have major short-term economic impacts as the Gotthard Railway is one of the most important railway lines in Switzerland, carrying both freight and passengers between northern Switzerland and Italy:
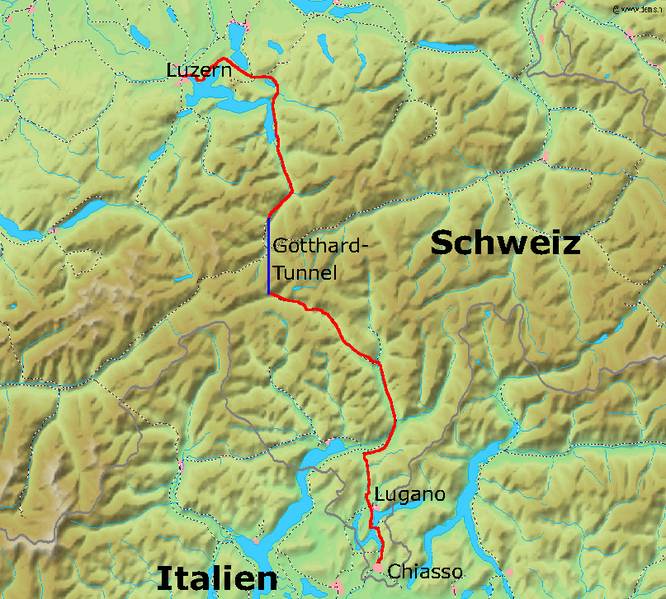 Of course landslides on railway lines are not unusual, but rarely cause both loss of life and such large-scale economic impacts.
Thanks to James Glover, a PhD student at Durham, for his help with this post.
4 June 2012
Landslides and Engineered Slopes: Protecting Society Through Improved Understanding
This morning I will deliver the opening keynote lecture at the 11th International and 2nd North American Symposium on Landslides. This is the most important landslide meeting, held once every four years. This year it is in Banff in Canada. The topic of my talk is the title of the conference “Landslides and Engineered Slopes: Protecting Society Through Improved Understanding”. The presentation should be visible and can be downloaded from Authorstream:
[authorSTREAM id= 1436393_634743447163092500]
These are the two animataions:
Global data:
Asia data:
I can povide a copy of these videos if you would like them. Please email me at [email protected]
31 May 2012
Updated: A movie of the annual cycle of rainfall-induced landslides in Asia
Updated – I have now created and uploaded a better version
In preparation for my opening keynote lecture at the International Symposium on Landslides in Banff next week, I have been working on producing some animated movies of maps of landslides worldwide. This has been based on the work that I have been undertaking for almost a decade now collating data on landslides that kill people. I thought that it would be fun to produce a set of short films to show the annual cycle of landslides. I am still working on this (and it has been a steep learning curve), but I have out my first prototype online on Youtube.
The for the movie below is based upon this map of Asian landslides – here each white dot represents a landslide that killed at least one person in the period between 1st January 2004 and 31st December 2010. Note that only landslides that killed someone are included, and no indication is given of the number of deaths in each event:
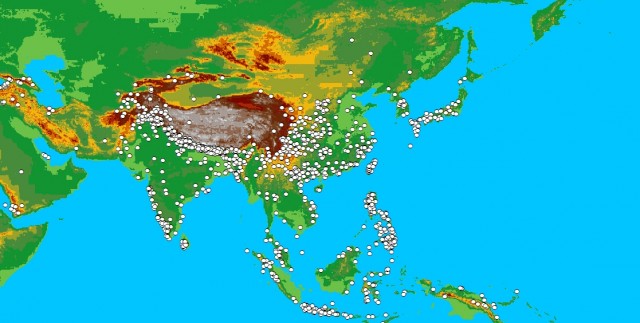 Note the background image here is the SRTM global elevation model (i.e. colors indicate elevation). Of course, whilst useful, this map does not really indicate the seasonality of the landslides. So, I have classified each landslide by week of the year (i.e. week 1 is 1st to 7th January, week 2 is 8th to 14th January, etc. Note that week 52 has 8 days!). I have then animated this dataset to produce a movie. It is at the moment somewhat less than perfect – I am working on improving it – but it is an interesting start:
What it shows is the way that the number of landslides dramatically increases in the summer months as the monsoon winds up, especially in South Asia and China Note also the way landslides in Indonesia and the Philippines really get going late in the year.
I am currently working on a global version of this, which is actually a little better. I will put this online in the next few days, and as usual I will put the presentation on Authorstream early next week.
I am sure that some readers will be in Banff – I shall really look forward to meeting up with you. Let’s have a beer (or two)!
30 May 2012
My article on prediction of natural hazard events
You might be interested in an article that I have in the Guardian today on the pros and cons of prediction of natural hazards, and in particular of earthquakes.
More information about the Seti River landslide and debris flood in Nepal
Over the last few days additional information has come to light about the Seti landslide in Nepal, which killed between 30 and 72 people (I remain confused about the actual number of deaths in this case). I will summarise these below:
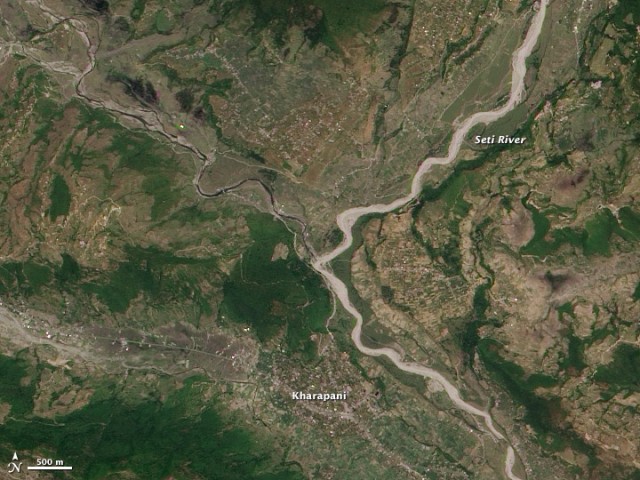
NASA imagery of the landslide and the track of the flow down the Seti River
Our colleagues at NASA have been very proactive in using their full range of satellite tools to collect imagery of this event. Their latest post examines the track of the landslide debris and reinterprets the event. The magnitude of the impact of the debris and water wave is quite stark in their latest image:
An eyewitness report of the aftermath
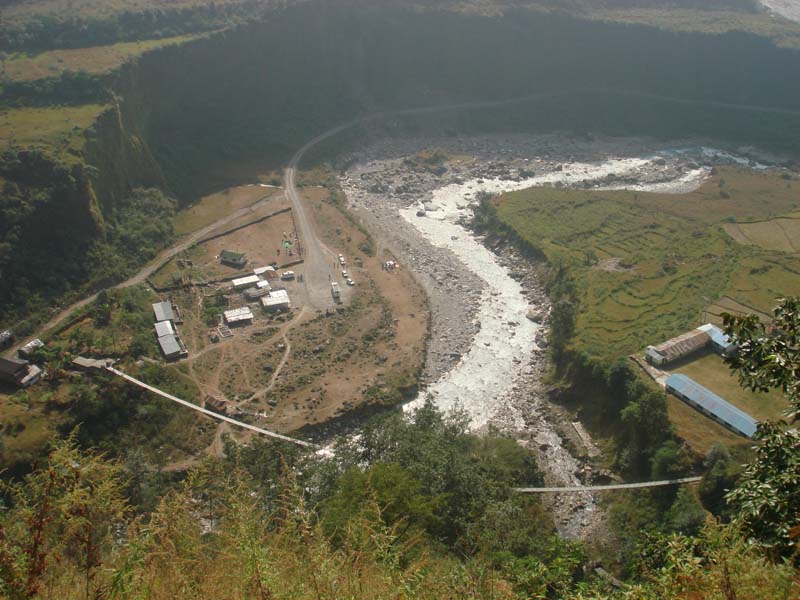
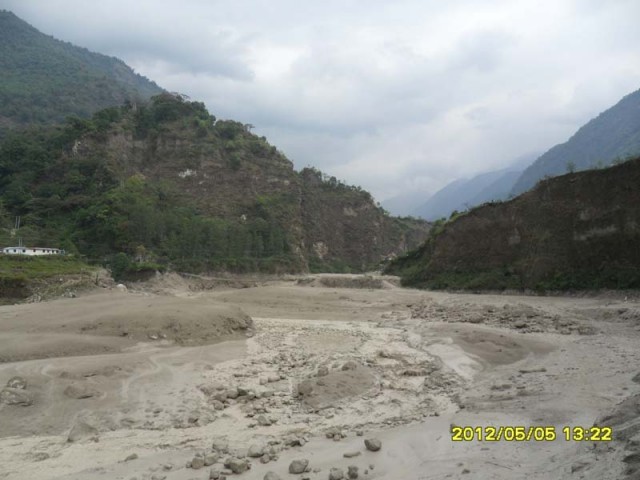
Meanwhile, Robin Marston, a resident of Nepal, contacted me to let me know about the damage to Kharapani, which is shown in the image above. In his email he notes that:
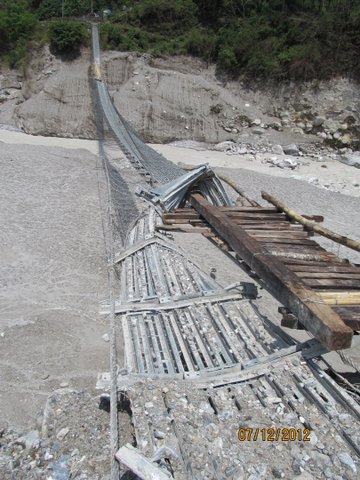
“The Kadoorie built suspension bridge near the top of the valley is at least 70 mts long and the valley (gorge) at that point is some 90 ms wide. The bridge lies some 30 -35 ms horizontally above the normal level of the river. There is flood debris lying on the bridge and side netting was damaged”
This image shows the bridge and the damage that it has received:
 This is the Kharapani area before the debris flood:
 And this is the same place afterwards:
An ICIMOD report on the landslide
Meanwhile, ICIMOD also sent a team into the field and they have been working on satellite images of the area in question. They have correctly identified a landslide in the upper reaches of the Seti River that progressively developed prior to the major collapse event, and speculate that it was responsible for the debris flood. This is a nice piece of work, but none of the imagery that I have seen indicates that a barrier lake was present (though to be fair detecting such a feature in this terrain may be very challenging). The coincidence in timing of the large landslide on Annapurna IV (timed using the seismic data and from the aerial images) and flood means that this is almost certainly the cause. However, this other landslide may well have contributed material and water to the debris flood, intensifying its impacts.
An alternative view of the event
Many of you will have seen the comments on my earlier post from Dr Ranjan Dahal, who strongly indicated that in his opinion the interpretation that Colin Stark and I had made was incorrect. I exchanged emails with Dr Dahal, who I consider to be a friend, and he has now posted online a report and interpretation. I will not comment on this interpretation, or indeed on the apparent references to our work, except to say that I stand by the interpretation that we have previously posted. I would also note that I am not sure why there is a reference to seismic triggering of the landslide – I have seen no suggestion that this was a mechanism for the initiation of the failure. Colin’s work is based upon the seismic signature that the landslide generated, and this does not imply a seismic trigger (indeed quite the opposite).
I will point out two really interesting aspects of Dr Dahal’s report though. First, he provides a photograph of the landslide site that shows the source of the rockfall that initiated the sequence. This location is entirely consistent with the satellite images that show a section of missing ridge after the event, although I am not sure that I would describe this event as small. Second, he also provides an image of the canyons down which the landslide debris travelled to reach the Seti river.
Mainstream media and the landslide
Finally, the Himalayan Times in Nepal have posted an article on the Seti River debris flood that heavily quotes the work that Colin and I have been undertaking on this event. It is nice to be quoted, even if the nationality of both of us has been changed!
24 May 2012
Another teleseismic landslide – this time in Alaska on Monday 21st May 2012
One of the key aspects of the work that Colin Stark and I, working with NASA, have undertaken over the last few days on the Seti River landslide was the fact that it was detected remotely on the global seismic network. This is part of a project that Colin and Goram Ekstrom have been undertakeing to develop techniques to detect remotely large landslides – as I have highlighted previously this is really very exciting work.
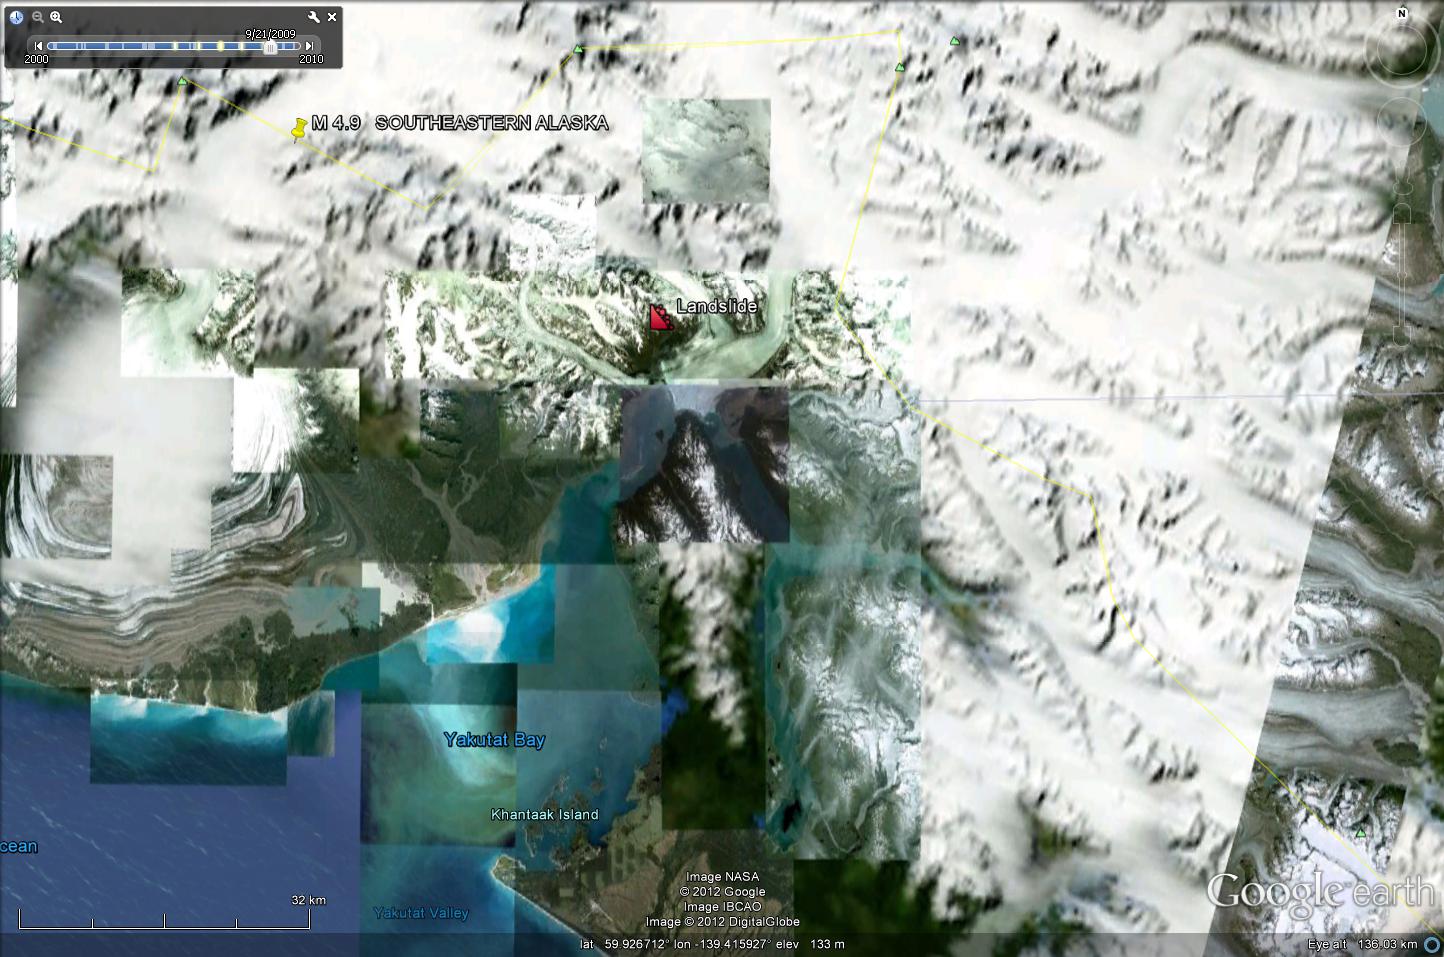
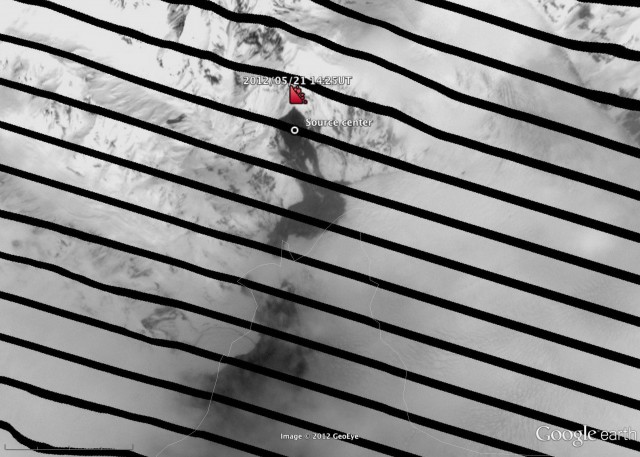
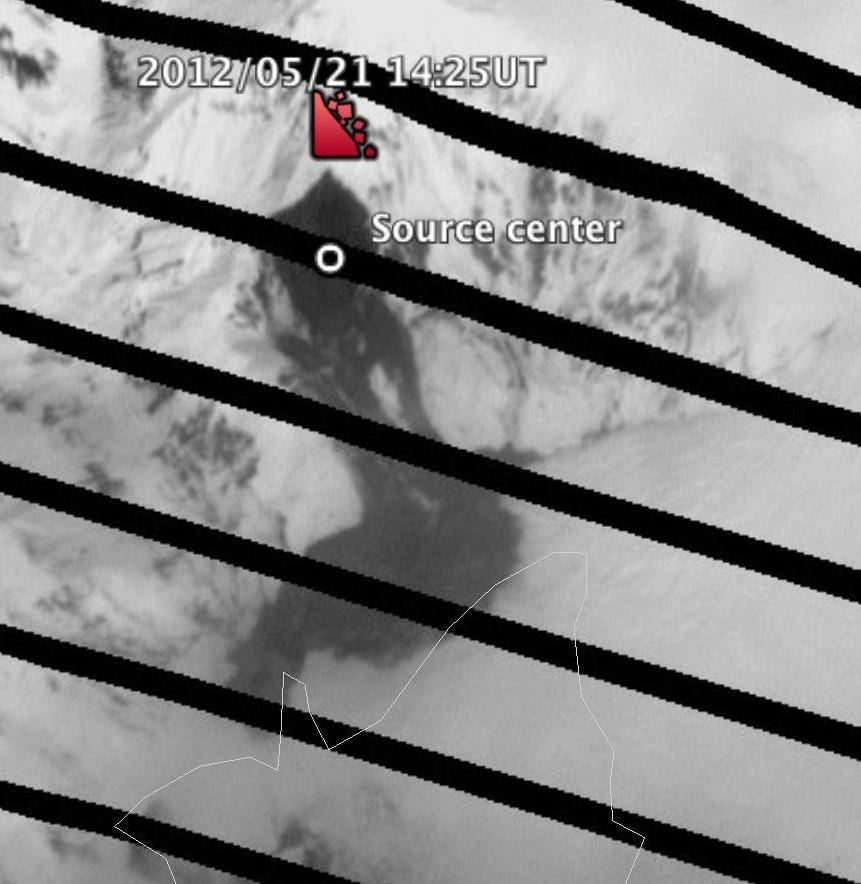
Amazingly, two days ago Colin identified a seismic signal that indicated another landslide event, this time ion the flank of the Hubbard Glacier fjord in the very south-eastern corner of Alaska. The landslide occurred at the location shown (courtesy of Google Earth) below at 14:25 UT (06:25 local time) on 21st May:
 The slope in question is shown in the Google Earth perspective view below:
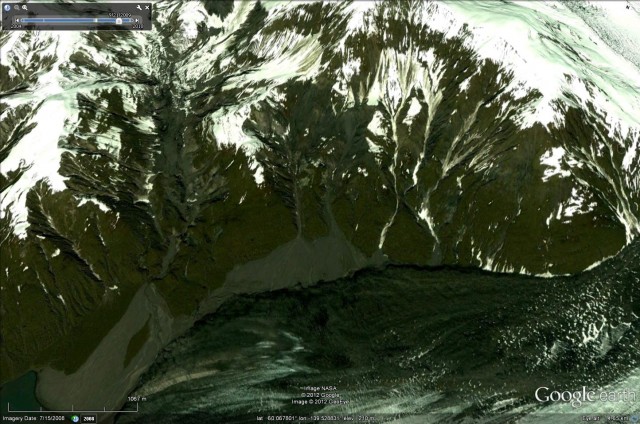 This is a slope that has clearly had considerable small-scale landslide activity in recent times. Remarkably, the Landsat 7 ETM+ satellite overflew this area about six hours after the landslide, and managed to collect a good dataset. Colin has downloaded the data and has produced the image below of the landslide. Note that the imagery of course suffers from the same tiger striping problem that we saw in the Seti River dataset (this is a technical problem with the instrument), but despite this the landslide characteristics are clear:
 And here is a close-up view of the landslide itself:
 Given the remoteness of the location I suspect that this event is undetected to date, but I’d be really interested to hear about any observations that have been made about it.
23 May 2012
Understanding the Seti River landslide in Nepal
Using satellite imagery and aerial photographs to understand how a landslide caused the Seti River flood
By David Petley and Colin Stark
The Seti River debris flow of 5th May 2012, which is believed to have killed 72 people, was triggered by a landslide on the flanks of the Annapurna mountain chain. In our earlier posts, we highlighted that Colin, working with Goram Ekstrom, had detected this landslide using seismic instruments, and had been able to evaluate its characteristics. Furthermore, the landslide was both observed by Captain Maximov of Avia Club Nepal, and captured on a video camera mounted on the wing of his aircraft.
Over the last couple of weeks we have been working to try to understand this landslide. We have been helped by a wide range of people and as a result now have a reasonable understanding of what we think happened. This post presents our initial findings.
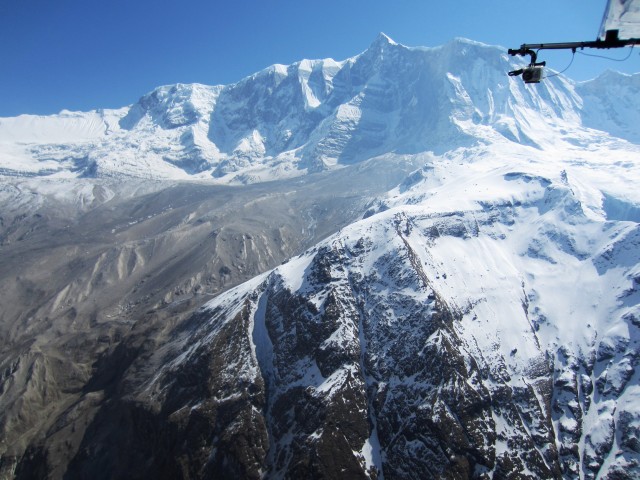
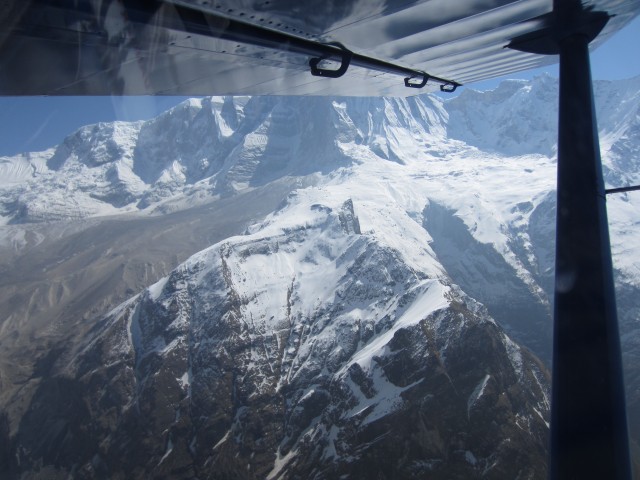
First, Captain Maximov and Avia Club Nepal have been exceptionally helpful in providing more information about the landslide. The following three images are used with their permission but are copyright of Avia Club Nepal. The first shows the landslide as it occurred. The slide is clearly generating a huge cloud of dust – this is an important observation in terms of our interpretation below (note that we have rotated and cropped this image to get the best possible view of the landslide):

Copyright Avia Club Nepal
These two images show the deposition area of the landslide. They were taken a few days after the event:
Copyright Avia Club Nepal
Copyright Avia Club Nepal
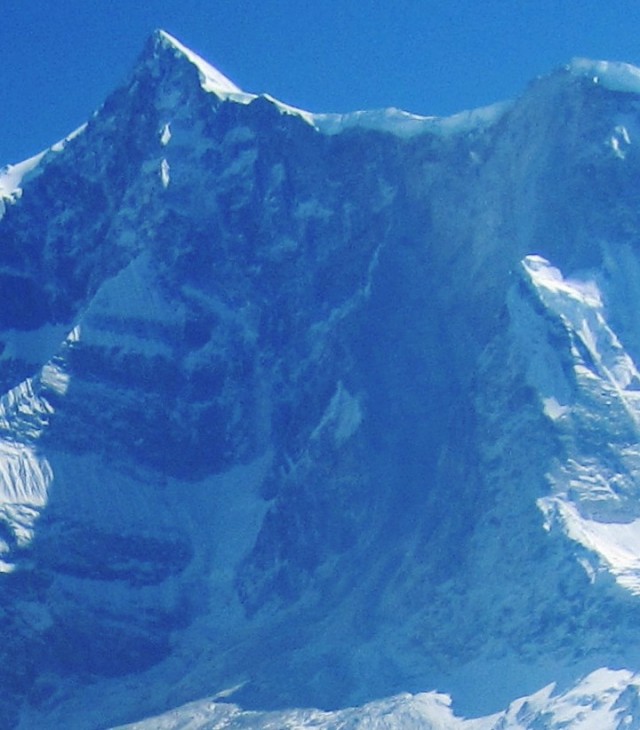
Whilst the obvious feature in these images is the large depositional zone on the surface of the lower angled slopes, if you look carefully you can see that on the steep slope behind there is a scar on the mountain side that extends to the ridgeline. We have zoomed in on this area in the image below, and have tried to change the contrast to show the feature more clearly:
Copyright Avia Club Nepal
Note in particular the section of the snow cornice that is missing in the top right side of the image. Once you have seen this the fresh scar is really very clear. So it is clear that the landslide is a huge rockslope failure – note that this cliff is about 2000 m high, on the flanks of Annapurna IV. The mass appears to have fragmented when it reached the lower angled slopes at the foot of the steep section, and to have runout as a rock and debris avalanche.
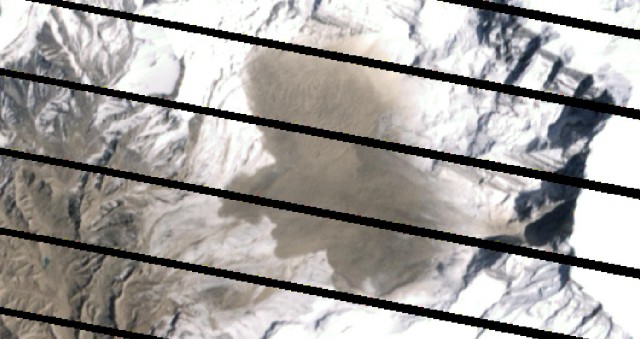
To better constrain this phase of the landslide, we have been working with Michon Scott of NSIDC, and Robert Simmon and Jesse Allen of NASA, who have been kindly collecting satellite imagery for us. They will be posting a summary of their work on the NASA website shortly (and I will update this post to provide a link), but their help has been invaluable. The best image was collected on 6th May by the Landsat ETM+ instrument. Unfortunately there are technical problems with Landsat that mean that the images have missing data, which generates the tiger-stripe effect that you can see below. However, the data quality is fantastic, such that the jey features of the landslide are quite clear. So here is the unannotated image, and below we have included one that highlights the key features of the landslide:
 Annotated version:
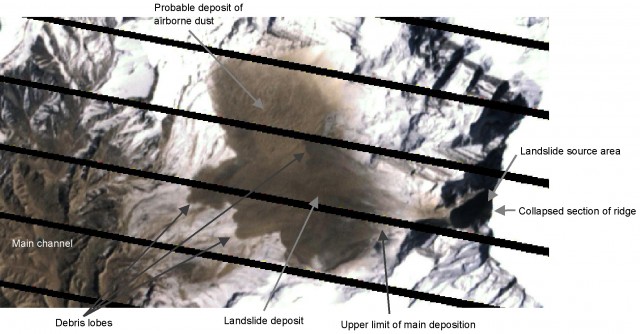 So, as shown above our interpretation is that the landslide consisted of a main detachment event from the steep 2000 metre high rock slope flanking Annapurna IV. This rockslope failure had a volume of about 22 million cubic metres. At the toe of the steep slope the mass fragmented and transitioned into a rock avalanche that flowed down the very steep slop. As the gradient started to decline deposition was initiated. The landslide generated a series of flows – based on previous events it is reasonable to think that there may have been a series of collapses following the main event that generated some of the lobes seen in the imagery. The fragmented mass generated a huge volume of dust, which was carried northwards by the wind to form the large aeolian deposit shown in the image above.
However, there is one remaining oddity that we have yet to resolve fully. The image above shows that the landslide did not reach the main channel – indeed even the most distal lobe is some considerable distance from main channel. So how did the landslide generate the huge debris flow that travelled down the main channel? At the moment we can only speculate, but the most likely explanation is that a small proportion of the debris entered and then flowed down one or more of the steep gullies that descend about 2000 m to the main channel. The most likely candidate is visible in the Landsat ETM+ image:
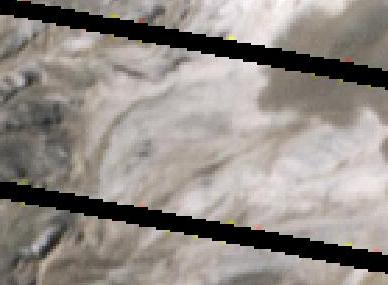 Again, we have annotated the image below for clarity:
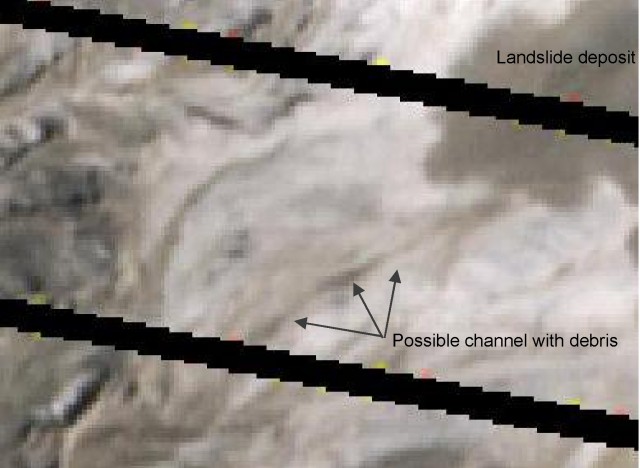 We have highlighted the most likely candidate gully, though close inspection of the image shows that there are other candidates, and it may well be that the flow travelled down several gullies at the same time. So, we hypothesise that a small proportion of the landslide travelled down the gully system, and entered the main channel at high velocity. This would then have entrained debris and fluid to create the destructive debris flow that claimed so many lives.
Finally, on 20th May NASA also imaged the Seti River from the landslide source (now covered in snow) down to Pokhara using the ALI instrument:
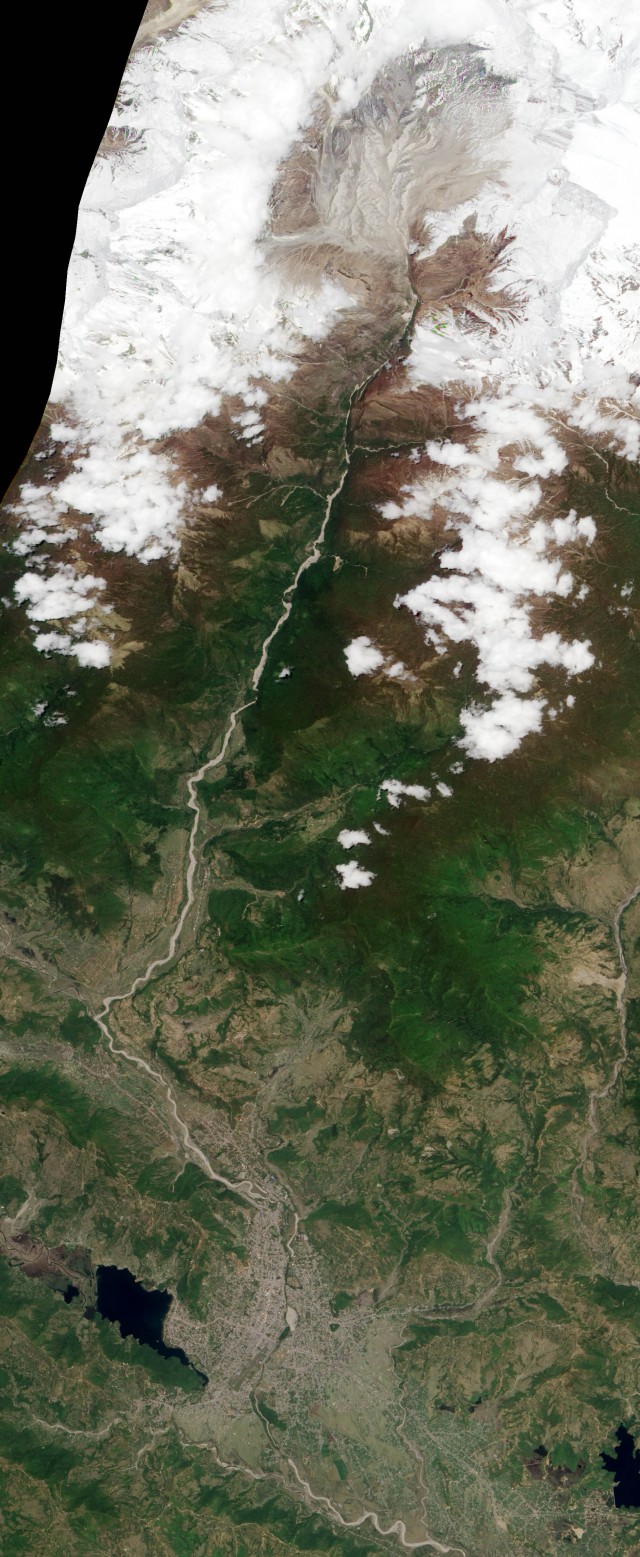 The enormous erosion and deposition caused by the debris flow along the channel is clearly visible right down to Pokhara, the town that is visible at the bottom of the image.
We have more work to do on this landslide, but as you will see from the above we now have a quite good understanding of it. We would welcome your comments and thoughts.
An interesting point to note is just how closely the analysis of the seismic data is to our interpretation of the seismic data is to the actual event as shown in the imagery. The power of this technique is becoming clear.
 Dave Petley is the Vice-Chancellor of the University of Hull in the United Kingdom. His blog provides commentary and analysis of landslide events occurring worldwide, including the landslides themselves, latest research, and conferences and meetings.


Recent Comments