

22 May 2012
The remarkable Preonzo landslide in Switzerland last week
Whilst the main action in the Preonzo landslide in Switzerland occurred when I was out of the office last week, this event is too impressive to ignore. And I must acknowledge here the help from a wide variety of people in putting this post together, including Colin Stark, Jeff Moore, Guy Bullot, Stefan Tobler, Jens and Patrick Ebeling. Your help is really appreciated.
To recap, the slope at Preonzo was identified as being unstable some time ago, and was monitored over many years. The final failure event was anticipated as a result of an accelerating trend in movement rate observed in early May, and monitored with a radar system. The area below the slope was thus cordoned off before the start of the major failure events.
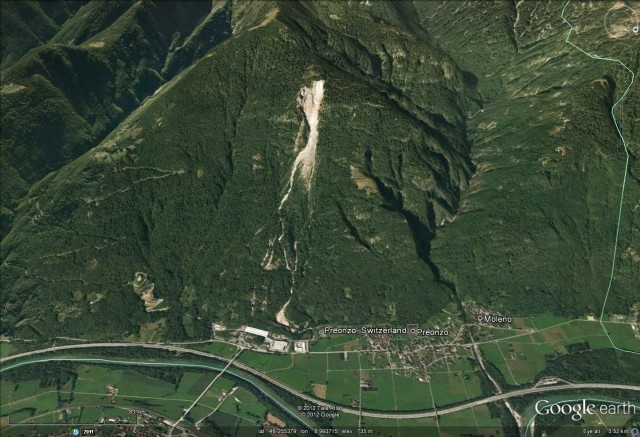
The slope that collapsed is this shown below in a Google Earth perspective view:
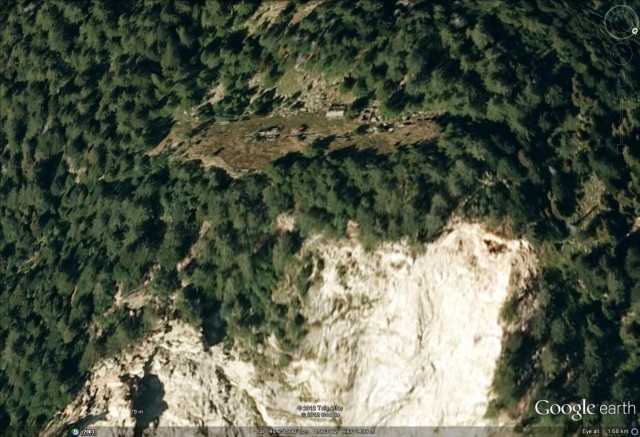
 The reasons that the slope had been identified as being potentially hazardous are clear from the high resolution imagery of the crown area, which appears to show a tension crack across the terrace:
 One of the main failure events, on (I think) 15th May, was captured in this remarkable video:
http://www.youtube.com/watch?v=coD0QGecGOU
This appears to be a major collapse event from the middle part of the slope (i.e. not from the crown), possibly induced by rockfalls from the upper reaches of the slope shown in the image above. The video demonstrates that there is more material that is yet to collapse.
The video below shows the police closing off the road and some precursory rockfall activity prior to the main failures.
The various newspaper articles suggest that to date 300,000 cubic metres of material have collapsed, with about another 500,000 cubic metres remaining in the unstable area. There are two wonderful sets of photographs of this event online. Check out this set, from which the before and after images below are taken:
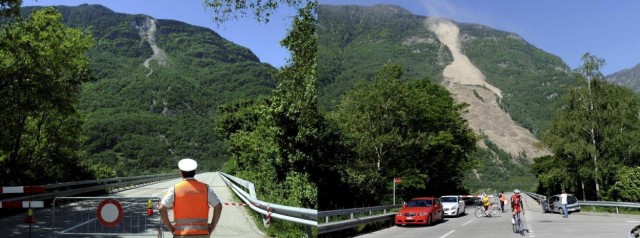
http://www.bluewin.ch/fr/index.php/173/fr/news/galeriedimages?id=35951
Whilst this set of images has some great shots of the crown of the landslide:
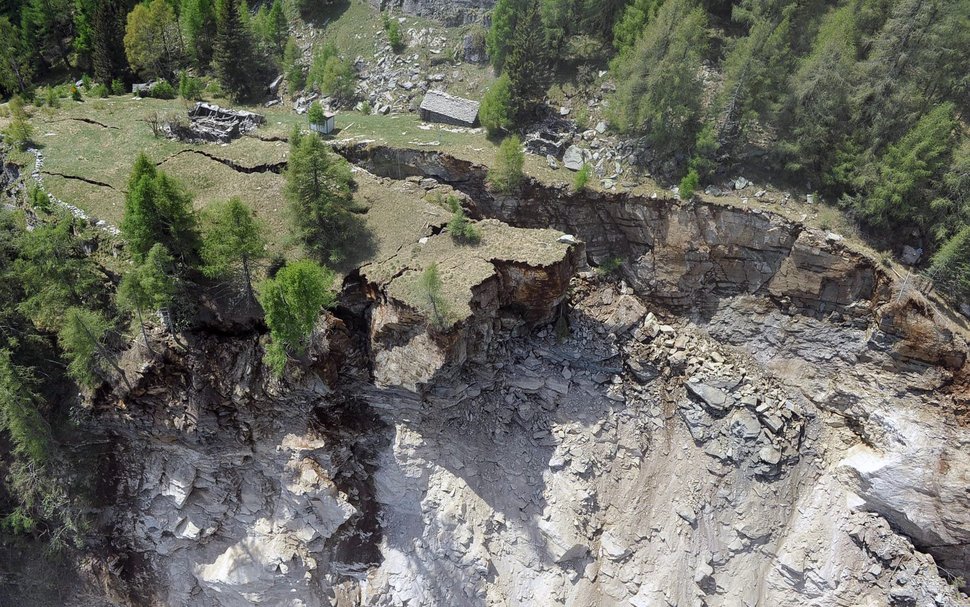
http://www.tagesanzeiger.ch/panorama/vermischtes/Nach-Felssturz-Industriezone-bleibt-gesperrt/story/24980057
21 May 2012
A huge relocation programme from riverbanks in Vietnam
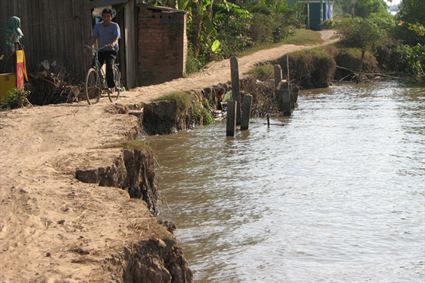
http://www.lookatvietnam.com/2012/04/mekong-delta-dwellers-live-in-fear-of-landslide.html
Apologies for the lack of posts in the last week – I took a trip into the high mountains of Northern Pakistan, which precluded other work. So, to start to catch up, a very interesting article was published today in Vietnam about the impact of landslides on riverbank communities. It says:
River landslides, climate change and flash floods are increasingly threatening the lives of tens of thousands of households in Vietnam, who may be faced with no choice but to relocate to safer areas, according to the Ministry of Agriculture and Rural Development. Statistics from the ministry state that the country now has hundreds of landslide-prone spots and at least 60 river valley areas that are highly susceptible to flashfloods. Pham Khanh Ly, deputy head of the Department of Co-operatives and Rural Development, says up to 600,000 households should be relocated within the next few years, and 350,000 of these by 2015. Meantime, relevant authorities have been able to set a target to relocate 125,000 households by 2015 and 300,000 by 2020, said Mr. Ly. Priority will be given to those living in the Mekong Delta, the northeastern and north-central regions…Total capital required for the purpose will exceed VND30 trillion (US$1.4 billion) from now until 2020. Of this amount, 60 per cent will come from the central budget and 40 per cent from local budget.
The forced relocation of 300,000 households (which, based on an average household size of 3.8 people suggest a total of about 1.1 million people), is a poorly reported but very substantive impact of landslides.
Meanwhile, there is an interesting article here about the ongoing relocation programme from riverbanks in the vicinity of the Three Gorges Dam in China.
12 May 2012
More information on the landslide that caused the Seti Flood in Nepal
Over the last few days Colin Stark and I have spent some time trying to determine the nature of the landslide that was responsible for the catastrophic flood on the Seti River, close to Pokhara in Nepal, which killed 72 people. We are trying to tie together the amazing data from the seismic network with observations and timings. The primary source of information has been the remarkable videos and photos collected by Captain Alexander Maximov of the Aviaclub Nepal, who was flying over the valley at the time. You will recall that Captain Maximov raised the alarm about the flood, which may have saved many lives. I must at this stage thank Captain Maximov and Aviaclub Nepal for both their prompt action and for their help – a mountain flight with them is definitely on my “to-do” list next time I am in Nepal!
The latest, genuinely remarkable, development is that Captain Maximov captured the landslide as it occurred on a video that he was shooting from the wing of the aircraft. He has posted the video on Youtube:
http://www.youtube.com/watch?v=Uk82ggshSKs
You will see that the aircraft was flying orbits to allow sightseeing. On the first orbit the slope was apparently stable, in the second it was in full collapse mode, generating huge amounts of dust. Note the lack of an obvious triggering process (clear weather, no seismicity). These two frames from the film arereally interesting. This is from the first orbit, showing the site of the landslide:
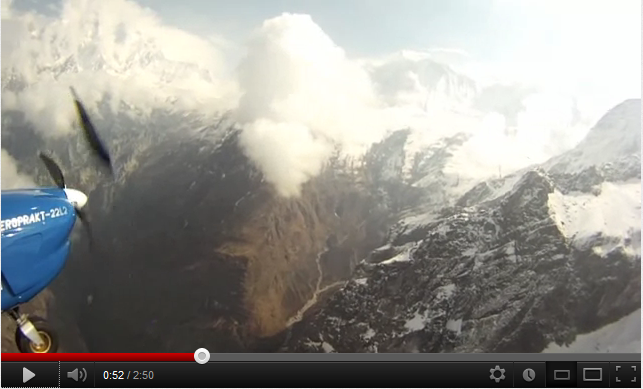
And here is one from the second orbit with the landslide in full motion:

The two images are only 1 minute and 16 seconds apart, but the failure is apparently stable in the first and full developed in the second. This is consistent with the observations from the seismic data of course, which indicates that the entire event took less than two minutes.
Colin has worked very hard to use the video to determine the location of the landslide. The best estimate is that is was here (this is my interpretation of Colin Stark‘s great work on this, please treat is as very speculative):
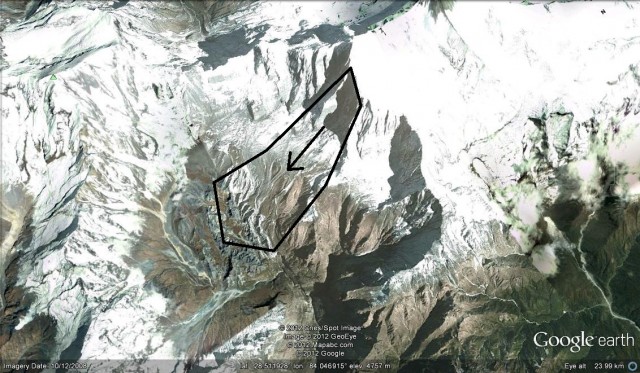
This is the flank of the mountain known as Annapurna IV.
The flood event itself was very destructive. If you have not seen in it, this video shows the wave passing downstream:
www.youtube.com/watch?v=3W0HbJRN8JE
The mechanism through which the wave was generated remains unclear. To my mind the initial assumption that it was a landslide dam break flood seems in question given the location of the landslide. I wonder if the slide caused extensive melting of glacial ice in the valley? Alternative possibilities are the transition to a debris flow of the landslide mass itself, which then entrained extensively downslope, or the mobilisation of sediments in the valley.
I would be very grateful for comments and thoughts on this. Needless to say, satellite imagery of the landslide deposit would be absolutely invaluable.
9 May 2012
Using seismic data to analyse the Seti River landslide in Nepal
Colin Stark and Goran Ekstrom have been working for a while on the analysis of seismic data to detect very large landslides. Whilst still in its infancy, this technique shows great promise for very large landslides, and it is increasingly clear that some landslide parameters can be extracted from the seismic data if the force history inversion is undertaken correctly.
On 5th May 2012 the global seismic network detected what appeared to be a landslide event to the north of the town of Pokhara in Nepal. Soon after a flood wave travelled down the Seti River, killing over 50 people. It is likely that the wave was triggered by the collapse of a large landslide mass that had impounded the river.
Colin and Goran have now undertaken Landslide Force History (LFH) inversion for the event that they detected on 5th May, and to quote Colin (with his permission) “we are now 100% sure there was indeed a seismogenic slope failure in the Pokhara area”.
Their best estimate for the landslide parameters are as follows:
- Date/time: 5th May 2012 at 03:24:56 GMT = (i.e. 09:09:56 local time)
- Runout duration: ~103 seconds
- Max force: ~1.2*10^11 N assuming a mass of 1.4*10^11 kg (see note#1 below)
- Runout distance: ~1040 m (see note#1 below)
- Height drop: ~350 m (see note#2 below)
- Max accel: ~0.85 m/s^2 (depends on mass assumption)
- Max speed: ~24 m/s (ibid)
Colin notes that:
Note#1: There is an inherent ambiguity in the LFH inversion since we obtain force, which is mass*acceleration, which integrates up to mass*distance. If we specify mass, we predict runout distance (and height drop); if we specify runout distance or height drop, we predict mass. In this case I would bracket (generously) thusly:
- n/c
- n/c
- n/c
- Mass range: 5*10^10 kg — 2*10^11 kg
- Runout distance ~ 2910 m — 740 m
- Height drop ~970 m — 250 m (see note#2 below)
- Max accel ~ 2.4–0.6 m/s^2 (depends on mass assumption)
- Max speed ~ 67–17 m/s (ibid)
From experience I would guess somewhere in the middle is most likely, i.e., my guess above at a mass of around 1-2*10^11kg. Once we have satellite imagery, the bracketing will improve markedly.
Note#2: The inferred height drop is dependent on the mass assumption (or measurement), but it is apparently also dependent on slope failure mechanism – on occasion, we appear to underestimate (in the LFH inversion) the vertical force involved. This may simply be because our inversion scheme does not at present apply extra geomorphic constraints beyond the requirement of net stationarity. We’re working on this.
One of the most intriguing aspects of this technique is that it generates a trajectory of the centre of mass of the landslide. This is a planform diagram in which the length of the arrow indicates the relative speed:
One very useful result: the planform trajectory of the landslide center of mass. Here’s a pic (the arrow size gives relative speed):
 Thus, as Colin says:
“This landslide (centre of mass) moved almost directly westwards with a modest bend in its trajectory”
So, assuming that the detected event did provide the debris that triggered the collapse, where did it happen? Well, the analysis of the data suggests that it was in this area, althoigh it is not well constrained:

From there we can turn to the second amazing part of this story. Kunda Dixit is a well-known journalist in Nepal. A day or so ago he made the following comment on this blog:
The latest death toll is 17 dead 47 missing. The cause was neither glacial lake outburst nor ice avalanche but the collapse of a rockface on the eastern flank of Machapuchre.
You may find these interesting:
http://nepalitimes.com.np/blogs/kundadixit/2012/05/05/avalanche-flood-on-seti/
and
http://nepalitimes.com.np/blogs/kundadixit/2012/05/05/eye-in-the-sky/
Machapuchere is shown in the image above. However, the landslide moved from east to west, which suggests that it was perhaps a failure on the rockface downstream from Annapurna II. Note though this is just speculation at this time, and it could of course be that the landslide event that was detected and the event that caused the flood are unrelated (although the coincidence would be surprising).
Finally, it is worth noting that Kunda Dixit’s post points out that the alarm about this flood was raised by a light aircraft pilot, Captain Alexander Maximov, who saw it from his aircraft. There are even images of the front of the flow taken from the aircraft:
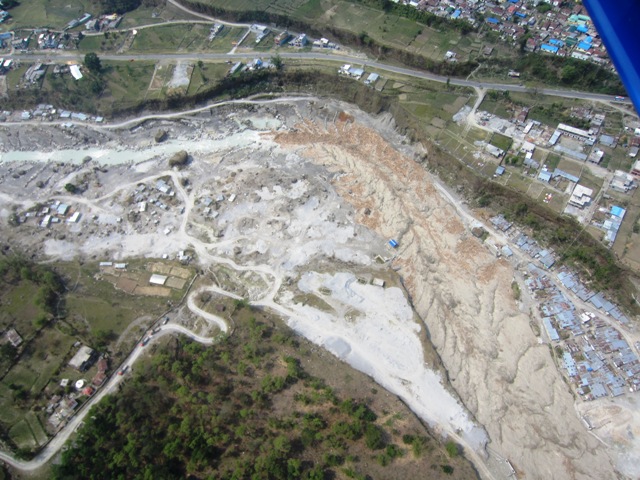
http://nepalitimes.com.np/blogs/kundadixit/wp-content/uploads/2012/05/5.jpg
6 May 2012
Flash flood in Nepal kills at least 15, with up to 36 more missing
Yesterday the Seti River in Kaski District in Nepal was affected by a catastrophic and very sudden flash flood. The flood affected the villages of Kharapani in Sardikhola VDC; Sadal in Machhapuchhre VDC; Yamdi; and Ramghat in Kaski district. To date 15 people are confirmed to have been killed, but the toll will inevitably rise. Initial estimates are that there are a further 36 people missing, including three tourists. The image below shows the aftermath of the flood:

http://www.myrepublica.com/portal/index.php?action=news_details&news_id=34672
The most informative reports to date are on the Republica and ekantipur websites.
This is an interesting event as the flood was clearly very large. In most cases in Nepal such extreme events occurring without rainfall are associated with either the collapse of a glacial lake dam (a so-called GLOF) or the collapse of a landslide dam. Pradeep Mool of ICIMOD, who has undertaken the definitive studies of GLOFs in the Himalayas, has noted here that the features of this flood suggest that it was not a GLOF, and indicates that a landslide was more likely. Incidentally, most international reports indicate that it may have been triggered by an avalanche, but this would be really quite unusual.
This post provides background information about losses from landslides in Nepal.
Update: The BBC has a video which appears to show a late stage (i.e. not the main) flood wave at the site, and the aftermath of the flood.
Thanks to Adrian Moon for his hard work on this story; to Tessa/Bobby Rogowski and Cathal Ferris for sending links; and to Ray Duray for highlighting the video.
4 May 2012
It might be best if you don’t play in the garden today, my son…
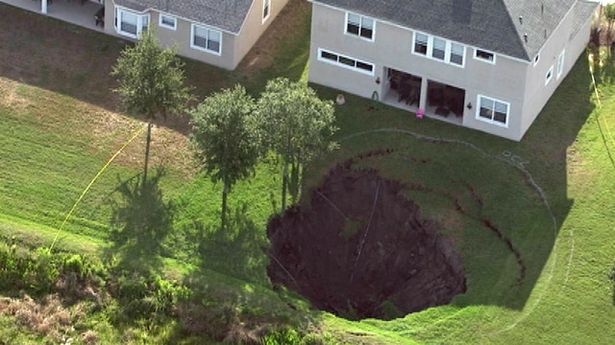
…courtesy of Business Insider and wftv.com, this sinkhole developed in Windermere, Florida over the last few days:
http://www.wftv.com/news/news/local/officials-large-sink-hole-continues-spread-winderm/nNQND/
One month from today…
…is the opening of the 11th International & 2nd North American Symposium on Landslides in Banff, Canada. I will be attending, and on the first day will be giving the opening keynote lecture on “Landslides and engineered slopes: Protecting society through improved understanding”. In preparation for that, over the next month I will feature data from the Durham Fatal Landslides Database, which is the underpinning dataset for that presentation, without of course using any of the actual graphics from my talk or paper (I wouldn’t want to spoil the surprise for those who will be there!).
So, to start, this graph shows the cumulative number of people killed by landslides from May 2003 to May 2012:
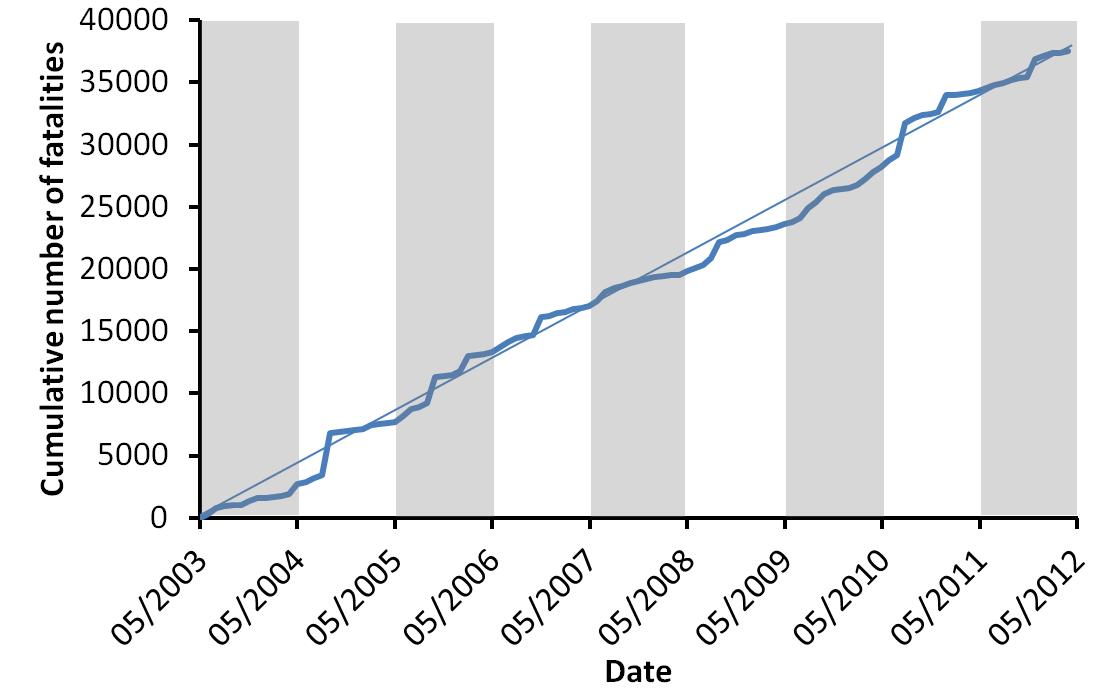
Whilst it might seem strange to work with an annual cycle from May to April, the northern hemisphere Spring is the low point in the annual cycle of global landslides, with numbers starting to increase in early May as the rainy season begins in Asia. The interesting thing about the above graph, apart from the obvious high numbers of total deaths, is the way that each year varies from the long-term trend (which is shown by the thinner blue line). At the moment it is not entirely clear as to what controls this variation – I will explore this in a post next week.
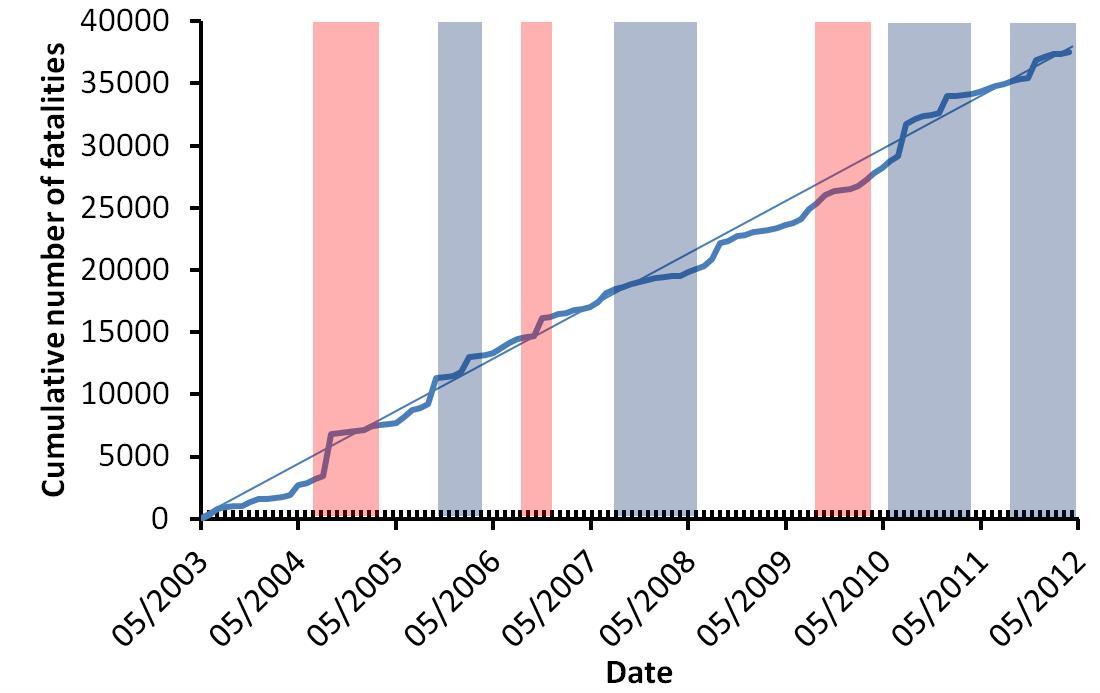
An interesting context to this dataset is the El Nino / La Nina cycle. It is generally thought that El Nino events change the distribution of landslides, and in particular induce an increase is landslides in some parts of the world. The graph below shows the same data, but this time with periods of a positive El Nino anomaly (i.e. when El Nino conditions are prevailing) in red and a negative El Nino anomaly in blue (data from the Climate Prediction Center). As expected, it is not the case that there is not a simple increase in landslide impacts in El Nino periods in El Nino conditions (real environmental datasets rarely show such simple relationships). The most striking thing is that the occurrence of El Nino conditions during this period has been so low – indeed neutral and La Nina conditions have dominated. It will be fascinating to see how this graph changes when we switch into a really strong El Nino event.
1 May 2012
Two railway landslides in the UK
The UK has just suffered from its wettest April in 90 years, with much of the rainfall falling in the last few days. The result has been a number of landslides around the country, including two on railway lines (see here for previous examples of landslides on railway lines):
1. Train derailed at the Clarborough Tunnel in Nottinghamshire
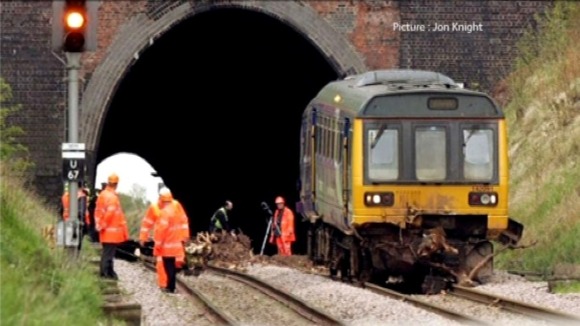
The more serious incident occurred at the entrance to the Clarborough Tunnel near to Retford in Nottinghamshire, when a train hit debris from a small landslide and was derailed (image from ITN News):
Network Rail (the track operator) tweeted an image of the landslide:
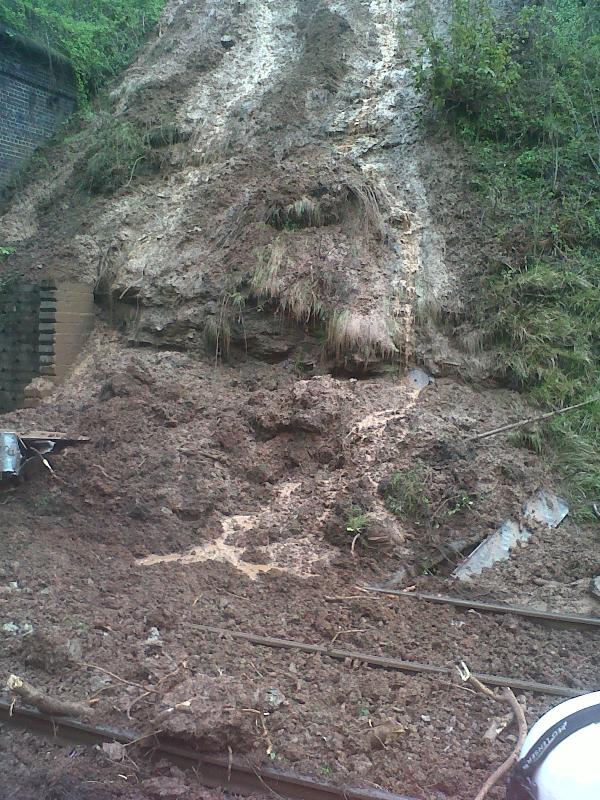
Two people suffered minor injuries in the derailment.
2. Landslide at Slochd in Scotland
Meanwhile on Thursday there was a landslide on the line between Inverness and Aviemore, again caused by heavy rainfall. On this occasion this slip was on a slope below the tracks. ScotRail, the track operator, tweeted an image of the landslide:
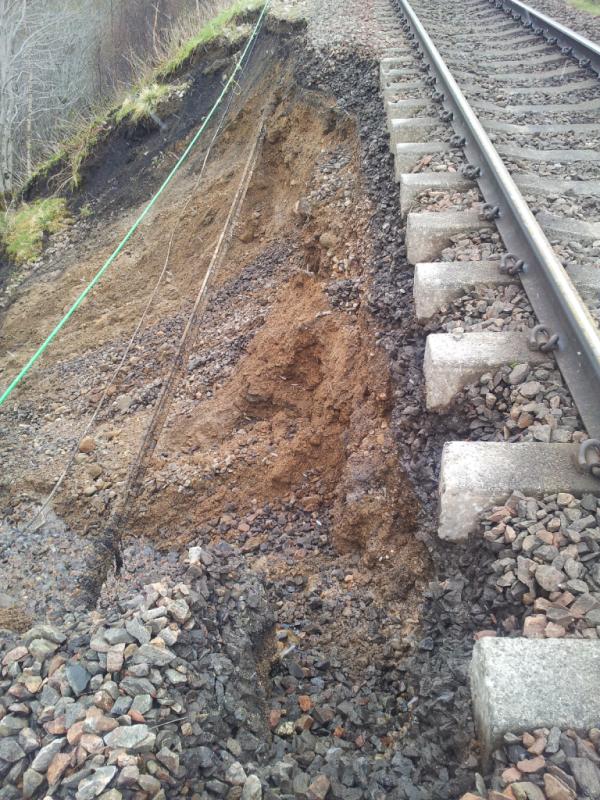
The line should reopen later today.
27 April 2012
Before and after – the Hattian landslide in Pakistan
I was looking at Google Earth imagery of the area affected by the 2005 Kashmir earthquake this week, and in particular focused in on the Hattian landslide. This was by far the largest landslide triggered by the earthquake in 2005. There is a detailed description of the landslide in a paper that we wrote for Engineering Geology, which can be downloaded here. This image, collected in September last year, shows the landslide scar and the deposit. Note that the main landslide lake breached in early 2010 – evidence of the higher water levels for ZalZal lake is clear upstream if the blockage:

An interesting comparison is the image from before the earthquake, in this case collected in 2002. Note that Google Earth retains the labels indicating the location of the two lakes, which in this case is quite useful for orientation:

The area that the landslide affected is clearly identifiable in this image, and the condition of the topography appears quite deformed. In particular, the streams are deeply incised in comparison with the adjacent areas. Of course this then asks the question as to whether this site could have been identified as a potential landslide before the earthquake from visual inspection alone. In fact I suspect that this would have been difficult, but I am interested hear the opinions of others.
Dunning et al paper on Hattian landslide
25 April 2012
Increasing landslide hazards and the Three Gorges Dam
A couple of weeks ago I posted several images from my recent visit to China Three Gorges University, and in particular on landslides on the banks of the reservoir associated with the Three Gorges Dam. Interestingly, last week, whilst I was on vacation, a number of news agencies ran a story about landslide hazards in this area. The spur appears to have been an interview on China National Radio with an official, Liu Yuan, from the Ministry of Land Resources . According to the CRI English report, Liu Yuan indicated that up to 100,000 people living on the banks of the reservoir will need to be relocated over the next three to five years as a result of landslides and bank collapses. The news report notes that he stated that:
“The prospect of controlling or preventing geological disasters in the near future was not promising”
Perhaps most interesting is that Liu Yuan stated that (in the words of the report):
“After the water levels were raised, there were 70 percent more landslides and bank collapses in the area than had been predicted…[and]… an increasing number of monitoring sites were seeing adverse effects from the maximum water level.
Liu indicated that management of rockfalls and landslides is needed at 335 sites, and that there is a need to monitor 5,386 dangerous locations.
Landslides were identified as being a major hazard of the Three Gorges project more than a decade ago, and several years ago I wrote that although a Vaiont style event was unlikely, landslides would probably be a major problem. To give an indication of the concerns, the image below is the Qianjinangping landslide, which I visited on my recent trip. It occurred as the water level was being raised in July 2003. The landslide killed 24 people, destroyed 346 houses and caused the loss of four factories.
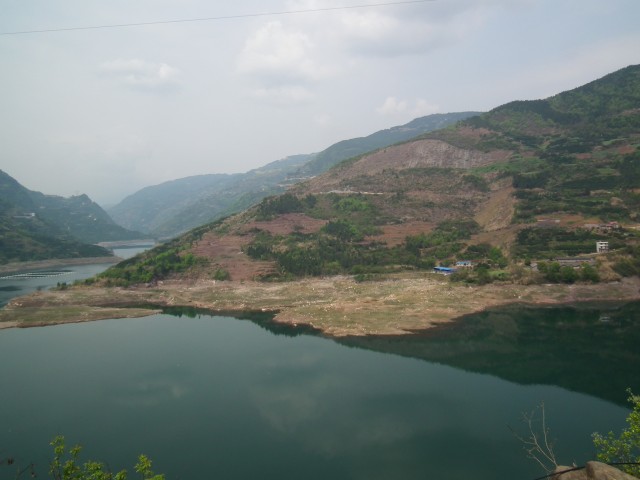
Interestingly, the loss of life consisted of 13 people on the slope and 11 fishermen, who were hit by the displacement wave. This is believed to have been up to 30 m high.
 Dave Petley is the Vice-Chancellor of the University of Hull in the United Kingdom. His blog provides commentary and analysis of landslide events occurring worldwide, including the landslides themselves, latest research, and conferences and meetings.
Recent Comments