

29 October 2013
More photographs of the aftermath of the Kedarnath debris flow disaster
Last week I posted one of the images kindly provided by Vaibhav Kaul of the aftermath of the Kedarnath disaster. These were taken on a recent visit by Vaibhav to the area, on foot of course – a truly epic journey. He has kindly allowed me to post more of them here. For reference, it is worth looking at the earlier post in which I reconstructed the events of that day in June, and the one in which I blended eye-witness reports with an overall narrative.
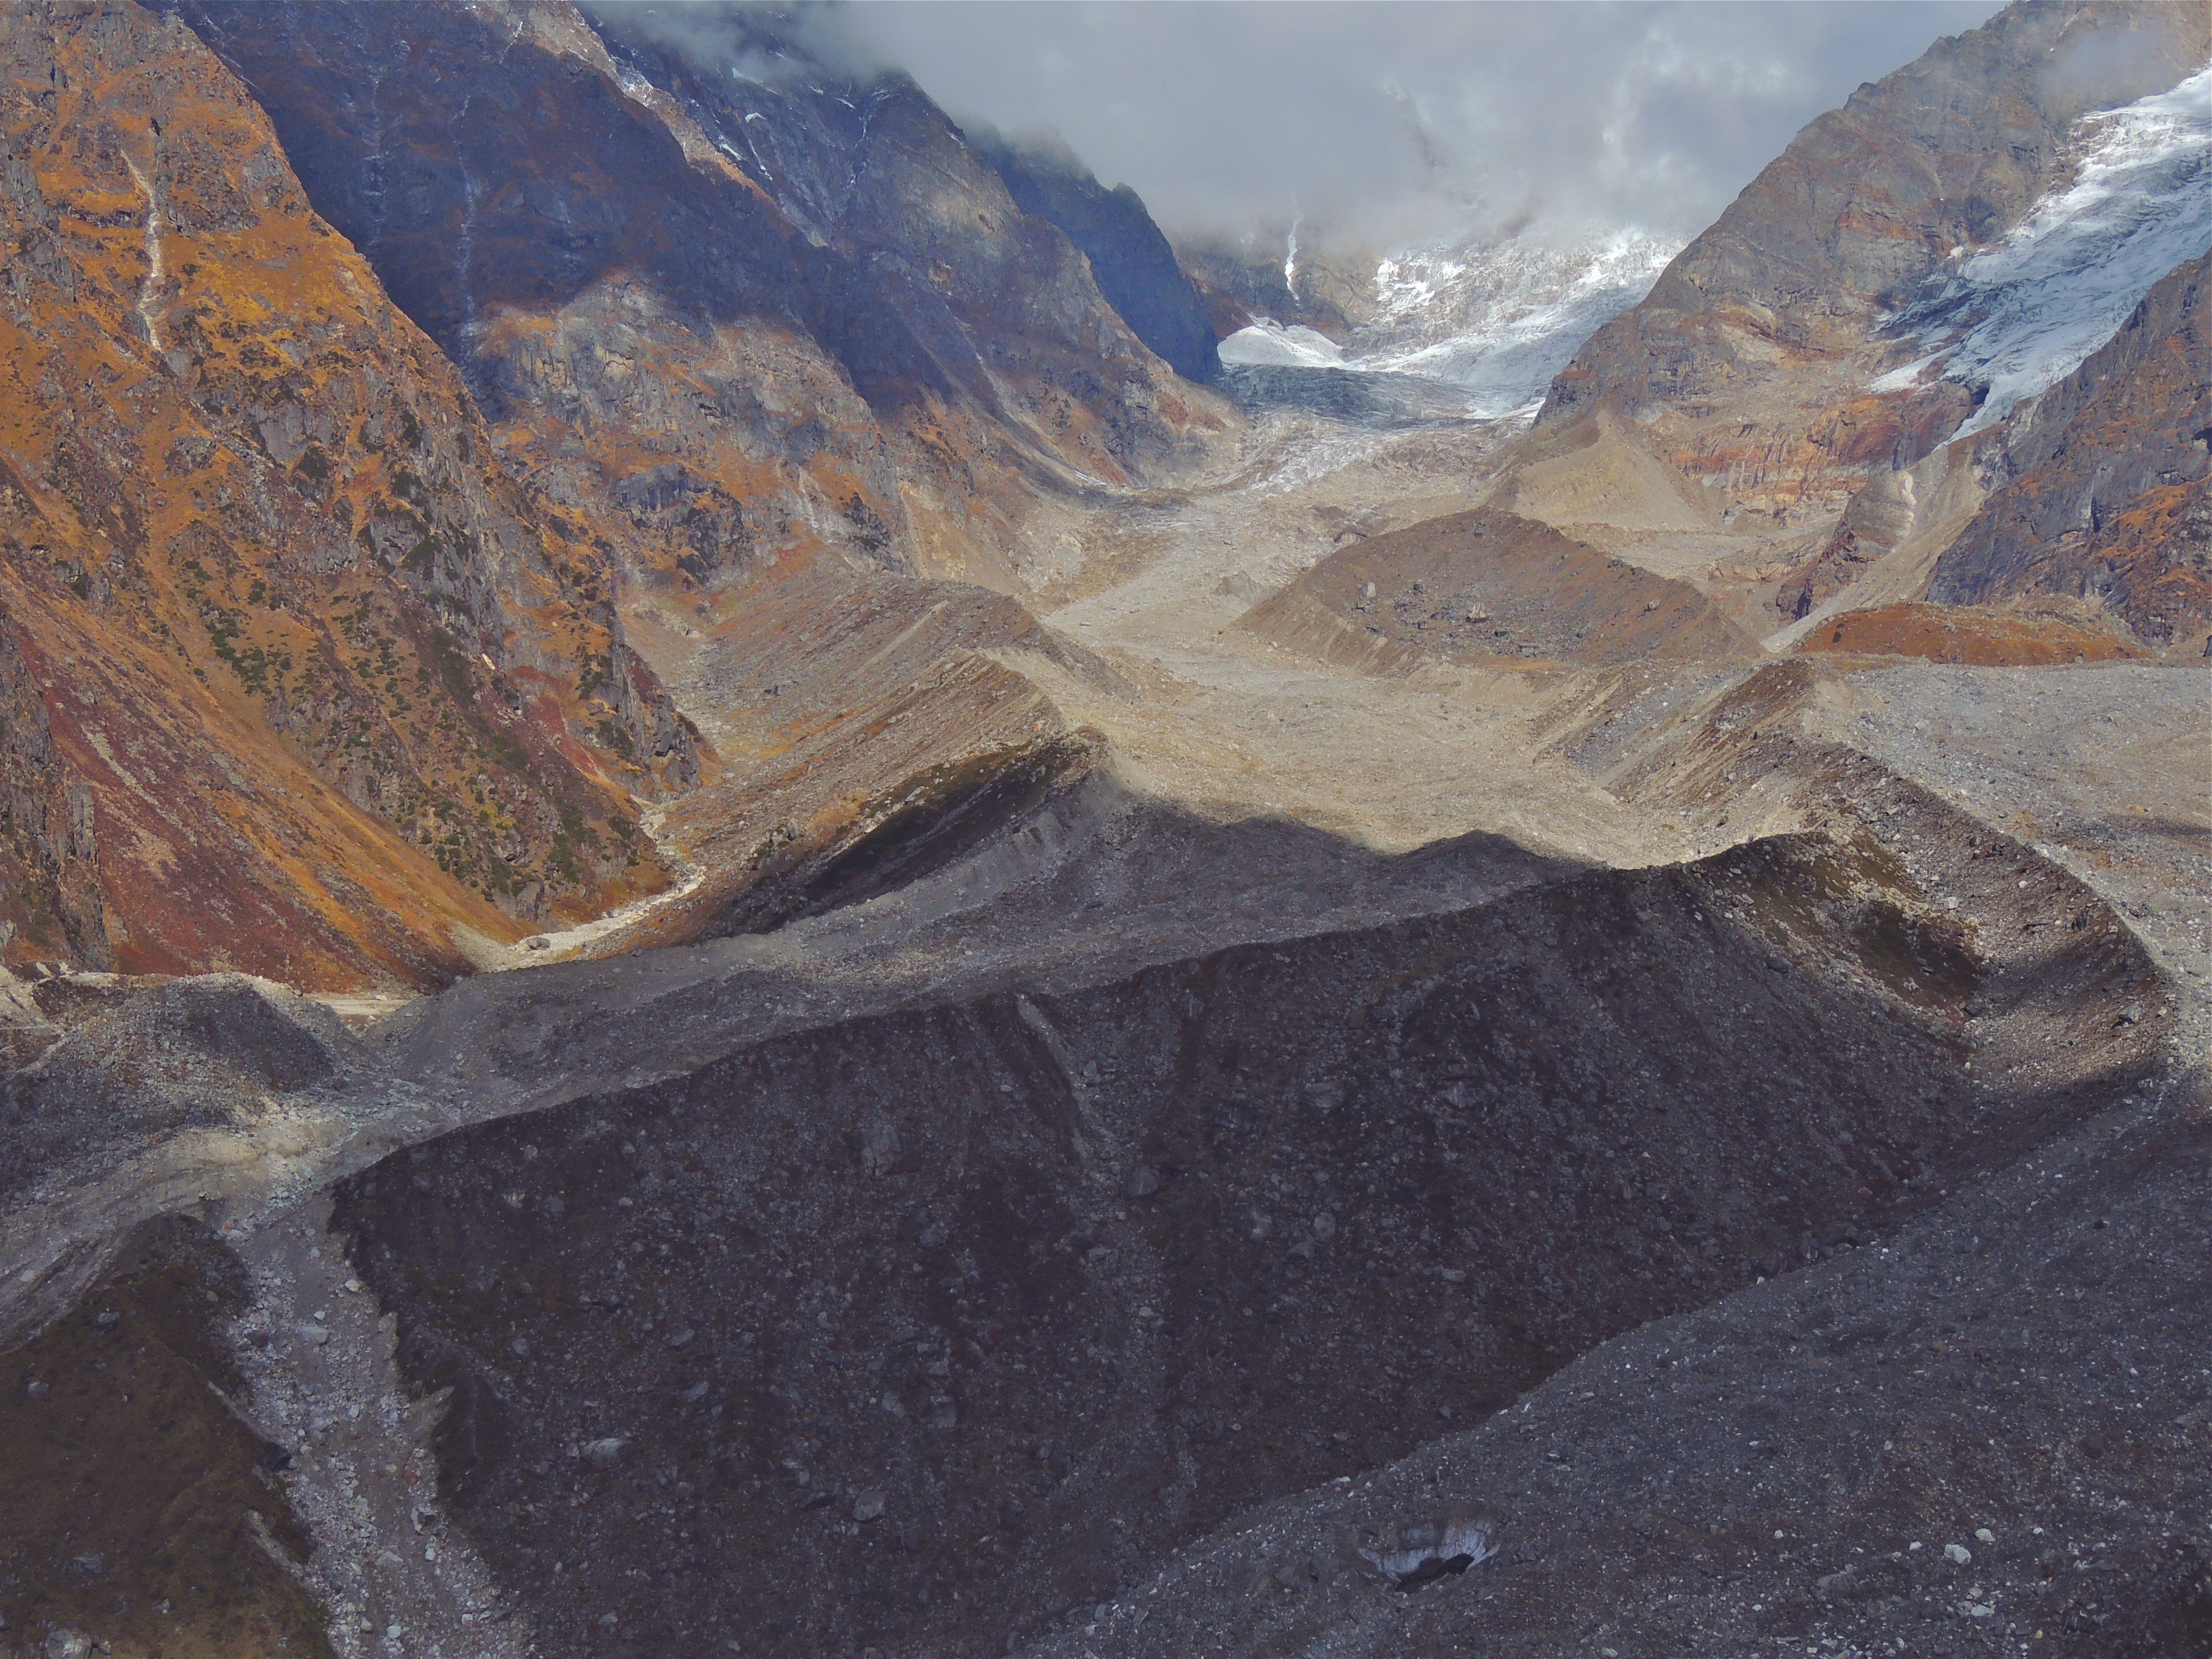
The Chorabari Glacier source of the second debris flow
The source of the second, more damaging debris flow, was a breach in the glacial moraine that formed a dam to create a temporary lake, known as Chorabari Tal (Gandhi
Sarovar), on the flank of the glacier. This image shows one of the two tongues of the glacier. The valley on the left side of the image on the flank of the glacier is that of Chorabari Tal (Gandhi Sarovar). The breach is clearly visible, as is the path that the water followed:
Courtesy and copyright of Vaibhav Kaul
..
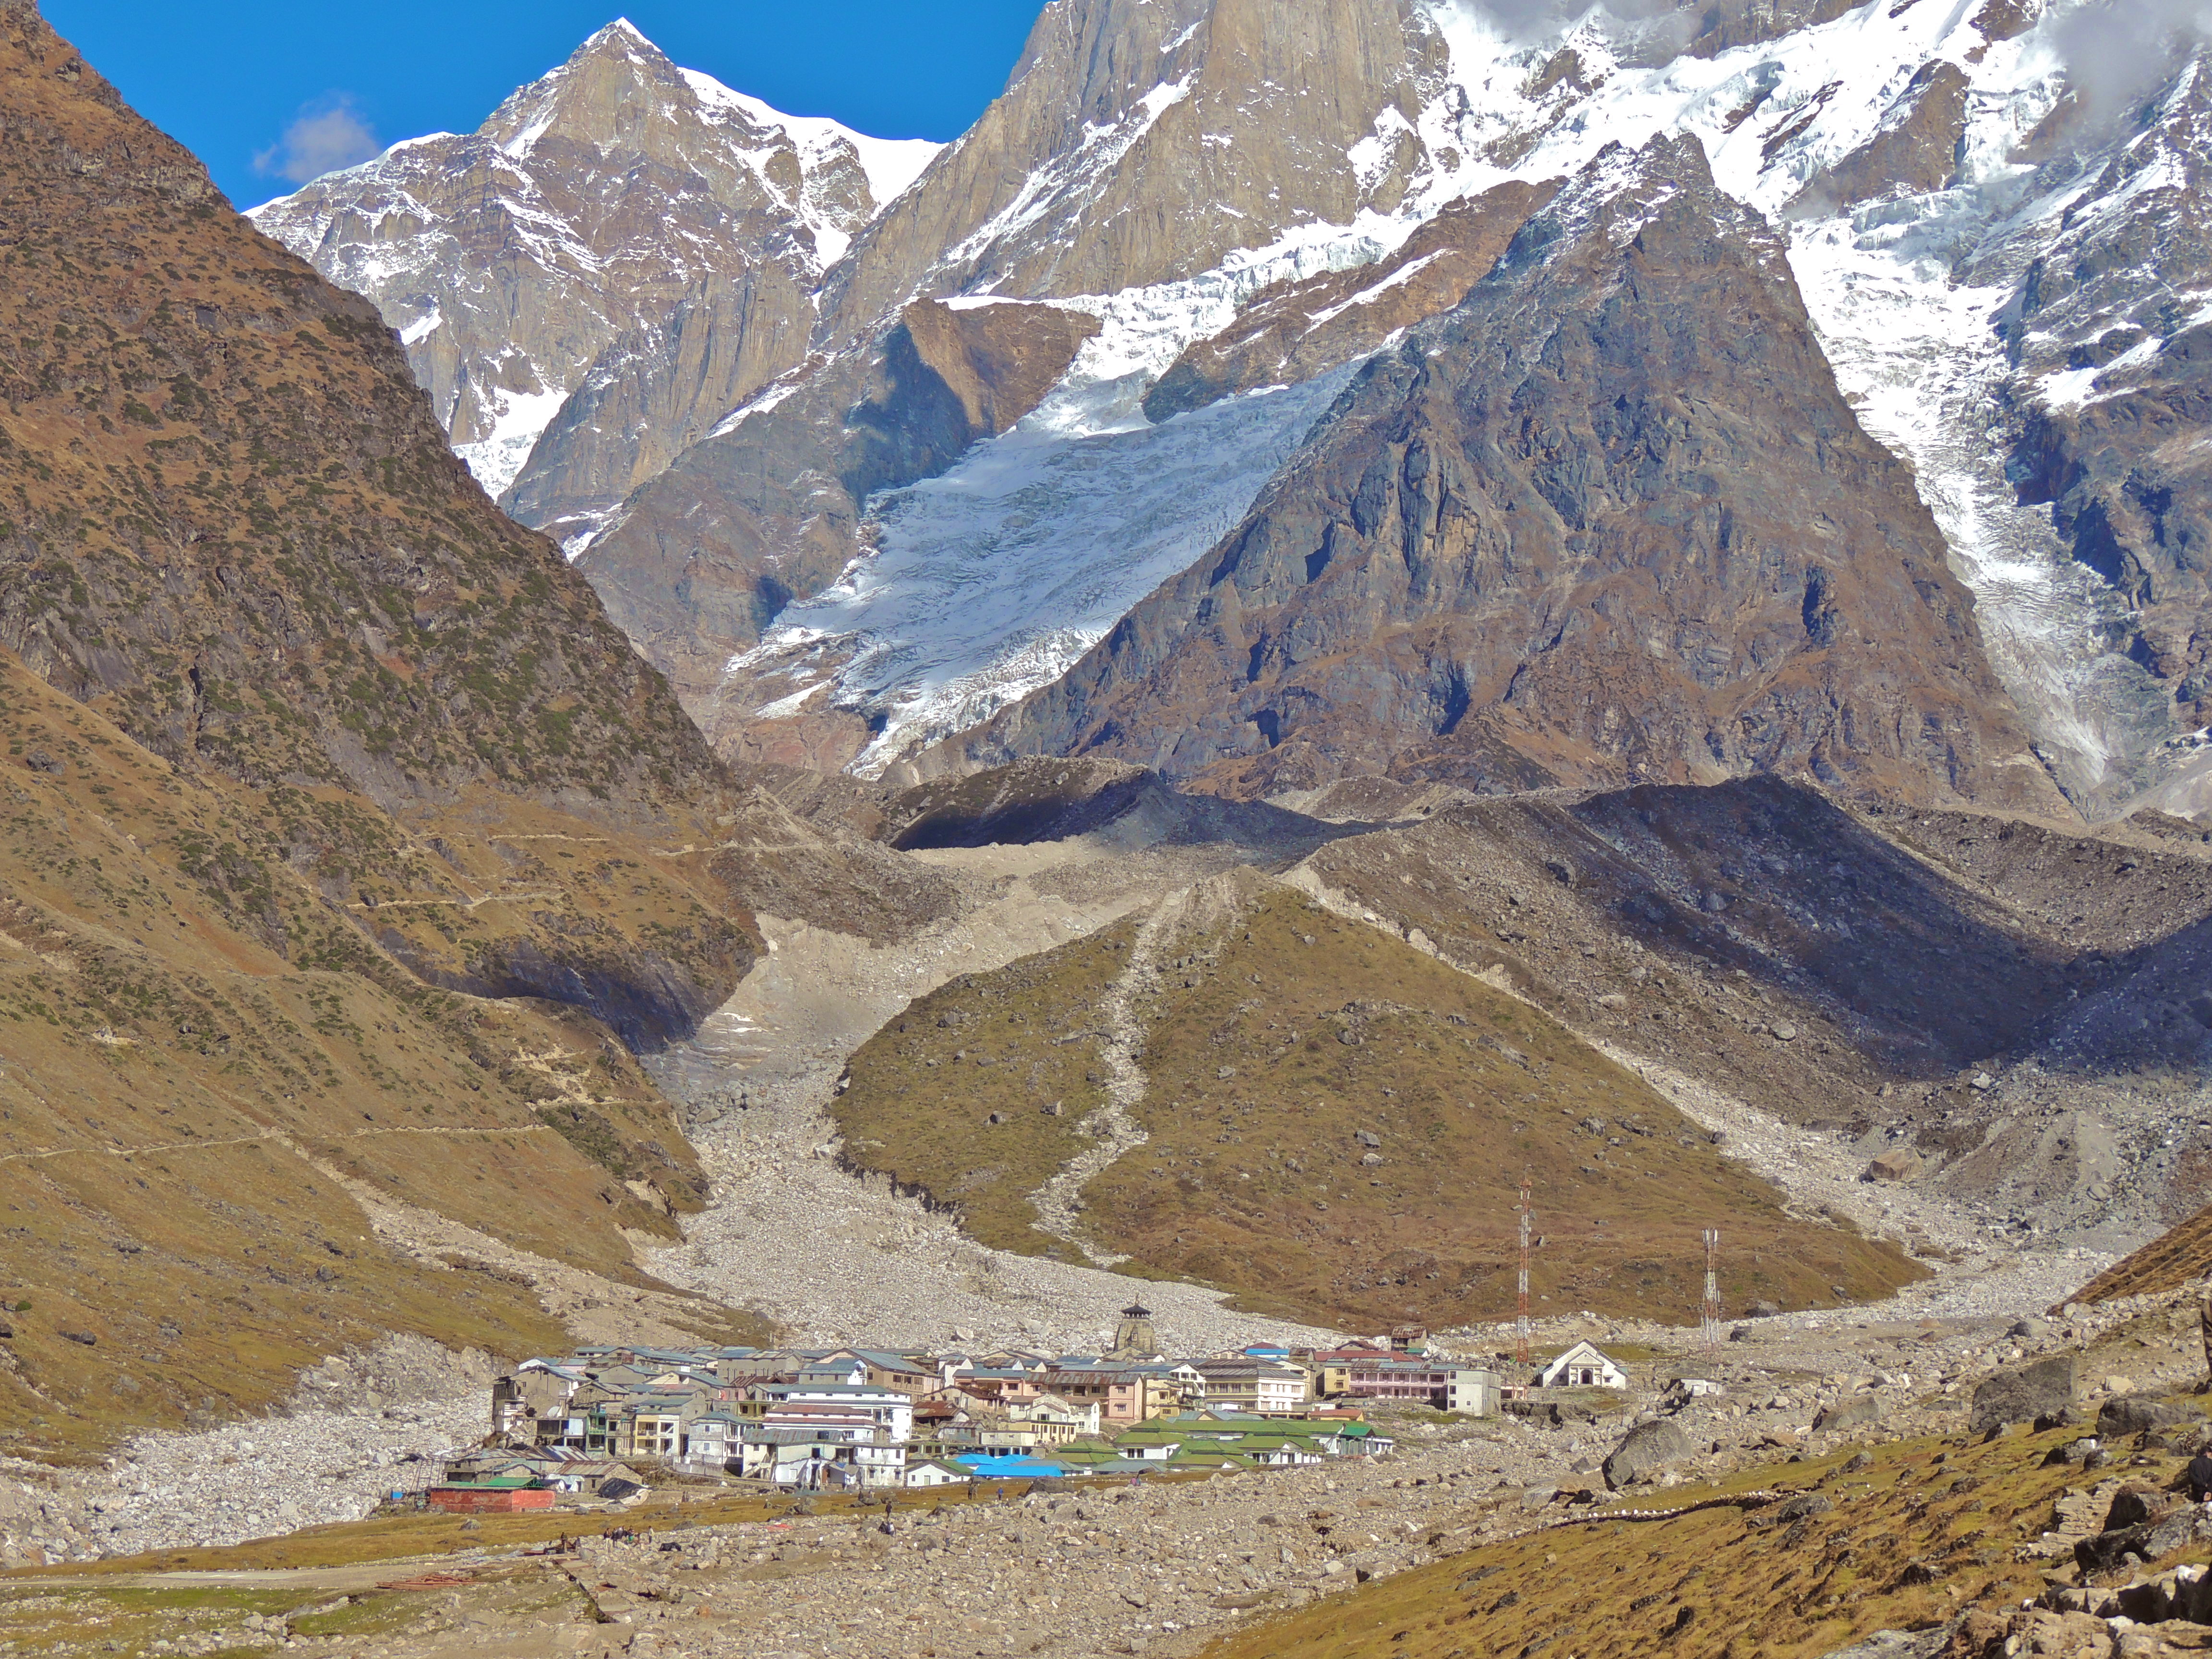
The track of the second debris flow
Viewed from below the town, the track of the main debris flow down the slope above the town is very clear. Most of the water and debris flowed down the left side of the image, a smaller component over-spilled the ridge to flow down towards the right side. The flows recombined above the town:
Courtesy and copyright of Vaibhav Kaul
..
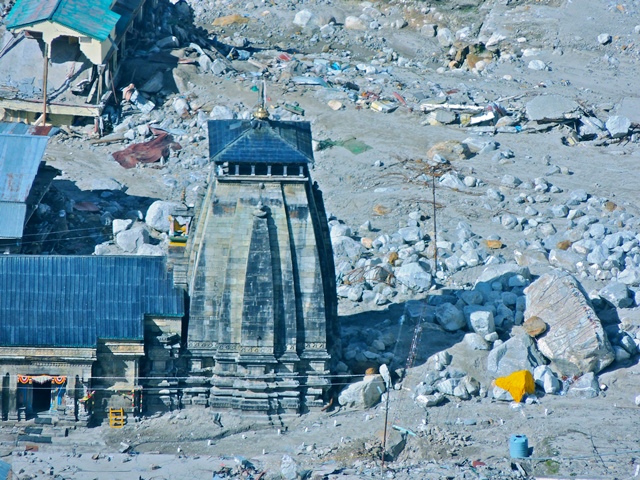
The impact on the town
The debris flow then struck the town with devastating consequences. At the upslope end of the town was located the temple, which escaped with comparatively minor damage. This is probably due to a combination of an extremely robust structure and, possibly, the protective effects of a boulder immediately upstream of the main building:
Courtesy and copyright of Vaibhav Kaul
..
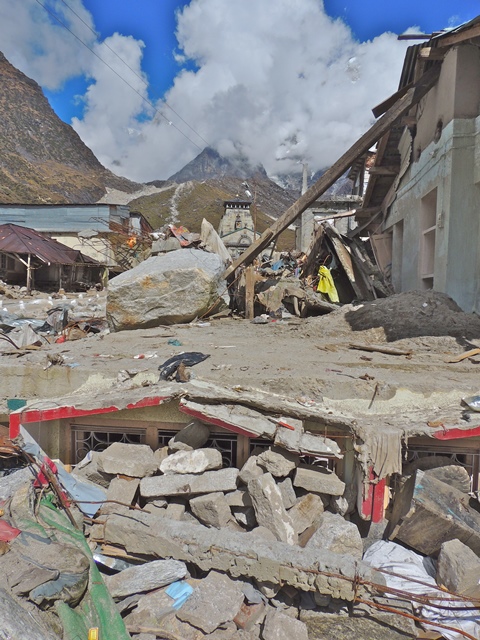
Downstream the buildings were far less fortunate:
Courtesy and copyright of Vaibhav Kaul
…
Effects below Kedarnath
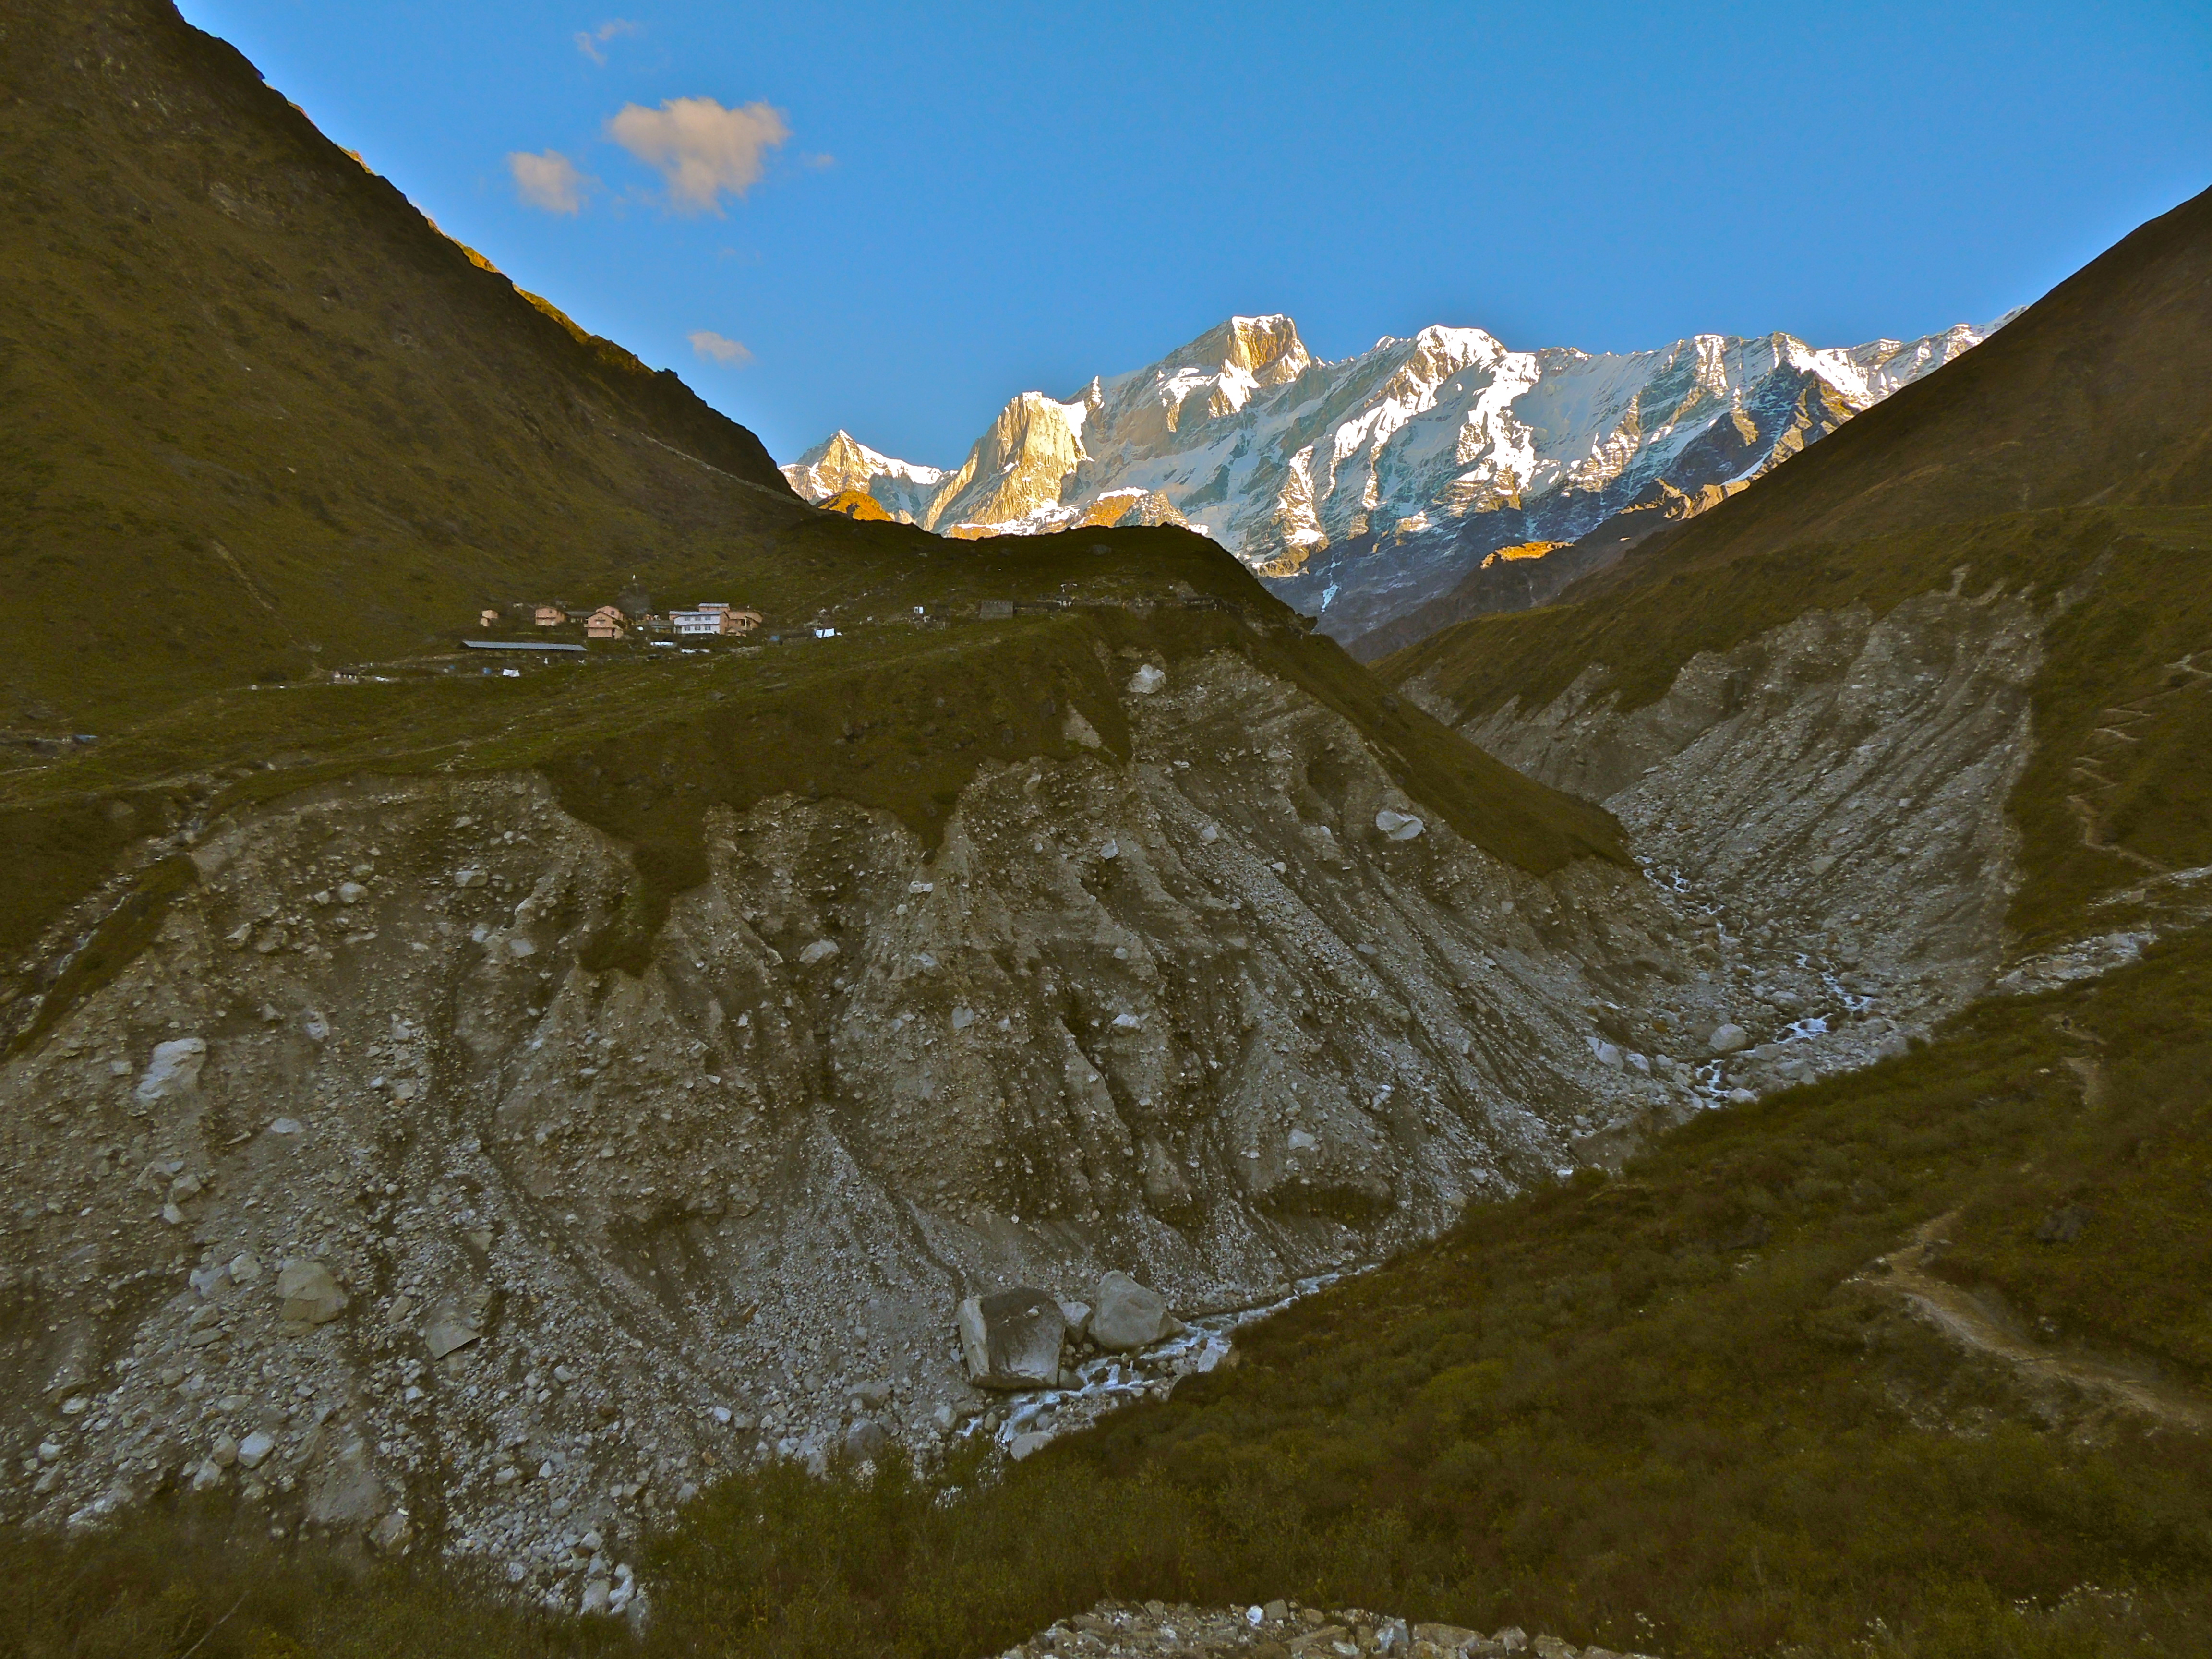
The debris flow then passed down through the valley below the town, where the effects of the debris flow were devastating. This is the channel upstream of the small village of Rambara – note the slope failures on the flanks of the channel triggered by undercutting by the main flow:
Courtesy and copyright of Vaibhav Kaul
..
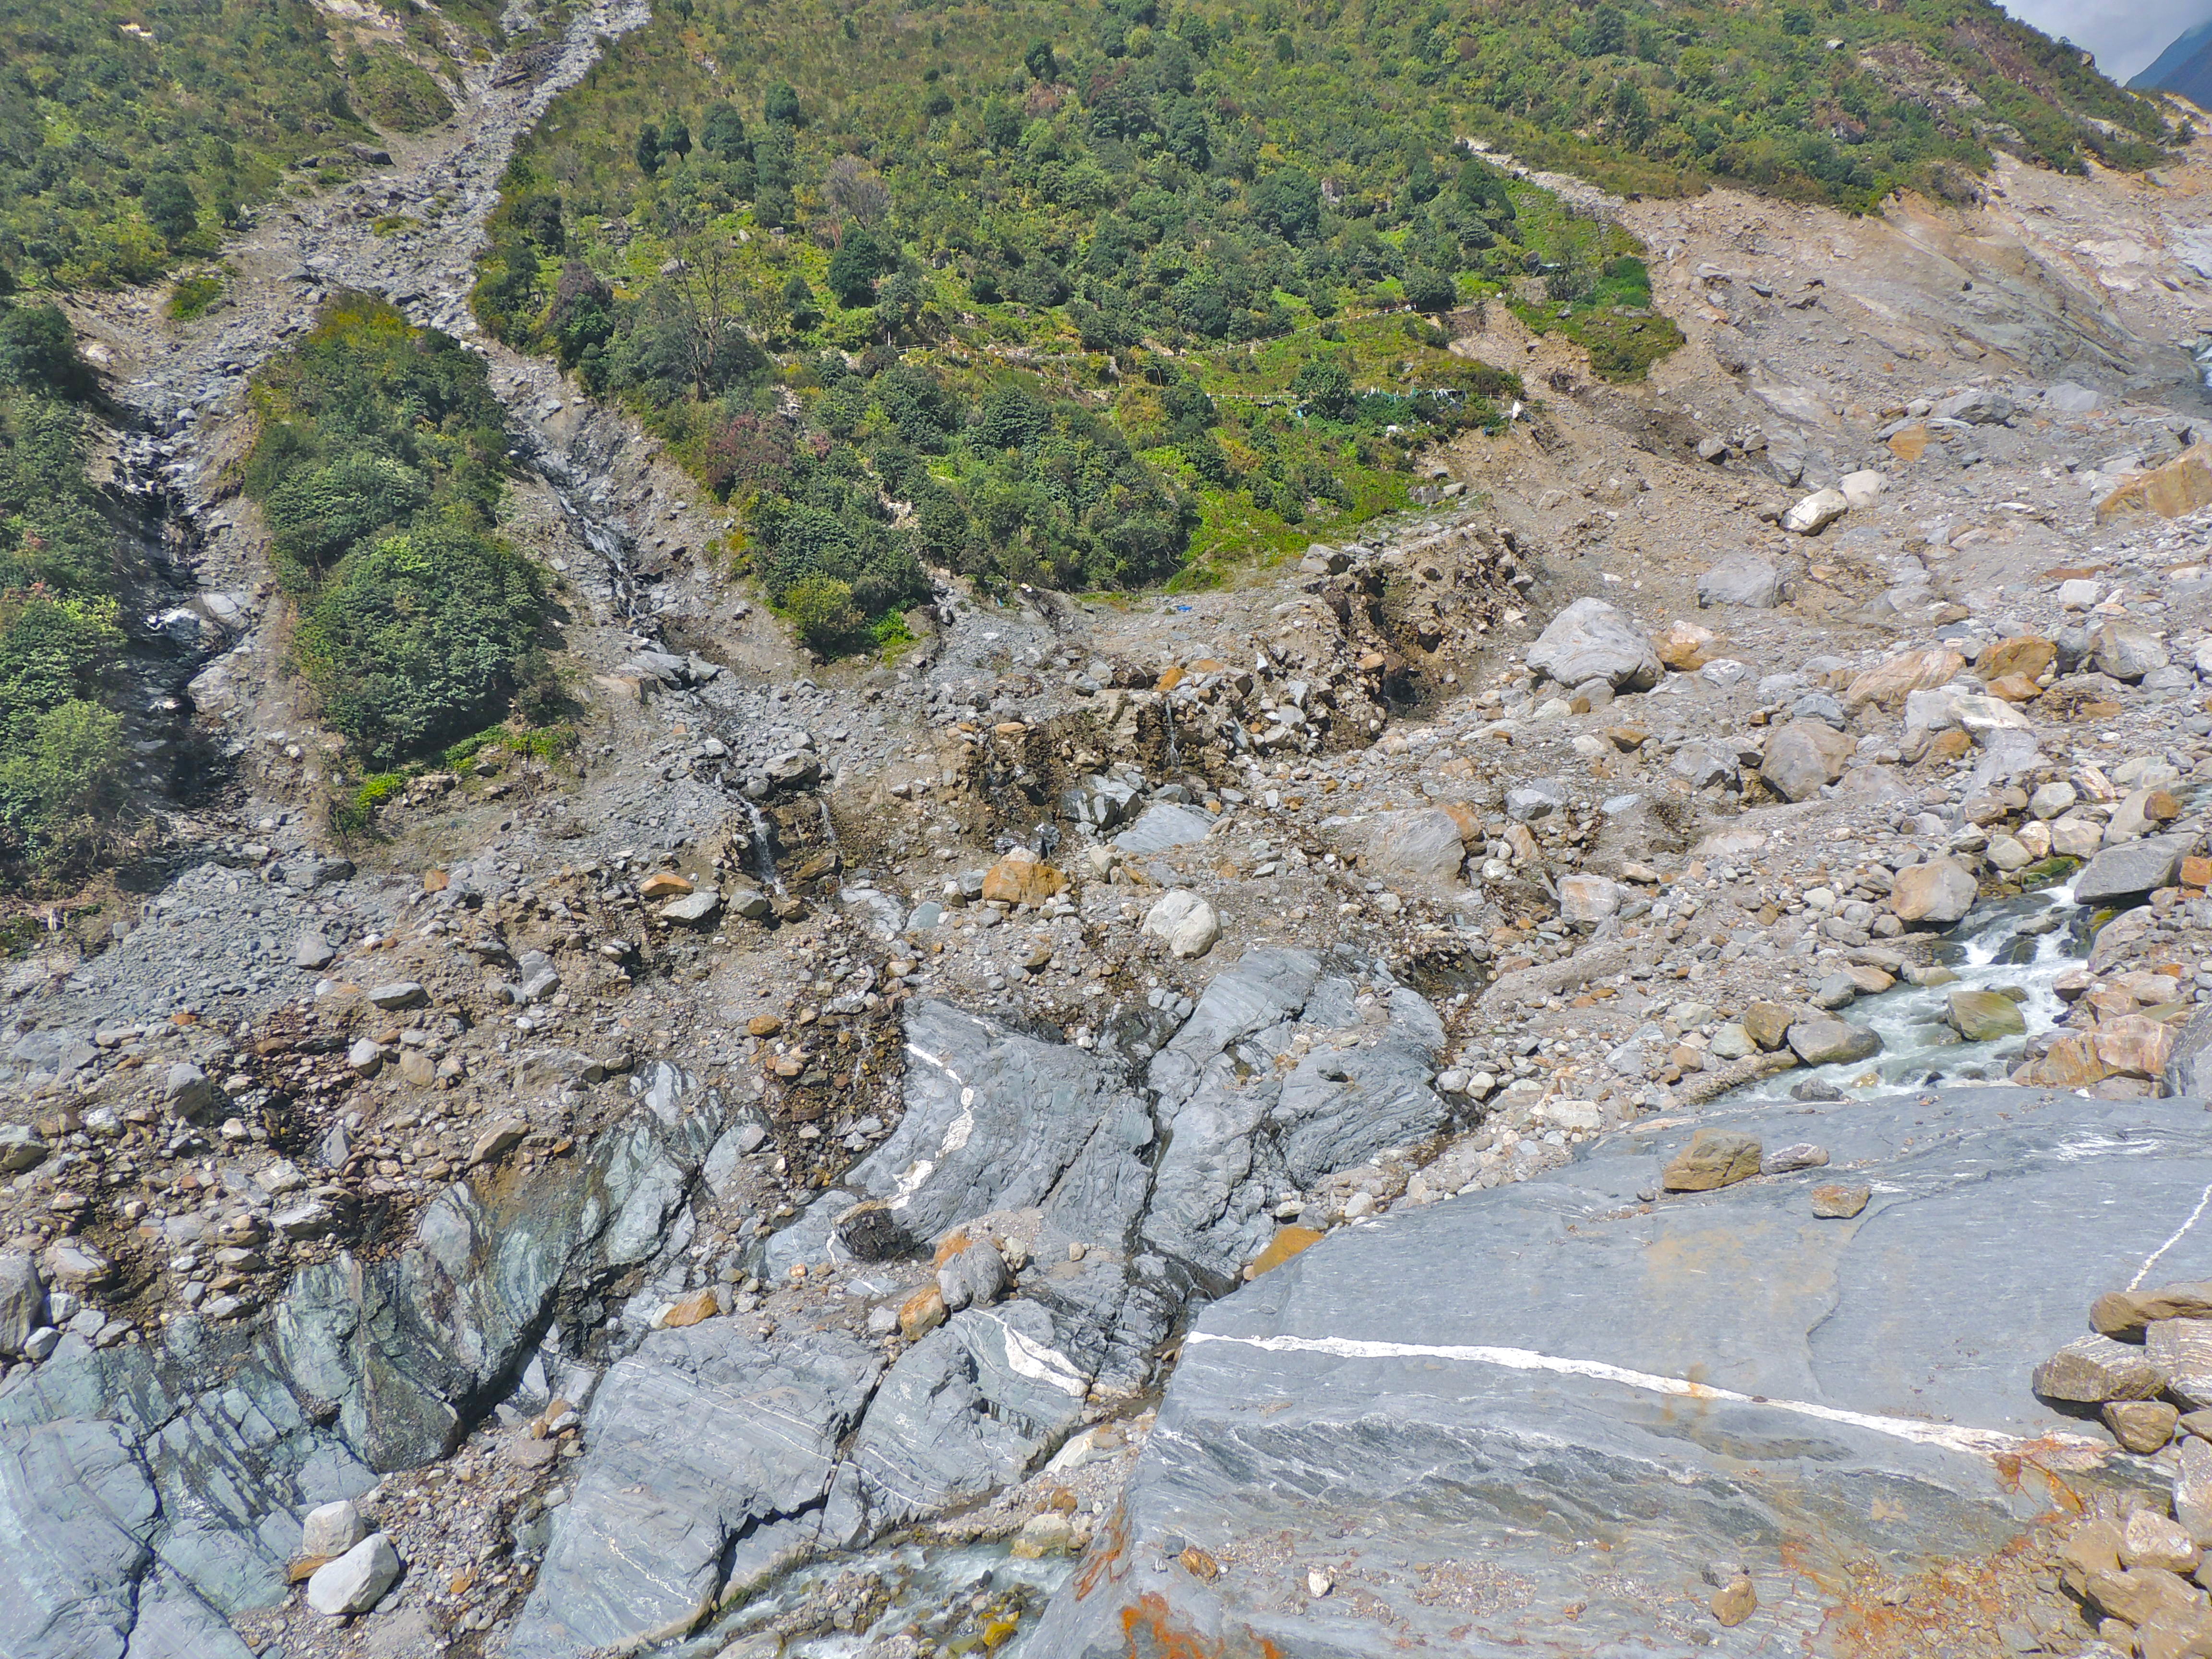
Rambara destroyed
The most shocking impact of this disaster is the effect on Rambara. This is Rambara before the debris flow (source):

Source: http://www.sacredyatra.com/kedarnath-pictures.html
..
This is the site of the village now:
Courtesy and copyright of Vaibhav Kaul
28 October 2013
A very interesting video of a house being slowly destroyed by a landslide in Thailand
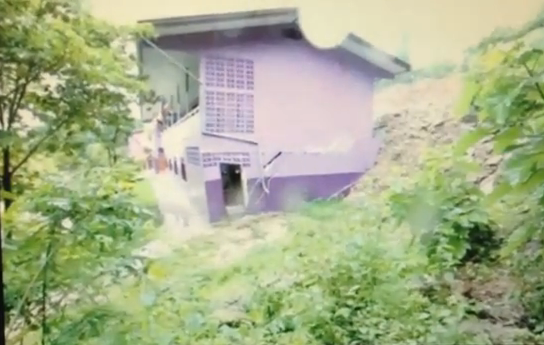
One of the ways that landslides destroy buildings is by forcing a collapse due to progressive loading of the structure. This is a very interesting process that is perhaps surprisingly poorly studied. So, a new video that has appeared on Youtube is very welcome. There is very little information on the website about this event other than that it occurred in Thailand. The landslide appears to be a large earthflow. The relentless way in which the landslide loads the building is quite interesting.
http://www.youtube.com/watch?v=J8O1KVA_lrk
At the start, the building is clearly being loaded at the rear, and the top portion is starting to shear:
..
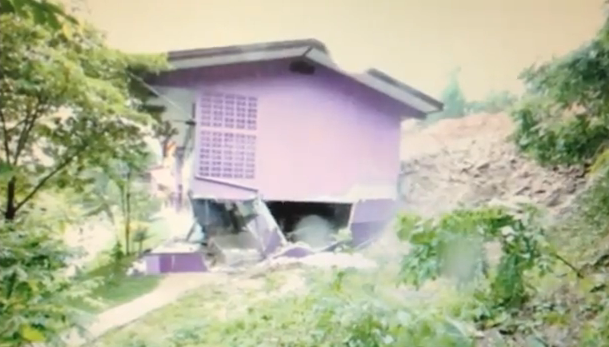
By the time the house starts to topple, the upper portion of the building has been pushed forward a significant distance, leading to failure of the columns at the front of the building, which then topples forward:
..
Failure of the near end of the building causes the entire structure to progressively collapse.
26 October 2013
A remarkable photo of Kedarnath after the debris flow disaster
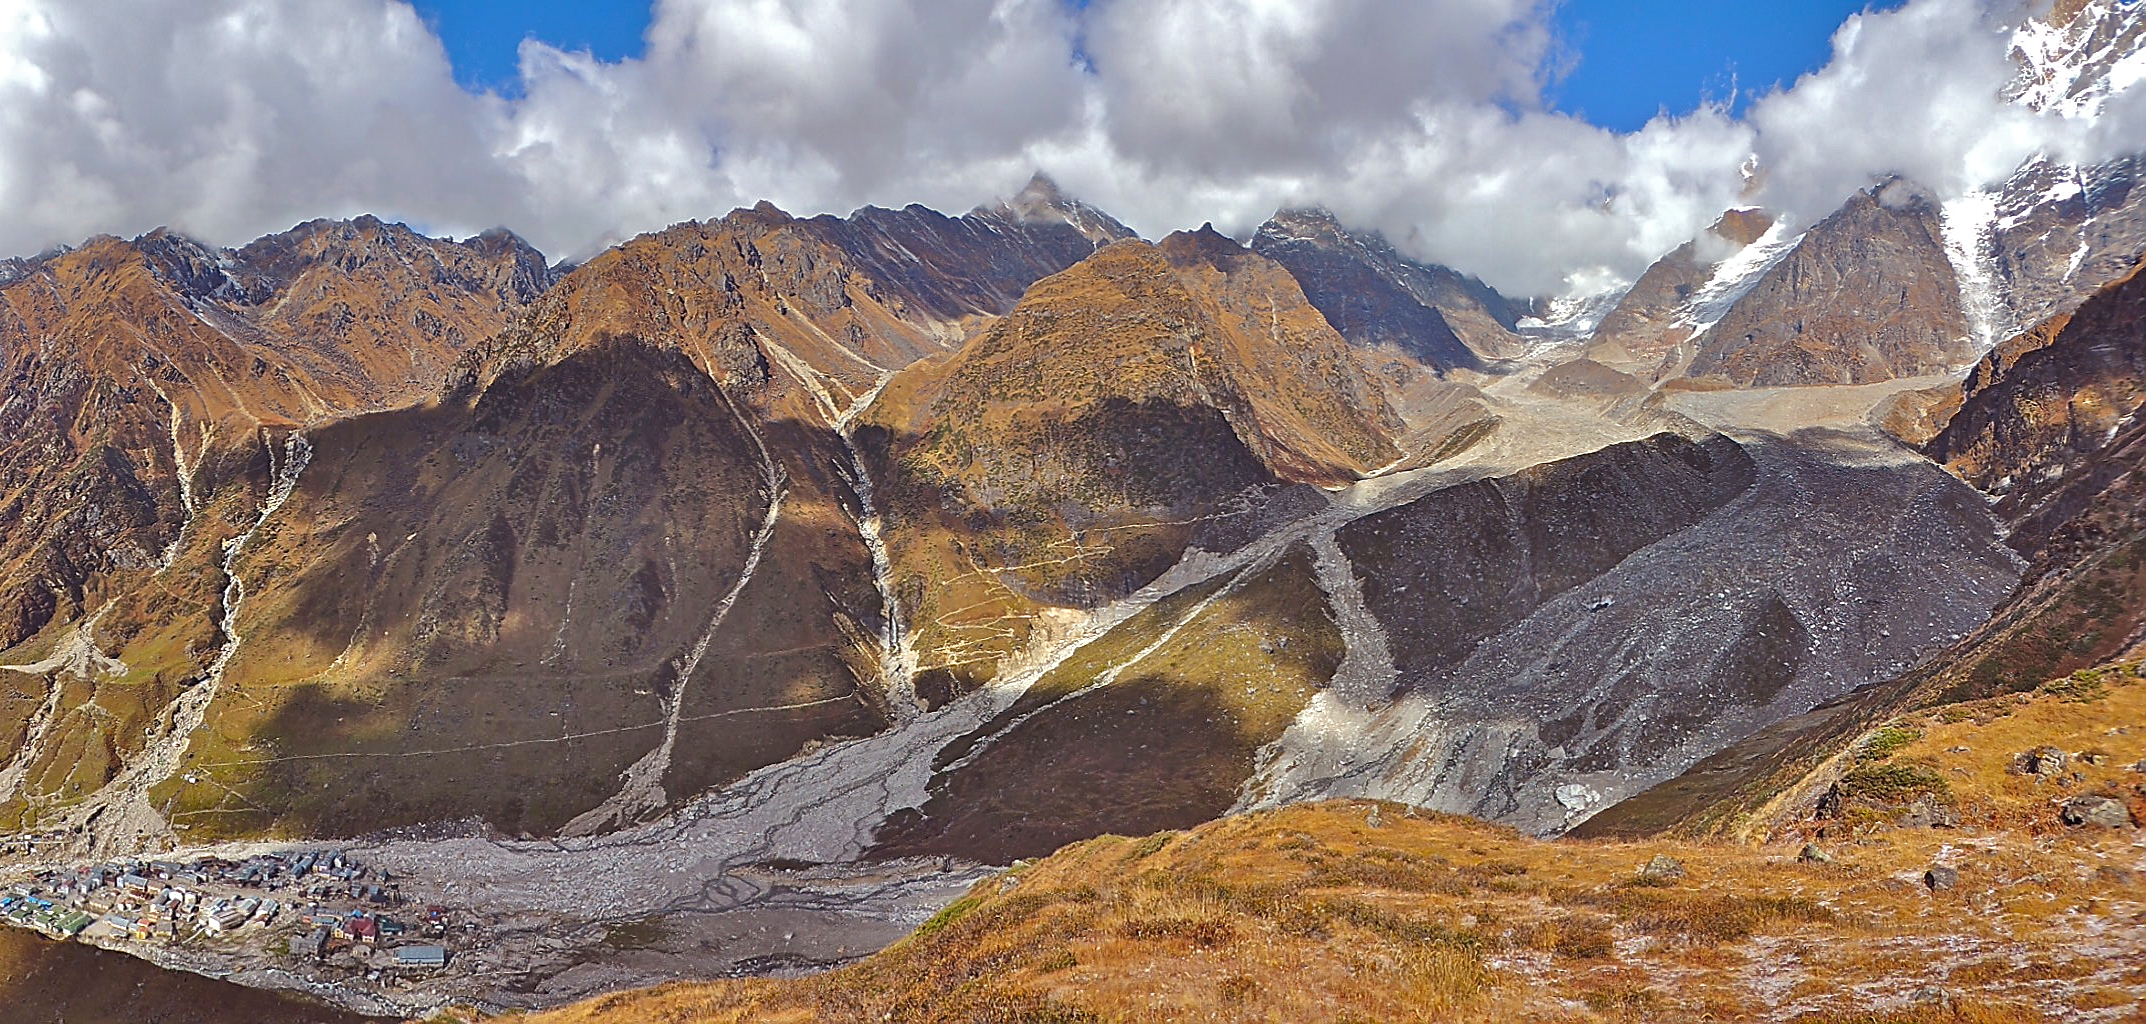
The Kedarnath disaster in Uttarakhand, India in June remains the worst landslide accident of 2013 to date. As a taster for a fuller post next week, Vaibhav Kaul has made the following photograph available to me. He recently trekked up to the site and collected a set of images, of which this is one. It is posted here with his agreement:
Courtesy and copyright of Vaibhav Kaul
..
The image shows Kedarnath town in the bottom left corner. To understand the processes,please refer to my earlier post reconstructing the accident. On the slopes above are the smaller debris flows triggered by the rainfall event in June – these were not responsible for the losses. Upstream of the town to the right are the two debris flow tracks – the left hand one,which originated from the glacial lake overflow event, split into two components (clearly visible on the photograph). On the right side of the image lie the two debris covered strands of the Charobari glacier; the other (first) debris flow came from a slope failure that is out of site of this image and then flowed down the right hand lateral margin of the glacier before striking the town. This track is just visible towards the right of the image and then above the town.
25 October 2013
Review of a paper: A risk society? Environmental hazards, risk and resilience in the later Middle Ages in Europe
 Background
The management of natural hazards is a major activity in modern society, although often it occurs in a way that is not particularly obvious. Thus, for example, major road projects in upland areas generally include substantial investment in slope stability measures to prevent landslides and rockfalls from endangering road users – in many cases these can form a large part of the project budget. Of course there are more obvious approaches too – in the news at the moment is both the apparent failure of local government officials in Japan to make people aware of the hazard posed by landslides as typhoon Wipha bore down on Japan last week, with tragic consequences, and the resulting high-profile evacuations today as Typhoon Francisco threatens to bring rain to the same area. Recently, an colleague in the Archaeology department here at Durham, Chris Gerrard, and I were mulling over whether people in the past took the same general approaches to managing hazards as we do today. If they did, how sophisticated were those approaches, and how successful were they?
That conversation led to a research paper that was recently published the in journal Natural Hazards. The paper has been published in full Open Access form, so you can download the paper as a PDF or view it on the screen. In the paper we focused on the Middle Ages – which we defined as the period 1000-1500 AD – in Europe. This was a period of great change in Europe as modern societies started to emerge. It was also a period of great upheaval, not least because of the effects of repeated epidemics that devastated large swathes of Europe, of which the Black Death in 1348-50 was the worst – it is estimated that over 30% of the population of Europe lost their lives. In this context, it might be thought that managing environmental hazards was almost insignificant. That was most definitely not the case.
A risk society?
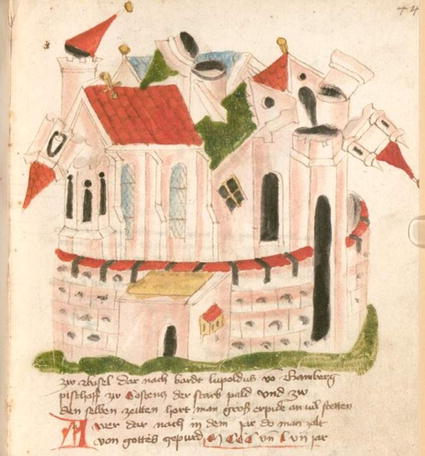
In the paper we have tried to demonstrate first that Europe was, perhaps unsurprisingly, affected by a wide range of disasters in this period, including major earthquakes, wind storms, floods, volcanic eruptions, landslides, tsunamis and famines. The illustration below, from the Konstanzer Weltchronik, a fourteenth-century ‘world chronicle’ produced at Konstanzer in Germany, shows the effects of the Basel earthquake in 1356:
 ..
..
In the paper we tried to estimate the costs of these disasters – this is a topic upon which we are now working, but a reasonable estimate seems to be in the range of 250,000 to half a million people over 500 years. This might seem low, but remember that the population of Europe at this time was just 39 to 70 million people.
It might be tempting to think that the standard response to such disasters in the Middle Ages was through religion – after all, even now we sometimes term these disasters “Acts of God”. It is true that that religion played a major role in creating a framework for understanding these events. Populations prayed that disasters would not occur, and that they would recover quickly when they happened, and religious leaders used events to encourage the population to higher levels of devotion. However, alongside this was a rapidly developing attempt to provide rational explanations for hazardous events – for example Hegenburg wrote in the 14th Century that:
Earthquakes arise from the fact that in subterranean caverns and especially those within hollow mountains, earthly vapours collect and sometimes these gather in such enormous volumes that the caverns can no longer contain them. They batter the walls of the caven in which they are and force their way into another and still another cavern until they fill every space in the mountain…If they cannot reach the surface they give rise to great earthquakes.
As an aside this is strangely similar to the utterly bizarre, and bogus, explosive gas theory for the generation of the Wenchuan earthquake (see this pdf for example).
Alongside this increasingly rational explanation for hazardous events was a surprisingly sophisticated system for managing risk. In the European Middle Ages, hazard mitigation was commonplace, with Italy very much leading way. For example after Florence flooded in 1333 the city authorities formed a committee to manage the repairs, they provided tax relief to victims (especially on food) and they organised the distribution of food. In modern soceties we share the costs of disasters through risk sharing – this is essentially the role of the insurance industry for example – and societies in the Middle Ages did likewise, especially in cities, through for example the organisation of fraternities and religious guilds that offered help in-kind, loans and/or stipends. Charitable giving was also common at all levels of society, and many societies also tried to spread the costs of disasters over time by storing a proportion of the harvest on a large-scale.
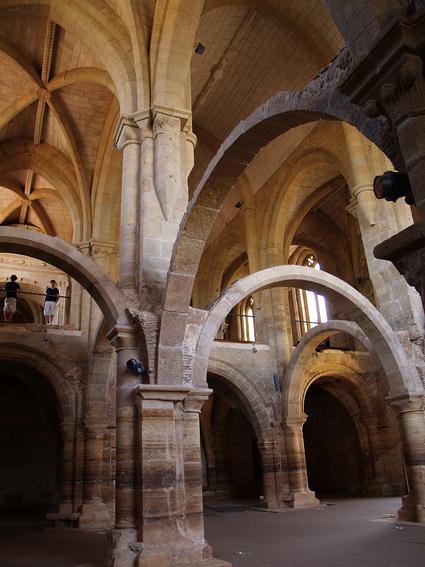
Sitting alongside these societal responses were structural measures to prevent hazard impacts. The image below, from the paper, shows the interior of the onastic church at Clara-a-Velha in Coimbra (Portugal). To escape the floods from the nearby River Mondego, the nuns initially raised the floor of the church. When this was unsuccessful they extended the church upwards – the people in the photo are on the partially reconstructed upper storey. Note the staining from the floods on the supporting columns:
Picture courtesy of Alejandra Gutiérrez
..
In the town of Kootwijk in the Netherlands) the villagers fought against drifting sand, which smothered their fields, by erecting screens over 100 m) long. Eventually they appear to have given up the fight and relocated inland.
In modern society we also use hazard adaptation as a key mechanism for managing risk – thus for example we enforce building codes in seismically-active areas to try to reduce the likelihood that buildings will collapse. Hazard adaptation was surprisingly prevalent in the Middle Ages too, with the authorities imposing requirements on for example building quality to try to reduce losses. After parts of the city of Pisa were by fire in 1158, the civic authorities tried to reduce the risk of a repeat by demolishing wooden porches and balconies, whilst elsewhere thatched roofs were replaced with tiles. Inevitably, some disasters drove the relocation of people, but the archaeological evidence suggests that this was perhaps less common than might be expected – generally people “built back” in the same location.
So, in the paper we concluded that modern rsik management for natural hazards has its origin in historic practices, and indeed that essentially almost all of the techniques we use today were widespread at that time. There is no doubt that modern approaches are more complex and are based on a better understanding of both the hazard processes and the ways in which their effects can be reduced, but societies in the Middle Ages were also remarkably sophisticated and organised. As we say in the paper, “faith was no barrier to mitigation, and although medieval society may not have been the best protected against environmental hazards or the best resourced or claim a complete understanding of the risks it faced, it was also perhaps not the most frightened”. It is not a defining characteristic of modern societies that we manage risk in a sophisticated way, this has been the case for centuries.
Reference
Christopher M. Gerrard, & David N. Petley (2013). A risk society? Environmental hazards, risk and resilience in the later Middle Ages in Europe Natural Hazards, 69 (1), 1051-1079 DOI: 10.1007/s11069-013-0750-7
23 October 2013
Review of a paper: landslide scenarios for a large Seattle earthquake
Regular readers will know that the lack of attention that is paid to potential and actual landslide impacts during earthquakes in upland areas is a real hobby-horse of mine. Time and again we see the situation in which there is a lack of preparedness for landslides, causing huge disruption to the response and recovery operations, even though the threat was entirely forseeable. It is pleasing to see increased interest in the science of this issue in recent years, with a succession of good papers exploring both the mechanics of the landslide process (which is a very complex problem) and the likely occurrence of landslides. This week, a paper has been electronically released on the BSSA website, to appear in a forthcoming edition of the journal, which examines the likely impact of landslides in the event of a Mw=7.0 earthquake of a “Seattle earthquake” – i.e. a quake on the Seattle Fault in Seattle, Washington. The paper, Allstadt et al. (2013) uses synthetic broadband seismograms to model shallow landslides in the area likely toi be affected by such an earthquake. Such an analysis is complex and computationally extremely intensive. I should also note that the technique uses the so-called Newmark method to model the slope behaviour. Newmark is basically the best technique that we have at our disposal at present, and so the team were right to do this, but in my view it is somewhat deficient in terms of the ways in which it models slope behaviour. We need a better technique; the trouble is that at the moment we do not have one.
Putting those concerns to one side, the novel element of this is the use of the synthetic seismic data. However, given that this is a landslide blog I am going to leave that for the seismologists to discuss and analyse, and instead look at what the work shows us in terms of likely landslide impacts in such a Seattle earthquake. Figure 1 from the paper, shown below, is a map of the Seattle area showing in red the areas that have been identified by the city as being prone to landslides and in black triangles the Seattle Fault. The last significant earthquake on that fault was about AD900; the recurrence period of earthquakes is in the range 200 to 12,000 years:
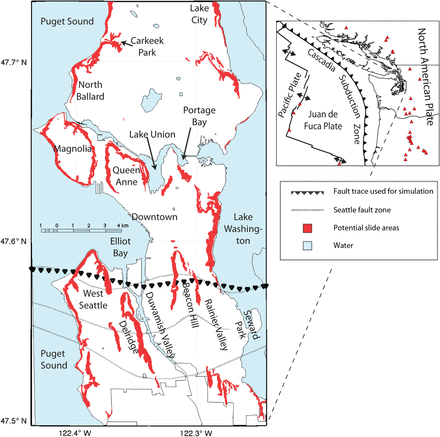
Figure 1 from Allstadt et al. 2013. Original caption: “Map of Seattle showing location of Seattle fault zone (dotted line), frontal fault location used for rupture model for landslide simulation (line of triangles), and potential landsliding areas designated by the City of Seattle. Neighborhoods and landmarks mentioned in the text are labeled. Inset map shows regional tectonic setting and volcanoes (triangles).”
The researchers ran two different scenarios for the landslides associated with a Seattle earthquake. In the first they assumed that the earthquake occurred when conditions were dry. In this case the earthquake generated just 4,977 landslides covering a source area of about 0.2 square kilometres. On the other hand, when the scenario was run for saturated conditions – in this case they generated 30,000 landslides covering 1.9 square kilometres in the city. It has long been hypothesised that antecedent weather conditions play a strong role in determining coseismic landslide distributions – this study supports that view. Fortunately, the extreme ends of the spectrum represented by these scenarios are unlikely – the probability is that the earthquake would occur when groundwater levels are somewhere between the two.
The consequences of the landslides in either scenario would be very serious indeed. In the best case scenario, shown in the figure below from the paper, landslides would impact heavily on the coastal bluffs of Seattle and in scattered locations around the south side of the city. In the worst case scenario, also shown below, the southern half of Seattle would suffer extremely high rates of landsliding, and even the northern half of the city would be affected.
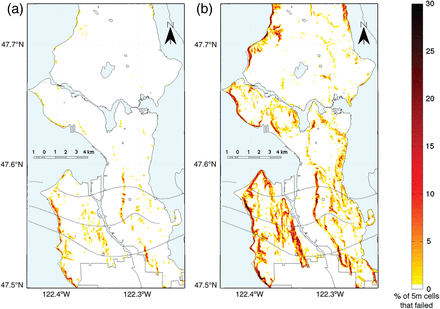
Figure 10 from Allstadt et al (2013). Original caption: Percentage of cells in each area where failures were triggered, as defined in the text for the (a) dry and (b) saturated soil conditions for the Mw 7.0 Seattle fault earthquake simulation.
The paper then considers the consequences of these landslides in terms of infrastructure impacts. The authors calculated the numbers of buildings at risk from these landslides (although not all such structures would be affected in an actual event). For even the best case scenario over 1,000 buildings lie in zones with elevated hazard ratings, of which 400 were in the two highest hazard classes. In the worst case scenario 8,000 buildings were in an elevated hazard zone, of which 5,000 were in the highest hazard classes. A further 8,500 buildings are in zones that might be affected by landslide debris runout. Of course this means that many roads, railways and pipelines are also at risk.
The authors acknowledge in the paper that because our understanding of seismically-triggered landslides is so poor there is considerable uncertainty in these analyses, and much more work is needed. I agree with this, but the research is clearly flagging a major and important hazard that deserves attention. I should also add that in one respect the research plays down the risk though. Experience from elsewhere suggests that the first really heavy rainfall event after the earthquake induces many more landslides, and that landslide activity would remain at a highly elevated level for years or even decades after a Seattle earthquake. Thus, we would expect to see many additional landslides after the main shock, and these landslides are likely to be very damaging.
Reference
Allstadt, K., Vidalem J.E., & Frankel, A.D. (2013). A Scenario Study of Seismically Induced Landsliding in Seattle Using Broadband Synthetic Seismograms Bulletin of the Seismological Society of America : 10.1785/0120130051
21 October 2013
Pure geovandalism “justified” as rockfall prevention in Goblin Valley State Park, Utah
The video below, which was taken in Goblin Valley State Park in Utah, appears to have been posted on the Facebook site of these three individuals, who are called Dave Hall, Glenn Taylor and Dylan Taylor. These rock formations, which are known as hoodoos, are unusual and of course irreplaceable:
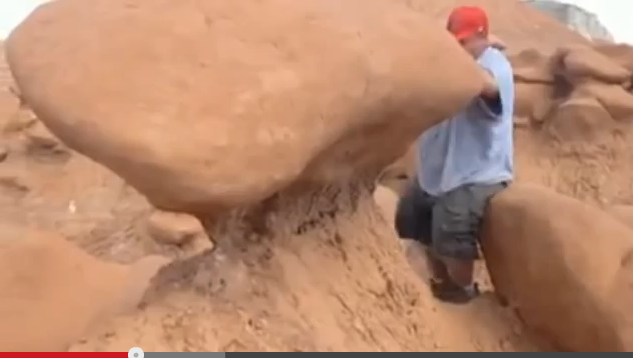
After the Hoodoo was destroyed by Glenn Taylor (as shown in the image below), the person filming this crass act of geovandalism said:
“Some little kid was about ready to walk down here and die and Glenn saved his life by getting the boulder out of the way, so it’s all about saving lives here at Goblin Valley.”
..
So the justification for this act, undertaken by three Scout leaders, seems to have been risk reduction from rockfall hazards. So, does this justification hold water? In a word, no. The likelihood of this block toppling off its pedestal at the time that a small child was walking past is almost infinitesimally small. Eventually the stone would have fallen naturally (though probably not for a very long time); the likelihood would be that this would occur as a result of a combination of strong winds and wet conditions, when the park would have been mostly empty. Even if it had occurred spontaneously on a calm day, the probability of someone being in the very small area at risk would be low, and even then they would have stood a good chance of moving.
In other words, there is no justification for this act in terms of a meaningful reduction in rockfall hazard. This was nothing less than an act of pure vandalism. Fortunately, this has received considerable publicity (the Youtube video has received 4 million hits, and the comments left by viewers are mostly critical (e.g. “They aren’t Scout Leaders, they’re leaders in stupidity, vandalism, and who lack common sense”), plus it has been covered by the international media. Fortunately, Utah State Parks Authority are planning to take action.
19 October 2013
Aerial images of the Izu-Oshima debris flows in Japan
Thanks to @levrem on Twitter (for which I use @davepetley ), my attention has been drawn to an excellent Google crisis map of the Izu-Oshima debris flows in Japan. This site provides both vertical aerial photographs and oblique images of the landslides. So let’s start with an over view of the landslide complex from the crisis map:
 ..
..
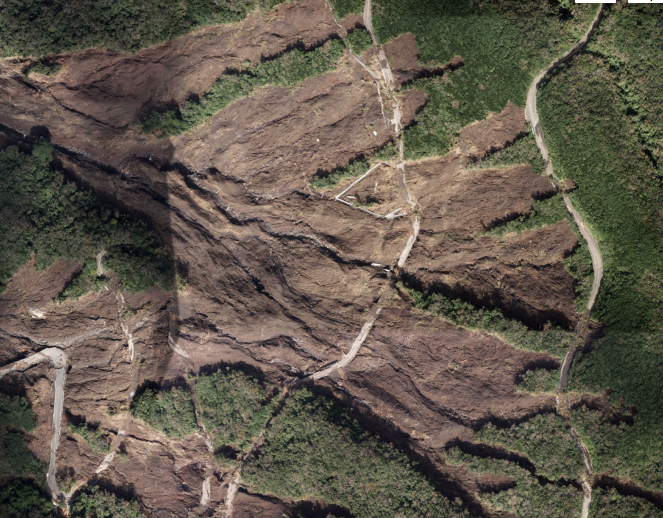
Now let’s take a closer look at the source area of the landslides:
 ..
..
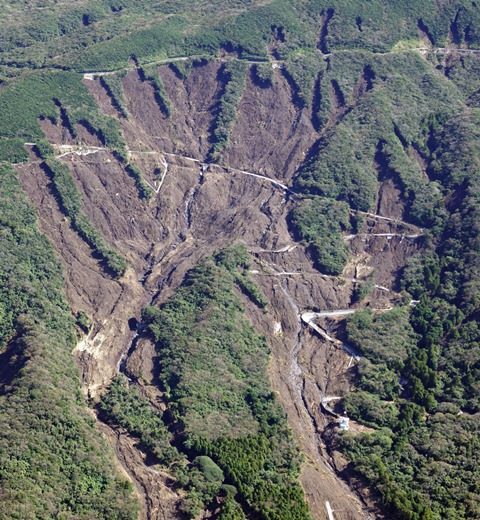
The Google Crisis map also has an oblique aerial image of the landslides (and several others):
 ..
..
Several people have asked why I find these landslides so surprising. It is clear from the images above that this landslide actual consisted of multiple landslide events all feeding into a two distinct major debris flows. This in itself is not unusual. What is surprising here is that these individual landslides have in effect failed the entire hillside – i.e. it is their proximity that I find surprising. There may be a number of explanations – the remarkable rainfall event (total rainfall is reported to have been 824 mm, with a peak intensity of 122.5 mm in an hour), the presence on the slopes of soils formed from volcanic ash, and the presence of the road (the close proximity of the crowns of the landslides and the road at the top of the slope is an interesting aspect of this).
The death toll from the landslides is now 27 people, with searches continuing for those who are still missing. The huge impact of these landslides can be seen by comparing these images, before and after the debris flows:
Before:
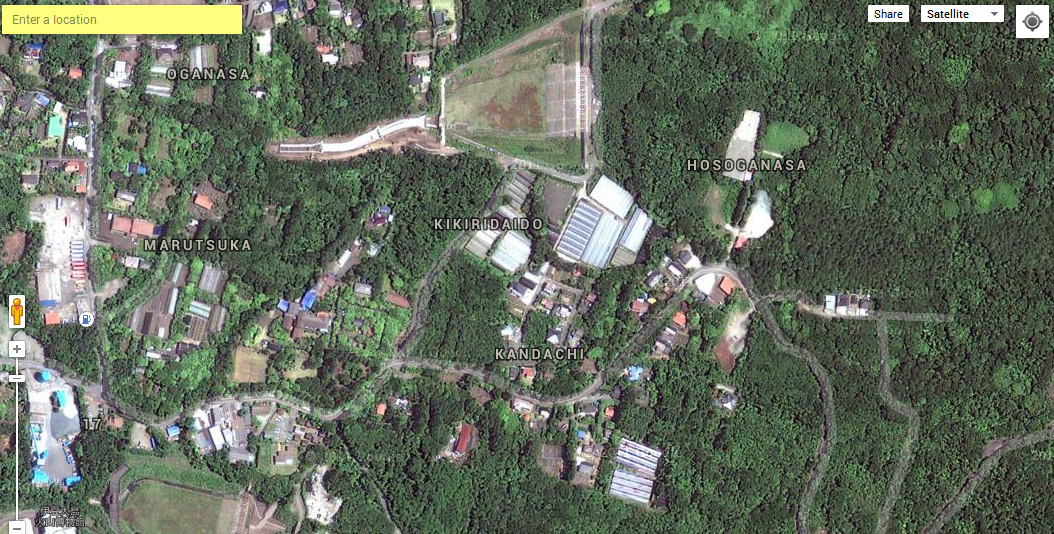 ..
..
And after:
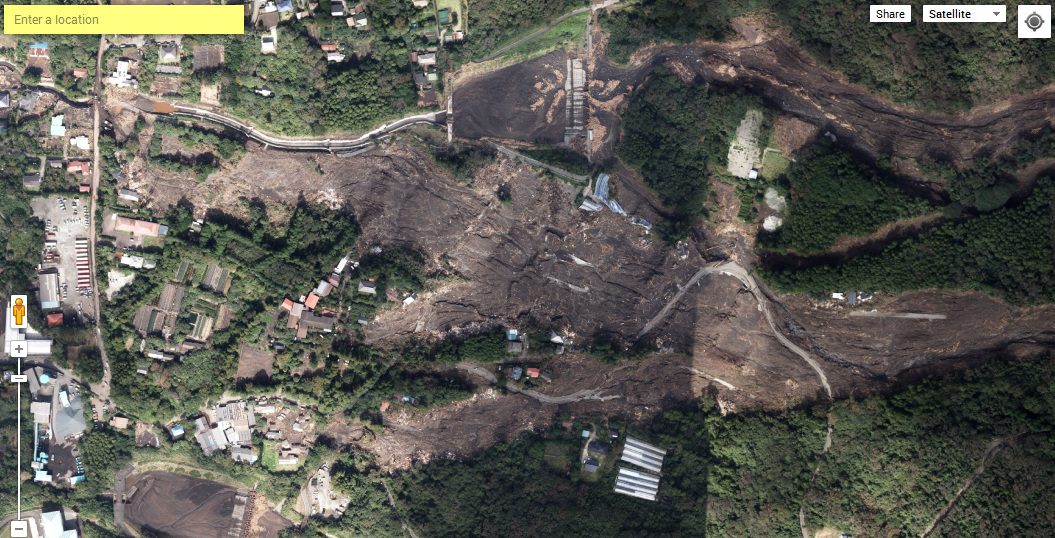
..
Unfortunately this area is likely to get more heavy rainfall in the next few days, and the track of Typhoon Francisco suggests that could also pass close to this area.
18 October 2013
A brief update on, and first images of, the astonishing Izu-Oshima debris flow in Japan
Although the amount of publicity in the west seems remarkably low, in Japan efforts are continuing to recover those lost from the catastrophic Izu-Oshima debris flow event. This event triggered by the passage of typhoon Wipha earlier this week, has caused immense damage. According to Yomiuri Online, in Japanese, to date 23 bodies have been recovered whilst another 26 people remain missing. Unfortunately, now that the 72 hour mark since the disaster has passed, the likelihood of any further survivors being found is very low.
Images of the site remain quite difficult to locate. The best I have found to date is this one, from the BBC News website:
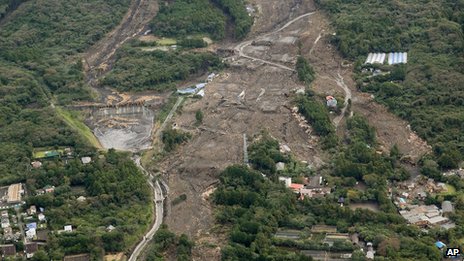 ..
..
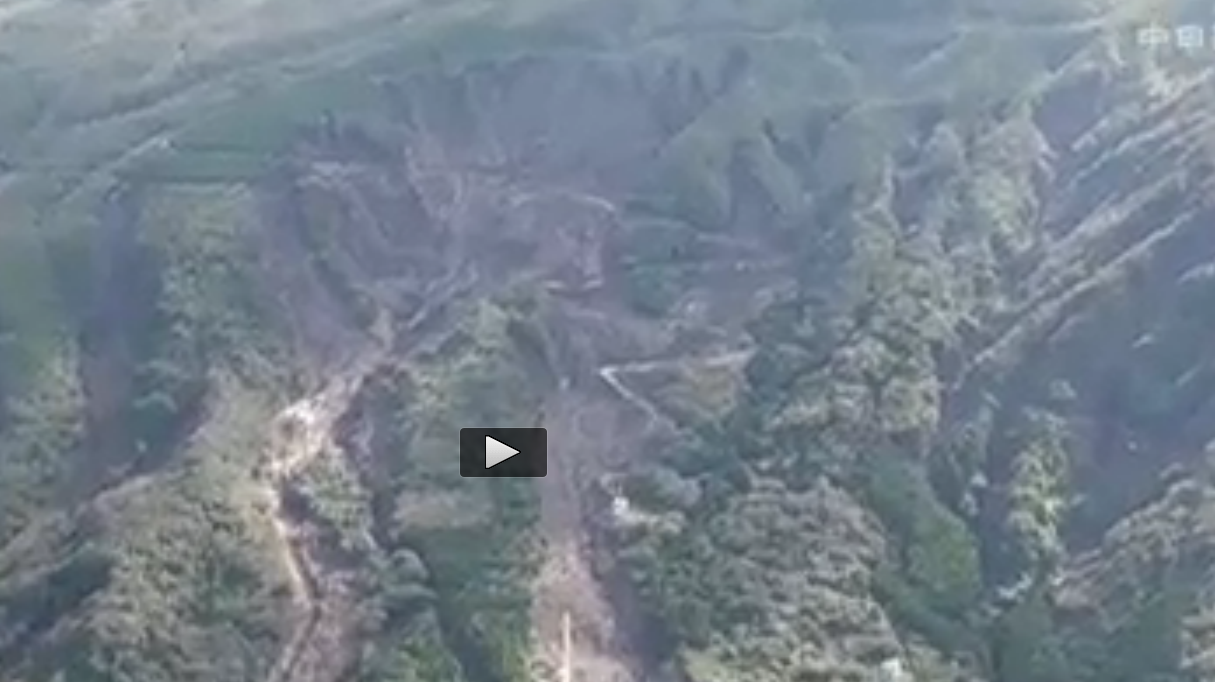
There are very few images of the source of the Izu-Oshima debris flow – the best I have come up with is the video on this Japanese website. But – wow, this is quite amazing. These two are screenshots from the video (excuse the low resolution):
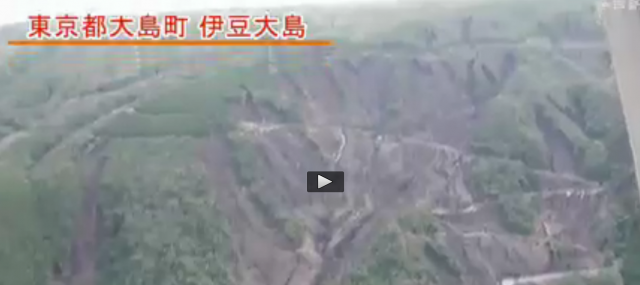 ..
..
 ..
..
So the landslides here are not what one would expect – instead of being simple slips that channelised into debris flows they are multiple, massive slope failures. This is quite an exceptional event – I hope that better images will become available soon. It is not hard to see why so many lives have been lost.
17 October 2013
Bluff collapse events: new videos from the USA and Canada
Two new videos have emerged on the web in the last few days showing coastal bluff collapse events:
1. Port Townsend in Washington State
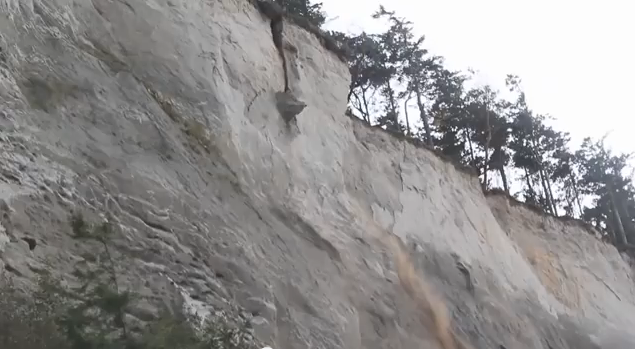
This excellent video on Youtube shows the collapse of a north-facing bluff in soft glacial till. There is a full description of the site and the event on excellent the Observations of Washington State Landscapes, Geology, Geography, History and Land Use blog by Dan McShane:
The video catches the initial collapse event, which happened on 13th October at about 6 pm, really well, with fractures opening as the main block detaches, as this screenshot shows:
 …
…
2. Wreck Beach on the Campus of UBC in Canada
A similar, though most gradual event, also occurred on the bluffs above the famous Wreck Beach in Canada, which lies on the campus of UBC on the edge of Vancouver. I am not sure if the embed will work here – if not then there is a video report of the event with an interview with John Clague here:
…
And a nice video of the collapse event here (and please be assured that the video is less racy than it might appear from the title!):
…
….
Thanks to Peter Weisinger for highlighting this one to me.
16 October 2013
Initial news of landslides from the earthquake in the Philippines yesterday and Typhoon Wipha in Japan today
1. The M=7.1 earthquake on Bohol Island in the Philippines
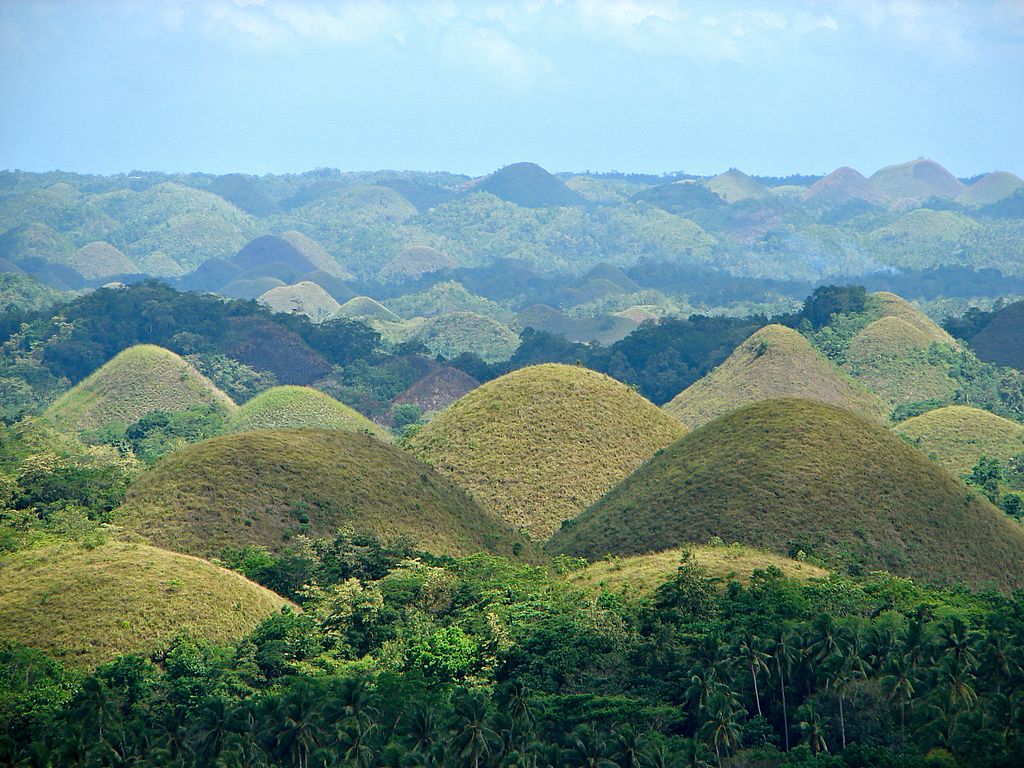
Yesterday’s earthquake in the Philippines is now known to have killed at least 107 people. Over the next few days, the Philippines disaster management agency, NDRRMC, will release a series of very informative reports about the costs of this event, and the casualties, but at this stage information remains quite sketchy. However, this is most definitely landslide country, so it is likely that there will be at least some losses from this cause. At the moment, the best information I can find is on the Earthquake-Report website, which provides some images of landslides. A part of the area affected is the rather unusual “Chocolate Hills”, which look like this (image from here):
http://jrosenberry1.files.wordpress.com/2013/04/chocolate-hills-bohol-philippines-wikipedia.jpg
..
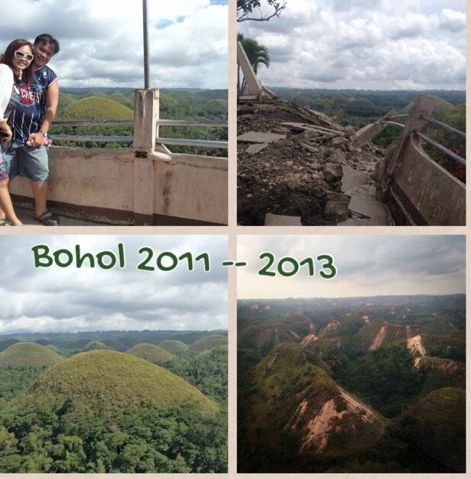
The Earthquake-report blog has these images of a part of this area, suggesting that there has been some landslide damage:
Courtesy of @docjolt and Earthquake-report.com
..
These are classic earthquake-induced landslides – shallow failures eminating from the top of the slope. However, a close up of one of these hills suggests a very interesting failure mode:
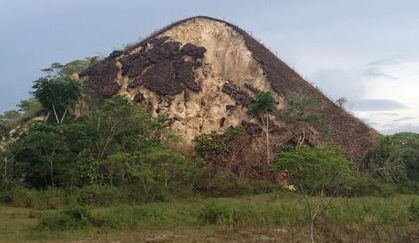
Courtesy of Earthquake-report.com
…
In terms of losses, Earthquake-report.com are reporting the following:
- The highway in Cortes particularly in Lilo-an was rendered impassable due to a landslide. A part of Cortes’ highway was also damaged.
- Many … deaths have occurred in a collapsed hospital (Congressman Castillo Memorial Hospital at the Loon municipality on Bohol, and due to landslides.
- In Balilihan, the Bohol Mayor, Dominisio Chatto has confirmed that 5 people died from a landslide due to the earthquake.
2. Typhoon Wipha in Japan
Meanwhile, earlier today Typhoon Wipha swept across Japan, bringing quite exceptional levels of rainfall (some areas are reported to have received over 800 mm). Current reports suggest that at least 14 people have been killed and a further 50 people may be missing, although these numbers will change during the day. Most of the deaths are reported to be the result of landslides, primarily on the island of Izu Oshima. Again, information is sketchy at the moment about this event. The Japan News suggests that the number missing is 43. There is little doubt that much of the loss has been caused by landslides- this image (from RT) very clearly shows a landslide event:
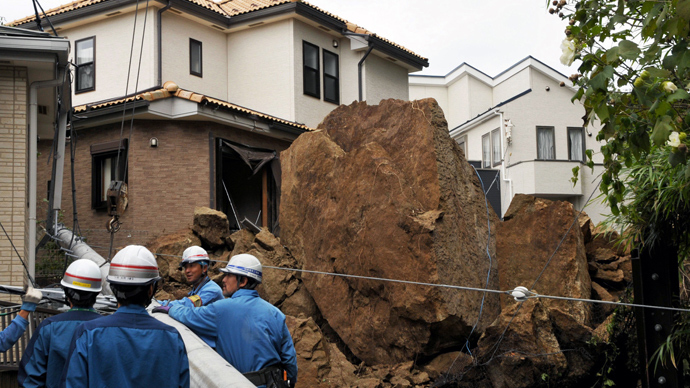
http://rt.com/news/typhoon-japan-fukushima-leaks-219/
..
Some if the things reported as landslides appear to be very complex events that are rather hard to interpret at this stage due to the very large ampunt of wood present, such as this one:
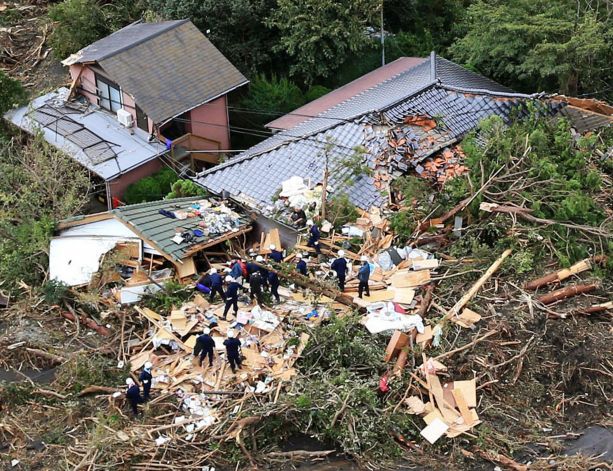
http://www.sfgate.com/news/world/article/7-dead-more-missing-as-typhoon-lashes-Tokyo-area-4899048.php
…
We will have to wait for a few more hours to know the true story on these events, but landslides appear to have played a key role in both cases.
 Dave Petley is the Vice-Chancellor of the University of Hull in the United Kingdom. His blog provides commentary and analysis of landslide events occurring worldwide, including the landslides themselves, latest research, and conferences and meetings.


Recent Comments