5 April 2017
Mocoa debris flow: analyses of the event
Posted by Dave Petley
Mocoa debris flow: analyses of the event
The loss of life from the Mocoa debris flow is now known to have exceeded 290 people, of whom 144 are reported to be children, whilst the search continues for those who are missing. NASA Earth has now published an analysis of the rainfall event that triggered the landslide, noting that:
IMERG data were used to estimate the amount of rain that fell near Mocoa, Colombia, during a seven-day period from March 26 to April 2, 2017. IMERG indicated that area rainfall totals during the week were frequently greater than 80 mm (3.1 inches). The analysis also showed the locations of heavy rainfall that extended from east of Mocoa into the high mountains that surround the city.
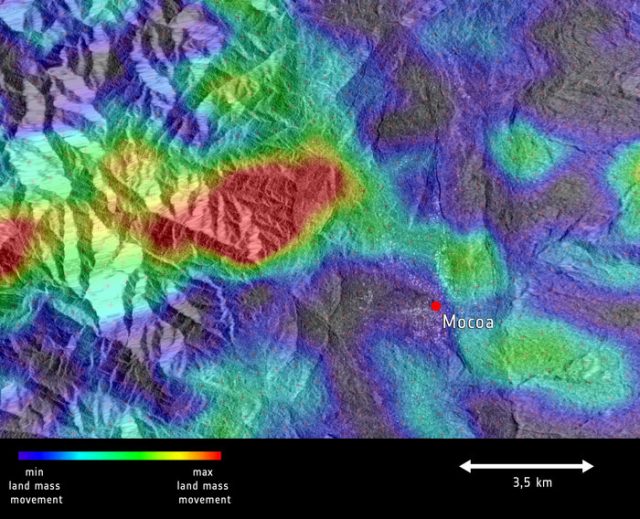
Meanwhile the ESA has released a slightly weird interpretation of “land movement”, based on an analysis of Sentinel 1 data byI. Parcharidis, of the Harokopio University of Athens :-

Sentinel 1 analysis of “land movement” close to Mocoa, processed by I. Parcharidis, Harokopio University of Athens, via ESA
.
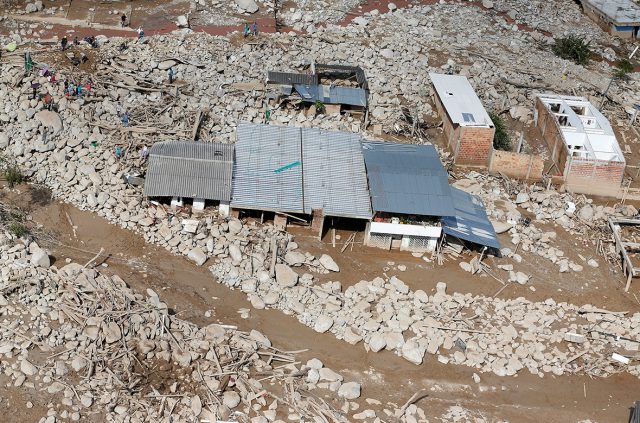
The red area cannot be a single landslide, and thus is not a simple explanation for the Mocoa debris flow. I wonder if this is area something to do with canopy wetness, or soil moisture, and thus indicates where a cloudburst type of rainfall event might have occurred? Others, who know more about radar data, may be able to comment. Meanwhile IBTimes has an excellent if heartbreaking gallery of images of the aftermath of the debris flow, which includes this image of the boulders transported by the debris flow:

The aftermath of the Mocoa debris flow. Photo by Jaime Saldarriaga/Reuters via IBTimes.
.
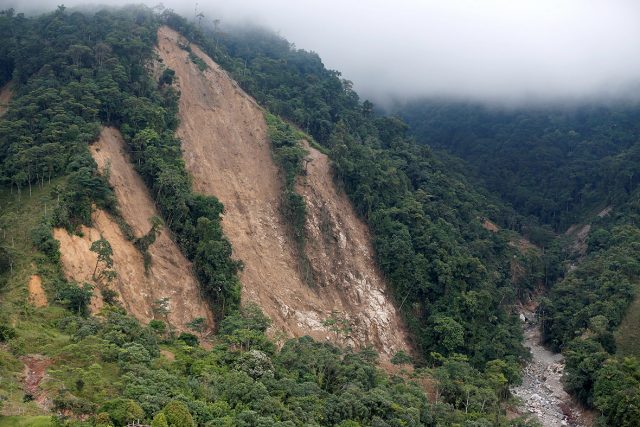
Exactly what happened upstream of Mocoa remains unclear, but this image appears to support my hypothesis that the Mocoa debris flow might have started as one or more shallow landslides that transitioned into a channelised debris flow.

Landslides upstream of the Mocoa debris flow. Photo by Jaime Saldarriaga/Reuters via IBTimes
These events can be unbelievably violent – the best video of one of these events remains the Lantau debris flow of 2008:
.
It is hard to imagine that ploughing through the town. Unbelievably dreadful.


 Dave Petley is the Vice-Chancellor of the University of Hull in the United Kingdom. His blog provides commentary and analysis of landslide events occurring worldwide, including the landslides themselves, latest research, and conferences and meetings.
Could the ‘red’ area register because what is being detected is relative strain? You might look at the article about how the tilt of the Millennium Tower, in San Francisco, is ‘seen’ by satellite.
http://sfist.com/2016/11/28/scientists_can_see_the_millennium_t.php