4 June 2010
Attabad: a different set of discharge data
Posted by Dave Petley
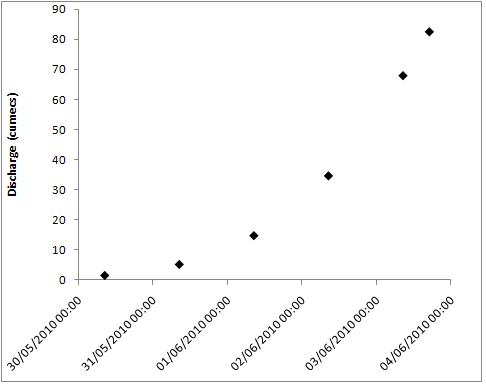
Thanks to Aftab Sadiq of the School if Civil and Environmental Engineering at NUST for passing on a revised set of spillway discharge data. This set was collected by the FWO. It is almost identical to that published here previously, with one important exception. The graph of discharge against time is as follows (correct to 17:00 yesterday, local time):
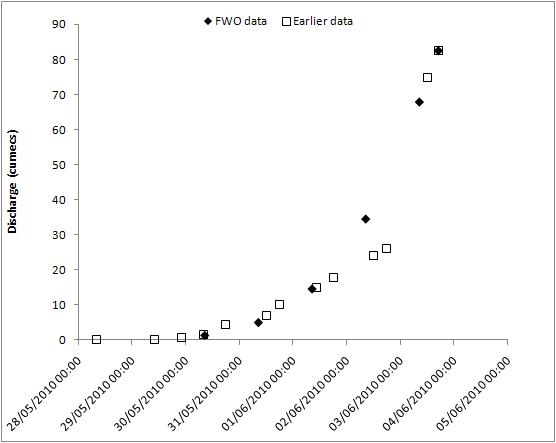
The difference between this and the data that I have published previously is shown in this graph:
The key difference is for the data of 2nd June, when the FWO recorded a rather higher discharge than did the earlier dataset. I noted yesterday that the linear trend in the earlier dataset was somewhat odd – the FWO data does not show this. The difference is minor on the one hand, but important on another. If we take the original dataset, the apparent sudden stepped increased in discharge yesterday appeared to suggest a major change in process – i.e. that erosion had initiated. The FWO data suggests that the process is unchanged – i.e. we are continuing to see an increase in flow associated just with the increasing lake level. Given that as far as I am aware no breach has developed, my inclination is that the FWO data may have captured the processes on 2nd June better, but this is uncertain at the moment.
It will be very interesting to see what today’s data might bring. As it appears that discharge and inflow are now coming close to each other we might expect to see the discharge plateauing. However, some channel erosion will continue, so the situation is far from resolved.
Discussions with the team that dealt with Tangjiashan showed that one of their key concerns was that overtopping would be followed by equilibrium conditions, leaving the hazard in place and creating a very difficult management task downstream. At Hunza we have a repeat of this situation. In the end at Tangjiashan they resolved this by blasting the boulders that controlled the flow in order to initiate a breach event. Given that they do not communicate with me at all, I have no idea what the plans of NDMA might be.
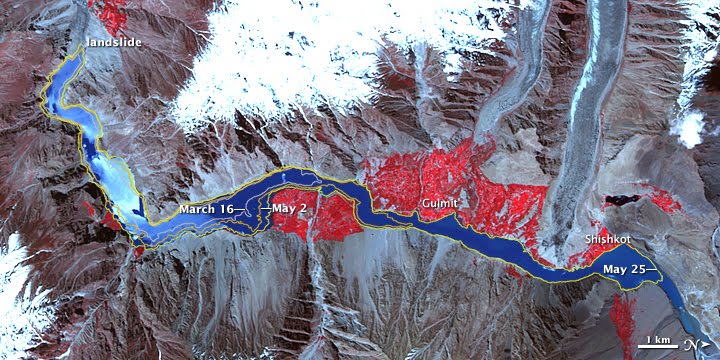
Finally, there is a new NASA ASTER image, collected on 1st June, of the site available:
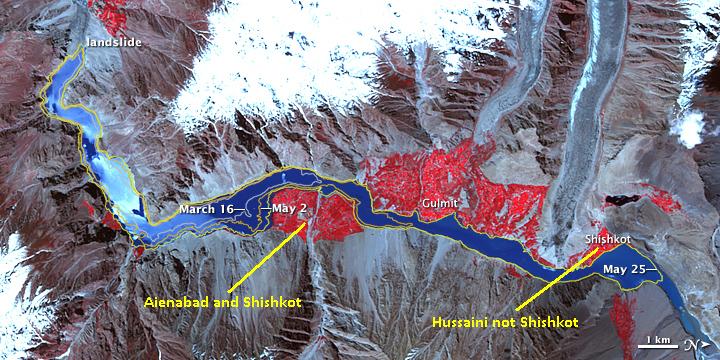
However, thanks to G.M. Shah of AKU for pointing out that there are some errors in the labeling on this series of images. The key issue is that the location of Shishkot is incorrect:
I will post again when I have further information. And finally, from a personal perspective, thanks to all who wished me luck in my move – it is complete. I am now getting used to living on my own for the first time in 16 years!


 Dave Petley is the Vice-Chancellor of the University of Hull in the United Kingdom. His blog provides commentary and analysis of landslide events occurring worldwide, including the landslides themselves, latest research, and conferences and meetings.
dave,thanks for your most informative updates on the situation.Is it conceivable that there is no big flood (or even a small one?)The discharge is now almost at inflow rate and erosion doesn't seem as rapid as feared…could we envisage a scenario where there is a very gradual lake lowering, with erodable material washing through, leaving behind a heap of large imovable boulders? To me it seems hard to imagine how a landslide mass of this volume could suddenly give way..the gradient from lake level to downstream river level seems too shallow for this to happen…
shamoon…good points. I think the monsoon rains ( as and when they arrive will impact this majorly). hopefully by then they can control outflow > inflow. institutions like NDMA etc should be manned by professionals… not retirees.
hey dave… did you spend too much time on this blog and so got the boot :-)))
Dr Petley,Thank you for your continued interest in Attabad.One word of caution: please do not rely on data from FWO. They are the same FWO who claimed to have made a 20 meter wide spillway that turned out to be 3 meters wide.I think FOCUS is very professional organization and I will trust their data.They have 4-5 professional geologist on site in Attabad .The time at which data is collect also make difference and also at place where data is acquired.thank you keeping the world informed about this very large landslide and water build up.What is the estimate of water volume in lake.?Has any new dam modelling of dam breaking been done? How high will be the water?Thanks you
Is it possible to graph the relation between the depth of the Attabad lake and the spillway flow?
Thank you for the detailed information and corrections to the labels on ASTER imagery from NASA (originally provided through NASA’s Earth Observatory). One of your readers pointed out the errors in labeling, and we’ve adjusted the labels to match. We’ll continue to post updated NASA imagery as it arrives