
11 December 2008
The Vaiont (Vajont) landslide of 1963
Posted by Dave Petley
For some 12 or so years I have maintained a set of notes on the amazing Vajont (sometimes spelt Vaiont) landslide of N. Italy. This is the most deadly landslide in Europe in recorded history. For a while I have been meaning to move the notes over to here – today I have finally got around to it, so here they are:
THE VAJONT LANDSLIDE
Introduction
The Vajont reservoir disaster is a classic example of the consequences of the failure of engineers and geologists to understand the nature of the problem that they were trying to deal with. During the filling of the reservoir a block of approximately 270 million cubic metres detached from one wall and slid into the lake at velocities of up to 30 m/sec (approx. 110 km/h). As a result a wave over topped the dam by 250 m and swept onto the valley below, with the loss of about 2500 lives. Remarkably the dam remained unbroken by the flood.
Location and background
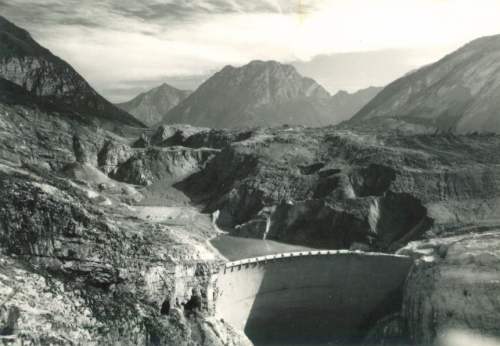
Vajont is located in the south-eastern part of the Dolomite Region of the Italian Alps, about 100 km north of Venice. It was built as a part of the on-going, post-war development of Italy in order to provide HEP for the rapidly-expanding northern cities of Milan, Turin and Modena. Whilst a proposal to site a dam at this location was made in the 1920’s, excavation of the site began in 1956 and the dam was completed in 1960. The completed doubly curved arch dam was, at 265.5 metres above the valley floor, the worlds highest thin arch dam. The chord of the dam was 160 m, and the volume of impounded water was 115 million cubic metres.
 The dam was built across the Vajont Valley, a deep, narrow gorge. The geological setting of the valley was fully understood. In this area, the mountains tend to be characterised by massive, near-vertical cliffs formed in the Jurassic Dogger formation and underlying Triassic formations. The local valleys tend to be associated with outcrops of the weaker formations, particularly the Upper and Lower Cretaceous and Tertiary units, which contain more clays and are more thinly bedded. Thus the generalised geological structure is of a syncline cut by the valley. The syncline is based in middle Jurassic limestone, overlain with successive layers of upper Jurassic limestone with clay and Cretaceous limestones.

Order of events
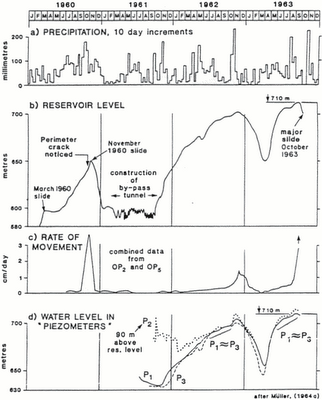
The order of events should be examined in conjunction with this diagram (click on it for a better view in a new window):
 1. Prior to the Completion of the Dam
It appears that during the construction of the dam the chief engineer was concerned about the stability of the left bank of the dam, and a number of reports were compiled on this during 1958 and 1959, which identified a possible prehistoric slide on the right bank. Whilst there was considerable discussion of the stability of the valley walls in view of the inclined synclinal form of the strata and the possibility of old slides in this area, it was concluded that deep-seated landslides were extremely unlikely as (see Muller 1964 for a review of this):
- areas of weakness were not identified in the three test borings;
- it was assumed that any shear plane would have a ‘chairlike’ form that would exert a ‘braking effect’;
- seismic analyses had suggest that the banks consisted of very firm in-situ rock with a high modulus of elasticity.
Smaller slides in the looser surface layers were considered to be likely, although volumes and velocities of movement were expected to be low.
2. During the First Filling of the Reservoir
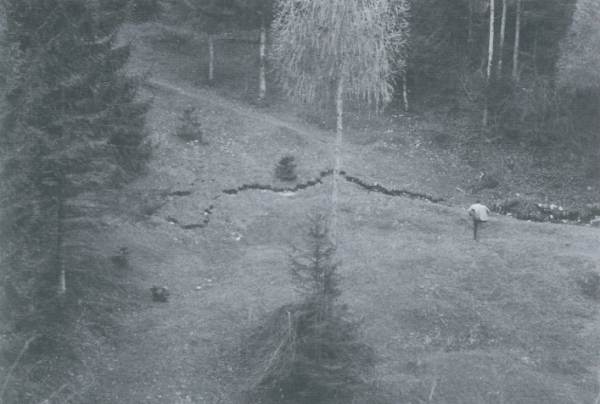
Filling was initiated in February 1960, before final completion of the dam (which occurred in September 1960). By March 1960 the level of the reservoir had reached 130 m above the level of the river, when the first small detachment occurred. Continued filling of the reservoir occurred whilst monitoring of the movements in the banks was undertaken. In October 1960, when the depth of the reservoir had reached 170 metres, a rapid increase in the rate of displacement to approximately 3.5 cm/day was observed. At the same time a huge joint of 2 km length opened up, defining an area about 1700 m long and 1000 m wide, suggesting that a very large landslide had been mobilised. This is the crack:
On 4th November, with the depth of the reservoir at 180 m, a large failure occurred when 700,000 cubic metres of material slid into the lake in about ten minutes. As a result the level of the reservoir was gently dropped back to 135 m. At this point movement reduced to close to 1 mm/day. This is the 1960 failure:

It was realised by the designers of the dam that the large mass of the left bank was inherently unstable. However Muller (1964) stated that:
‘It appeared hopeless to arrest the slide artificially, because all means that would have had to be applied were beyond human bounds. It was also impossible to either seal the surface of the area, to shift the weight or to cement the rock by means of
injections. On the other hand the possibility of accelerating the sliding movement in order to let the entire mass to slide down all at once had to be excluded. The danger arising for the formation upstream of the slide by an uncontrollable level of the storage lake would have been too great.’
Thus it was decided that an attempt could be made to gain control of the sliding mass by varying the level of water in the reservoir whilst controlling the joint water thrust within the rock mass by means of drainage tunnels. It was realised that this could lead to the blockage of that section of the reservoir by the landslide mass. However the volume of water in the unblocked (upstream) section would still be sufficient to allow the generation of electricity. Hence a bypass tunnel was constructed on the opposite (right) bank such that if the reservoir was divided into two sections the level of the lake could still be controlled.
It was assumed that by elevating the level of the reservoir in a careful manner movement of the large landslide mass could be initiated. The rate of movement could be controlled by altering the level of the lake. It was realised that a final sudden movement might occur, and it was calculated that, so long as the movement did not exceed a rate that would lead to filling of the reservoir by the landslide in ten minutes or less, over-topping of the dam would be avoided.
3. First Draw-Down of the Reservoir
Creep had been initiated by the initial filling of the reservoir. As the level was subsequently drawn down, rates of movement decreased from a maximum of about 8 cm/day to 3 mm/day at a level of 185 m and less than 1 mm/day at 135 m. By this time the main landslide mass had moved an average of about 1 m.
4. Second Filling of the Reservoir
From the beginning of October 1961 through to early February 1962 the water level was raised to 185 m, followed by a phase of slow impoundment such that in November 1962 the level had reached 235 m. During the early part of this phase velocities did not substantially increase, but by the end of the phase velocities had increased to 1.2 cm/day.
5. Second Draw-Down of the Reservoir
In November 1962 a second lowering of the level was slowly undertaken, with the water depth decreasing to 185 m after four months. Initially displacements remained high but in December they began to reduce and, by early April when the water height had reached 185 m, the rate was effectively zero. The experiences gained from the second phase of filling and the subsequent draw-down confirmed to the engineers that control of the landslide was possible by altering the level of the reservoir. In consequence a third filling of the reservoir was undertaken.
6. Third Filling of the Reservoir
Between April and May 1963 the reservoir level was rapidly increased to 231 m. Slight increases in velocity were noted, but rates never exceeded 0.3 cm/day. During June the level was increased to 237 m and the rate of displacement increased to 0.4 cm/day. In mid July the level reached 240 m and some of the control points indicated small increases in displacement to 0.5 cm/day. The level was maintained through to mid-August, but during this time velocities increased to 0.8 cm/day. In the latter part of August the level was increased once more such that by early September the depth of water was 245 m. In some parts of the slide velocities increased to as much as 3.5 cm/day.
7. Third Drawing Down of the Reservoir
In late September the water level was slowly dropped to bring the rates of creep back under control. By 9th October a depth of 235 m was reached. However velocities of movement continued to slowly increase, and rates of up to 20 cm/day were recorded.
8. Catastrophic Failure
At 22:38 GMT on 9th October 1963 catastrophic failure of the landslide occurred on the slope shown below.
 Before failure
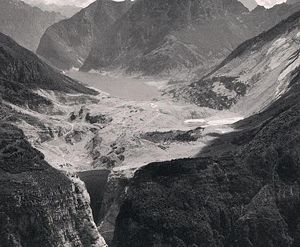 After failure
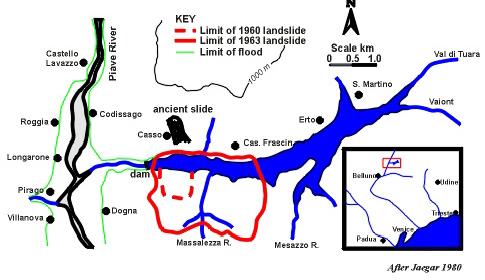
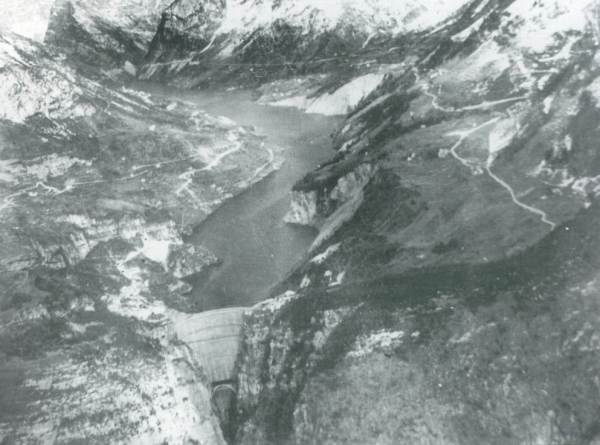
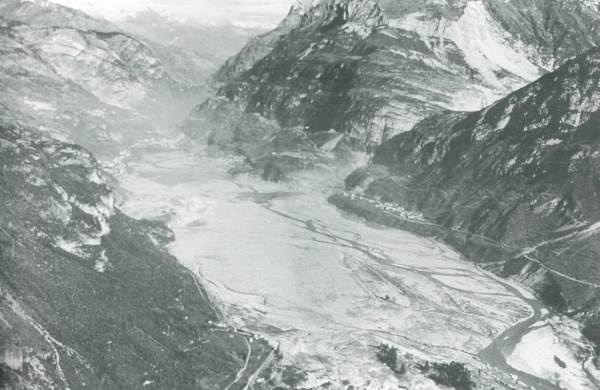
The entire mass slid approximately 500 m northwards at up to 30 m/sec. The mass completely blocked the gorge to a depth of up to 400m , and it travelled up to 140 m up the opposite bank. Movement of the landslide mass ceased after a maximum of 45 sec. At the time the reservoir contained 115 million cubic metres of water. A wave of water was pushed up the opposite bank and destroyed the village of Casso, 260 m above lake level before over-topping the dam by up to 245 m. The water, estimated to have had a volume of about 30 million cubic metres, then fell more than 500 m onto the villages of Longarone, Pirago, Villanova, Rivalta and Fae, totally decimating them. A total 2500 lives were lost. The image below shows the location of these villages after the flood. The valley floor, on which the villages were located, has been wiped clean by the water. The flood wave came down the Vajont valley, which can be seen in the upper right of the image:
However the dam was not destroyed and is still standing today. The by-pass tunnel is used for the generation of HEP.
Causes of the landslide
Since the catastrophic failure, a huge range of work has been undertaken on the causes of the failure. Initially the was a large amount of speculation about the location of the sliding surface, but more recent studies have confirmed that it was located in thin (5 – 15 cm) clay layers in the limestone. It is claimed by some that as such it represents a reactivation of an old landslide (Hendron and Patten, 1985; Pasuto and Soldati, 1991), whilst others claim that it was a first-time movement (Skempton, 1966; Petley, 1996). It is likely that increasing the level of the reservoir drove up pore pressures in the clay layers, reducing the effective normal strength and hence the shear resistance. Resistance to movement was created by the chair-like form of the shear surface. Dropping the level of the reservoir induced hydraulic pressures that increased the stresses as water in the jointed limestone tried to drain. It has been estimated that the total thrust from this effect was 2 – 4 million tonnes (!?) (Muller, 1964). Failure occurred in a brittle manner, inducing catastrophic loss of strength. The s
peed of movement is probably the result of frictional heating of the pore water in the clay layers (Voight and Faust, 1982, 1992).
References – my papers on Vajont
Petley, D.N. 1996. ‘The mechanics and landforms of deep-seated landslides’. Brooks, S., and Anderson, M (eds). Advances in Hillslope Processes, John Wiley, Chichester.
Kilburn, C.J. and Petley, D.N. 2003. Forecasting giant, catastrophic slope collapse: lessons from Vajont, Northern Italy. Geomorphology 54, 1-2, 21-32.
Petley, D.N. and Petley, D.J. 2006. On the initiation of large rockslides: perspectives from a new analysis of the Vaiont movement record. Evans, S.G., Scasrascia Mugnozza, G., Strom, A., and Hermanns, R.L. (eds) Massive Rock Slope Failure. Kluwer, Rotterdam (NATO Science Series, Earth and Environmental Sciences 49), 77-84.
Petley, D.N., 2006. The Vajont (Vaiont) Landslide. Geo-strata, March-April 2006.
References – other
Hendron, A.J., and Patten, F.D, 1985, The Vaiont Slide. US Corps of Engineers Technical Report GL-85-8.
Jaegar, C., 1980, Rock mechanics and Engineering. Cambridge University Press, 523 pages.
Kiersch, G.A., 1964. ‘Vaiont reservoir disaster’. Civil Engineering, 34, 32-39.
Müller, L., 1964, The rock slide in the Vaiont valley. Felsmechanik und Ingenieur-geologie, 2, 148-212.
Pasuto, M. and Soldati, A. 1990. ‘Some cases of deep-seated gravitational deformations in the area of Cortina d’Ampezzo (Dolomites)’, The Proceedings of the European Short Course on Applied Geomorphology, 2, 91-104.
Skempton, A.W. 1966. ‘Bedding-plane slip, residual strength and the Vaiont landslide’, Geotechnique, 16, 82-84.
Voight, B. and Faust, C., 1982, Frictional heat and strength loss in some rapid landslides Geotechnique, 32, 43-54.
Voight, B. and Faust, C. 1992. ‘Frictional heat and strength loss in some rapid landslides: error correction and affirmation of mechanism for the Vaiont landslide’, Geotechnique, 42, 641-643.
 Dave Petley is the Vice-Chancellor of the University of Hull in the United Kingdom. His blog provides commentary and analysis of landslide events occurring worldwide, including the landslides themselves, latest research, and conferences and meetings.
Foolish for the so-called 'Engineers' to dice with fate over so many years, raising and lowering the water level to control the slide.The water, once it soaked in, making the land mas heavier, and lubricated the slip zone, anything could, and did happen.
Hi Dave,Thanks for sharing this, I did a project on the Vajont a few years ago and it's great to see even more photos of it.Thanks!
hey i'm italian…i read your post…i think it's all right..but..only one thing: geologist knew the problem about the "monte toc"…but…money was more important then 2000 people.i remember that the vajont dam was in 1959 the biggest dam in the word!sorry for english error! bye good work
The information available today on the Vajont landslide is 'ironically' refreshing. As a hobbist of water resources in the western USA, I became interested in dams around the world. And eventually (early 1990's) learned of Vajont however resources were minimal. Now almost 20 years later there is an adbundance of information on this tragic 'man made' disaster.Another (sad) irony, in 1963 I was in high school and do not remember any references, media or otherwise to this tragedy!Thanks,Rick
[…] changed water level in valley causes an increase in water level in the slopes. Sometimes, as in Vaiont, this can have unfortunate implications, and indeed it is these landslides that have caused so many […]
I have been to this Dam 3 times now, I’m Brazilian but my wife she’s Italian and From a tow called Belluno which is about 20 minutes drive to the vajont dam. its a amazing place to go and see i do have loads of pictures of this place so any one interested in some good colour pictures few free to email me and ask me for is [email protected] ….thanls all Rod
[…] 2013 will mark the 50th anniversary of the Vajont landslide disaster in northern Italy, which killed over 2000 people. To mark this event, a major international conference is being […]
[…] The Vajont Slide has been studied for over 60 years, yet many open questions on the initiation, mechanics, and kinematics of the landslide remain. In our new new paper (Wolter et al. 2015) we have attempted to answer some of these questions using a multi-faceted approach focused on the geological and geomorphological context of this infamous event. This is an aerial image of the landslide, taken in 1964. Note the dam in the upper left of the image. The huge landslide is on the southern side of the valley. The stripping of vegetation on the northern side gives an impression of the size of the displacement wave generated by the Vajont slide. It is this displacement wave that caused over 2000 fatalities in the valley below the dam. […]
Cool
[…] dams have been damaged or destroyed without any link to climate change. An infamous example is the 1963 Vajont disaster in northern Italy, where a valley wall slid into a reservoir and generated a mega-tsunami that […]