
6 February 2008
January 2007 final map
Posted by Dave Petley
Below is the fatal landslide distribution map for January 2008. I have coded the rainfall induced landslides as black dots and those caused by other causes as red dots.
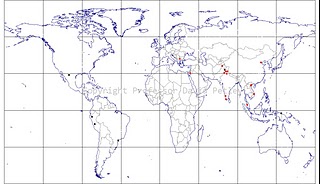 The January 2008 fatal landslide distribution map. Rainfall-induced landslides are the black dots, those caused by other processes (mostly quarrying and construction) are in red. Click on the map for a larger version.
A few observations on the data:
- I recorded 20 fatal landslides in the month with a total of 106 fatalities
- Of these, only six were triggered by rainfall, accounting for 56 deaths.
- There is a notable cluster of landslides in northern India. However, most of these were triggered construction or quarrying, so it probably represents just a coincidence.
- Overall, the total is below the long term average for the number of fatalities occurring in January.
I welcome any thoughts, observations or comments.
 Dave Petley is the Vice-Chancellor of the University of Hull in the United Kingdom. His blog provides commentary and analysis of landslide events occurring worldwide, including the landslides themselves, latest research, and conferences and meetings.